| Issue |
A&A
Volume 634, February 2020
|
|
|---|---|---|
| Article Number | A137 | |
| Number of page(s) | 25 | |
| Section | Extragalactic astronomy | |
| DOI | https://doi.org/10.1051/0004-6361/201833601 | |
| Published online | 25 February 2020 | |
Triggering nuclear and galaxy activity in the Bullet cluster⋆
1
Agenzia Spaziale Italiana-Unita’ di Ricerca Scientifica, Via del Politecnico, 00133 Roma, Italy
e-mail: This email address is being protected from spambots. You need JavaScript enabled to view it.
2
INAF Osservatorio Astronomico di Trieste, Via G. Tiepolo 11, Trieste, Italy
3
INAF Osservatorio Astronomico di Roma, via Frascati 33, 00078 Monte Porzio Catone, Italy
4
Las Campanas Observatory, Carnegie Observatories, Casilla 601, La Serena, Chile
5
Max-Planck-Institut für extraterrestrische Physik (MPE), Postfach 1312, Giessenbachstr., 85741 Garching, Germany
6
OmegaLambdaTec GmbH, Lichtenbergstr. 8, 85748 Garching, Germany
7
Department for Astrophysics, University of Vienna, Türkenschanzstr. 17, 1180 Vienna, Austria
Received:
8
June
2018
Accepted:
28
November
2019
Abstract
The analysis of a cluster environment is a valuable instrument to investigate the origin of gas fuelling and trigger mechanisms in active galactic nuclei (AGN) and star-forming galaxies. To this purpose, we present a detailed analysis of the point-like X-ray sources in the Bullet cluster field. Based on ∼600 ks Chandra observations, we produced a catalogue of 381 X-ray point sources up to a distance of ∼1.5 virial radius and with flux limits ∼1 × 10⁻¹⁶ and ∼8 × 10⁻¹⁶ erg cm−2 s−1 in the 0.5–2 keV and 2–10 keV bands, respectively. We find a strong (up to a factor 1.5–2) and significant (≥4σ) over-density in the full region studied 0.3R200 < R < 1.5R200. We identified optical (R band) and infrared (Spitzer IRAC) counterparts for ∼84% and ∼48% of the X-ray sources, respectively. We obtained new spectroscopic redshifts for 106 X-ray sources and collected from the literature additional 13 spectroscopic and 8 photometric redshifts of X-ray sources. Twenty-nine X-ray sources turned out to be cluster members. Spectroscopic and photometric redshifts of optical and infrared sources were also collected, and these sources were used as ancillary samples. We used these multi-wavelength data to characterise the nature of the Bullet cluster X-ray point sources. We find that the over-density in the region 0.3R200 < R < R200 is likely due to X-ray AGN (mostly obscured) and star-forming galaxies associated with the cluster, while in the more external region this over-density is likely to be mostly due to background AGN. The fraction of cluster galaxies hosting an X-ray detected AGN is 1.0 ± 0.4%, which is nearly constant with the radius; this fraction is similar to that reported in other clusters of galaxies at similar redshift. The fraction of X-ray bright AGN (L2 − 10 keV > 1043 ergs s−1) in the region 0.3R200 < R < R200 is 0.5−0.2+0.6%, which is higher than that in other clusters at similar redshift and more similar to the AGN fraction in the field. Finally, the spatial distributions of AGN and star-forming galaxies, which we selected for their infrared emission, appear similar, thus suggesting that both are triggered by the same mechanism.
Key words: galaxies: active / galaxies: clusters: individual: Bullet / X-rays: galaxies
Based on archival Chandra observations (PI: Murray, identification number: 554, 3184; PI: Markevitch 4984, 4985, 4986, 5355, 5356, 5357,5358, 5361) and archival data from the database of the Infrared Array Camera (IRAC) on the Spitzer Space Telescope (PI: Gonzales, Programme ID: 40593). Based on observations made with the Wide Field Imager (WFI) on the European Southern Observatory MPG 2.2 m telescope at La Silla, Chile (PI: Fiore, Programme ID: 70.A-0594(A)) and the VIsible MultiObject Spectrograph (VIMOS) mounted at the 8.2 m Very Large Telescope (Cerro Paranal, Chile) (PI: Bongiorno, Programme ID: 090.A-0267).
© ESO 2020
1. Introduction
It is generally recognised that active galactic nuclei (AGN) are powered by gas accretion onto super-massive black holes (SMBHs). However, both the origin of this gas and the detailed mechanism(s) triggering its accretion towards the SMBH are not clear yet. It is likely that galaxy interactions, and in particular major mergers of gas-rich galaxies, are the main triggering mechanisms of luminous AGN (quasars). The high luminosity of quasars must be produced by relatively high accretion rates (≈ M⊙ yr−1) which must be sustained for typical AGN timescales (of the order of 107yr), requiring that a relatively large percentage of the galactic gas is channelled towards the nucleus. In mergers, the fraction of galactic gas that is able to flow to the centre is related to the variation of the gas specific angular momentum induced by the interactions, which is in turn connected to the mass ratio of the merging partners. If the merging partners have similar masses, the variation of the specific angular momentum reaches a maximum and consequently the fraction of gas accreting to the nucleus is larger (Cavaliere & Vittorini 2000; Menci et al. 2014 and references therein). Lower luminosity AGN such as Seyfert galaxies have fuelling requirements that can be 103 − 104 lower than luminous quasars. In these cases, a number of additional, less efficient triggering mechanisms can be at work, including internal galaxy dynamics such as disc instabilities, large-scale bars, turbulence in the interstellar medium, and weakly non-axisymmetric variations in the gravitational potential (see e.g. Simkin et al. 1980; Elmegreen et al. 1998; Genzel et al. 2008; Hopkins & Quataert 2011; Menci et al. 2014). A further mode of gas accretion onto SMBH in the central galaxies of groups and clusters of galaxies, as well as isolated elliptical galaxies, is the so-called chaotic cold gas accretion (Gaspari et al. 2013; Gaspari & Sadowski 2017 and references therein), or precipitation (Voit & Donahue 2015). In these cases, low level but continuous nuclear activity, mainly in the form of mechanical power, is produced by a rain of cold gas clouds, condensing out from hot atmospheres and funnelled towards the nucleus via inelastic collisions. Finally, ram pressure is also a possible mechanism for feeding AGN, as suggested by Poggianti et al. (2017). These authors find a high incidence of AGN among a sample of “jellyfish” galaxies in clusters and suggest that this may be from ram pressure causing gas to flow towards the centre and triggering the nuclear activity.
It is extremely difficult to distinguish between galaxy interactions, internal galaxy dynamics, and chaotic cold accretion as the main trigger mechanism of AGN that are not very luminous. A promising possibility is to study AGN demography in dense environments, such as groups and clusters of galaxies. These are natural sites of frequent galaxy interactions, whose rate depends on the inverse of mass of the group/cluster M, since the merger rate scales with 1/σ3 ∼ 1/M, where σ is the velocity dispersion of a cluster of mass M (Mamon 1992). Furthermore, the rate of galaxy interaction likely depends on the distance to the cluster core1 as well because the probability of galaxy interactions is correlated with the density and anti-correlated with the velocity. Therefore this probability should be higher in the cluster outskirts, where there is low galaxy velocity dispersion (< 300 km s−1; Binney et al. 1987) and high in-falling galaxy density, than in the core.
X-ray surveys are extremely efficient tools to select AGN. Indeed, 5–10 keV X-rays are capable of penetrating column densities up to ∼1024 cm−2, allowing the selection of moderately obscured AGN. In addition, X-ray surveys allow the detection of low luminosity AGN, which are difficult to select in optical surveys because their optical light is diluted by the host galaxy stellar emission. Furthermore, AGN are the dominant population in the X-rays because they represent the majority (∼80%) of the X-ray sources, thereby making their spectroscopic observation more efficient.
Following the first pioneering studies on single or small samples of clusters, the first systematic study of a relatively large sample of clusters (51 clusters at z = 0.3–0.7) was performed by Ruderman & Ebeling (2005). These authors detect a total of about 500 sources at fluxes corresponding to moderately luminous AGN and find a significant over-density of X-ray sources with respect to the field in the central 0.5 Mpc. Gilmour et al. (2009) find again a significant over-density of X-ray sources in a sample of 148 clusters at z = 0.1–0.9 with a flat distribution up to ∼1 Mpc. Ehlert et al. in a series of three papers (Ehlert et al. 2013, 2014, 2015) analyse Chandra data of an increasing number of clusters (43 to 135) at z = 0.2–0.9, finding up to ten thousand X-ray sources, which is more that an order of magnitude improvement with respect to previous works. They find a highly significant over-density of X-ray sources per unit solid angle with respect to the field, concentrated at radii < 0.5 Mpc (or 0.5 R/R5002), and following a power-law profile R−0.6. Ehlert et al. (2014) also studied the fraction of X-ray active galaxies to the total number of galaxies brighter than R = 23 (cluster members plus foreground and background sources). These authors find that in cluster cores this is ≈3 times lower than in the field when excluding the central dominant galaxies from the calculation. The fraction of active galaxies increases with the projected distance from the cluster centre and becomes consistent with the field fraction of active galaxies at R ∼ 2.5 R500. Finally, Ehlert et al. (2015) find that the number density of X-ray sources in cluster fields scales with the mass of the cluster as M−1.2, which is consistent with the expectation based on the merging rates.
The over-densities of X-ray sources with respect to the field reported in the papers cited above are not surprising because clusters are over-dense regions of the Universe, showing galaxy densities much higher than in the field. A different question is whether the fraction of galaxies hosting an AGN is different in clusters with respect to the field, and how this fraction changes with the projected radius and mass of the cluster. Haines et al. (2012) analyse a sample of 26 clusters at z = 0.15–0.3. Using Chandra data and optical spectroscopy they find a total of 48 X-ray AGN among cluster members that have 0.3–7 keV luminosities in the range 2 × 1041 − 1044. Their luminosity function is a factor 7.5 higher than the field luminosity function, again confirming an over-density of X-ray sources in cluster fields. However, this over-density is completely due to the much higher density of galaxies in clusters and the same authors find an average fraction of active galaxies in their cluster sample of 0.73 ± 0.14%, which is not higher than in the field. Similar results have been obtained by Martini et al. (2007) and Haggard et al. (2010), who find AGN fractions of 1% and 1.19 in clusters and in the field, respectively, at redshifts similar to that of the Bullet cluster. Limiting the analysis to AGN with L2 − 10 keV > 1043 erg s−1Martini et al. (2013) find a smaller AGN fraction (0.107
 ), which is about six times smaller than in the field (Haggard 2012, priv. comm. in Martini et al. 2013, reports a field AGN fraction of 0.64
 ). Finally, Ehlert et al. (2015) note that Hubble Space Telescope images of 23 spectroscopically confirmed cluster AGN members suggest that they are hosted in merger systems; these authors conclude that the triggering of AGN is predominantly due to mergers in clusters, while in the fields more or different mechanisms can be at work.
In this paper we re-examine in a single peculiar field covered with unprecedented X-ray sensitivity over a wide area all above issues: (i) the over-density of X-ray sources with respect to the field and their spatial distribution, and (ii) the fraction of (cluster members plus foreground and background sources) X-ray active galaxies, and (iii) the fraction of cluster X-ray active galaxies. We target the Bullet cluster, a massive galaxy cluster at z = 0.296 undergoing a major merger event. The R200 of the main cluster component is ∼2.14 Mpc (Springel & Farrar 2007; Clowe et al. 2004), which is ∼8.07′ at the cluster distance according to a cosmology H0 = 70 km s−1 Mpc−1, ΩM = 0.27, ΩΛ = 0.73. In this cluster the star formation rate (SFR) is higher than in other clusters of similar mass (Chung et al. 2010; Rawle et al. 2010), suggesting more galaxy interactions, or in general more gas-rich galaxies and more efficient SFR triggering mechanisms, than usual. All these peculiar factors may also trigger enhanced AGN activity. To probe nuclear activity down to 1041 erg s−1 we exploit ten precious archival Chandra observations, covering a wide region around the cluster (up to ∼1.6–2× R200), and which have a sensitivity (flux limits ∼1 × 10⁻¹⁶ erg cm−2 s−1 and 8 × 10⁻¹⁶ erg cm−2 s−1 in the 0.5–2 keV and 2–10 keV bands, respectively) hardly ever reached in other clusters. Chandra archival data of the Bullet cluster have been used in previous publications, but never in their entirety or full sensitivity. Gilmour et al. (2009) use only the first two Chandra observations for a total exposure time of ∼100 ks, that is, about one-sixth of the total currently available. Ehlert et al. (2013, 2014, 2015) restrict their analyses to the central 6′ radius region, corresponding to projected distances from the centre < 0.75× R200, and to fluxes greater than 3 × 10⁻¹⁵ erg cm−2 s−1 and 1.5 × 10⁻¹⁴ erg cm−2 s−1 in the 0.5–2 keV and 2–10 keV bands, respectively.
The paper is organised as follows. In Sect. 2, we describe the data used in this work, which are from X-ray (Chandra), optical (ESO 2.2 m WFI), infrared (Spitzer IRAC archive; Fazio et al. 2004), and spectra from VIMOS. In Sect. 3 we present the X-ray catalogue. In Sect. 4 we show the X-ray number counts and the source over-density. In Sect. 5 we combine the Chandra data with archival optical and near-infrared photometry. The archival spectroscopy, as well as new optical spectroscopy obtained with VLT VIMOS, are discussed in Sect. 6. Finally the results and conclusions are discussed in Sect. 7.
2. Data
2.1. Chandra observations
We analysed ten archival Chandra observations of the Bullet field, performed from October 2000 to August 2004 with the ACIS–I camera, for a total exposure time of ∼584.2 ksec (observation identification numbers: 554, 3184, 4984, 4985, 4986, 5355, 5356, 5357, 5358, 5361). We reprocessed all the observations using the chandra_repro script included in the Chandra Interactive Analysis Observations (CIAO) software (v4.5; Fruscione et al. 2006). For the observations taken in very faint (VF) data mode, we applied the appropriate ACIS particle background cleaning as suggested in the Chandra analysis guide, thereby enabling VF data mode background processing in the chandra_repro script. For each observation, we produced calibrated, cleaned, and energy filtered events files and exposure maps.
Before generating the mosaic used for sources detection we brought each observation to the same astrometric system. To this aim, we first produced a sample of X-ray bright sources, following the procedure described in Sect. 3.1 and using a probability threshold of 3 × 10⁻⁷. Then, we identified the optical Rc band (see Sect. 2.2) counterparts of the X-ray bright sources by matching the X-ray and Rc positions within a maximum distance of 2″. We excluded sources that are not point-like and/or with Rc magnitudes outside the range 16.5–22.5. Using this restricted magnitude range only minimises systematic effects introduced by bright stars (saturation) and faint background objects (misidentification). Finally we evaluated the right ascension and declination astrometric corrections as the median of the differences between the X-ray position and optical position values. The right ascension and declination astrometric corrections were all smaller than 1″. The astrometric corrected event files were finally used to generate the mosaics of the event files (see Fig. 1) and exposure maps via the merge_obs CIAO tool.
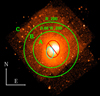 |
Fig. 1. Mosaic of the 10 Chandra observations (see Sect. 2.1) of the Bullet cluster field in the 0.5–7 keV energy range. The green circles are centred on the main cluster and have radii of ∼5.3′ and ∼8.07′, corresponding to 0.66 and 1 × R200. The observations cover up to ∼2 × R200 (i.e. ∼1.5× virial radii). The red elliptical region denotes the area with the strongest ICM (i.e. intracluster medium) emission at distance less than < 0.3 × R200 (i.e. ∼0.2 × virial radii), which has been excluded from our analysis. The cyan dashed elliptical region is centred in the peak of the dark matter distribution, which is significantly shifted eastward from the peak of the X-ray emission (Clowe et al. 2004, 2006). |
2.2. Wide Field Imager data
Optical imaging in the Rc (BB#RC/162_ESO844) and B (BB#B/123_ESO878) bands were obtained in February and March 2003 with the WFI on the ESO MPG 2.2 m telescope at La Silla, Chile. The detector is a 4 × 2 mosaic with 2k × 4k CCDs and has a pixel scale of 0.238″ and a large field of view (34′×33′). The data were collected in service mode and split into six individual exposures of 700 s in the Rc band and 500 s in the B band, following a dither pattern to cover the gaps between the CCD chips.
We reduced each image separately using the standard bias subtraction and flat fielding with dome flats procedures and aligned each image to a common coordinates system using the USNO catalogue (Monet et al. 2003). We then stacked the astrometric corrected images using SWarp (Bertin et al. 2002) to produce one mosaic in each band. The total exposure time for each mosaic is 4200 s in the Rc band and 3000 s in the B band. The photometric zero points (i.e. zp), which were determined using Landolt standard star fields obtained during the same night, are 24 mag and 24.55 mag in the Rc and B band, respectively.
We produced photometric catalogues on each band using SExtractor (Bertin & Arnouts 1996). We used aperture photometry with a diameter of 2 × FWHM (i.e. full width at half maximum) in each band, and corrected this value for flux losses due to aperture size. The correction was calculated by adding the average value of (⟨magAUTO − magAPER⟩)stellar for bright stellar sources to the total magnitude of each source. The 10σ magnitude limit of our imaging data is 23.51 mag and 23.98 mag for the Rc and B band, respectively. For the X-ray sources that do not have a detected optical counterpart we calculated upper limits of their Rc and B band magnitudes. To this aim we generated simulated optical images with artificial sources at the positions of these X-ray sources and ran SExtractor in dual mode, using the simulated image for detection and the real image to calculate the aperture magnitudes at the same positions. In positions in which the fluxes in the aperture are lower than the error, the magnitudes are calculated using the error value as input flux in the equation mag = −2.5× log(flux)+zp.
2.3. IRAC data
We retrieved Spitzer IRAC images of the Bullet field from the IRSA (Infrared Science Archive) archive. Images in the four IRAC bands (ch1 = 3.6 μm, ch3 = 5.8 μm, ch2 = 4.5 μm and ch4 = 8.0 μm) were obtained on 2007 November 14 (PI: Gonzales, Programme ID: 40593) with a cycling, small-scale dither pattern and a full array read-out mode. We used the reduced and astrometrically calibrated BCD mosaics along with their respective uncertainty and covariance maps available on the IRAC database. The total area covered by the images in all four channels is 15′×15′ and the mosaics have a pixel scale of 0.61″ (see Fig. 2).
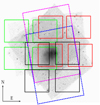 |
Fig. 2. Grey scale image of the mosaic of the ten Chandra observations of the Bullet cluster field in the 0.5–7 keV energy range (see Fig. 1). The green, red, and black squares indicate three VIMOS fields. The magenta and blue dashed boxes indicate the portion of the field covered by IRAC ch1–ch3 and IRAC ch2–ch4 photometry, respectively. |
We produced photometric catalogues in each channel using SExtractor (Bertin & Arnouts 1996). We used a detection threshold of 3σ and a minimum detection area of six pixels (ch1 and ch2) or nine pixels (ch3 and ch4). For each channel we used the Vega zero points found in the IRAC manual, which are 18.8 mag (ch1), 18.32 mag (ch2), 17.83 mag (ch3), and 17.20 mag (ch4) and correction apertures of 0.127 mag, 0.130 mag, 0.145 mag, and 0.126 mag, respectively, based on the manual values. The 5σ depth was found to be 16.9 mag, 16.4 mag, 15.6 mag, and 15.0 mag in ch1, ch2, ch3, and ch4, respectively.
2.4. VIMOS data
Multi-object spectroscopic observations was performed in February and March 2013 (PI: Bongiorno, Programme ID: 090.A−0267) using VIMOS mounted at the 8.2 m Very Large Telescope (Cerro Paranal, Chile). Optical spectra were obtained using the medium resolution grism and the filter GG475, which covers the spectral range from 5000 Å to 8000 Å and has a resolution R = 580.
The central area of the Bullet cluster was covered with three overlapping VIMOS masks as shown in Fig. 2, targeting 253 sources brighter than 24 mag in the Rc band. Of these, 145 were extracted from the Chandra catalogue (see Sect. 3.2), 83 from the IRAC catalogue (see Sect. 2.3), and 25 from the WFI catalogue (see Sect. 2.2). The spectra are the result of exposures of about 1800 s each. A 1 h net exposure time was requested in service mode for each mask. However, for masks 2 and 3, observations were repeated more than once to meet the requested observational conditions. Combining all the good quality data, the final net exposure times obtained are one hour for mask 1, three hours for mask 2, and two hours for mask 3.
Data reduction was performed using the ESO ESOREX pipeline. Spectra were then flux calibrated using standard stars observed during the same nights at comparable airmass and 1D spectra were extracted from the 2D images of the masks using the IRAF task apall. The 1D spectrum were extracted for 218 out of the full sample of 253 sources for which a slit was placed in the masks. Finally, redshifts were measured using the IRAF task rvidlines. Following Le Fèvre et al. (2013) we also assigned to each redshift a quality flag, ranging from 1 for very insecure redshifts to 4 corresponding to secure redshifts, and 0 (24 sources) corresponded to no redshift assigned.
3. X-ray point sources
3.1. Source detection and characterisation
The ten Chandra pointings are strongly overlapping but not all coaxial to ensure a deep and uniform sensitivity along the full cluster. Each position in the mosaic was observed with up to seven different point spread functions (PSFs), requiring the development of a specific procedure to detect and characterise serendipitous sources. To detect sources we used the pwdetect code (Damiani et al. 1997), which was originally developed for the analysis of ROSAT data and was then adapted for the analysis of Chandra and XMM–Newton data. This method is particularly well suited for cases in which the PSF varies across the image, as for Chandra images, since pwdetect is based on the wavelet transform of the X-ray image; i.e. a convolution of the image with a “generating wavelet” kernel, which depends on position and length scale, that is a free parameter. For the Chandra data, the length scale is varied from 0.35″ to 16″ in steps of  .
.
The preliminary step was to run pwdetect on the Chandra mosaic to produce a first source position list, using a non-conservative probability threshold corresponding to hundreds of spurious sources. The final X-ray catalogue is generated by screening this list according to the following procedure.
For each source candidate we determined the counts extraction radius Rbest that provides the best signal-to-noise ratio (S/N) on the mosaic event file. We used circular regions centred on the pwdetect position, starting from a radius of 1″ and increasing the radius in steps of 0.25″ up to 16″. We then extracted source counts Ti at the position of the source candidate on each individual Chandra field i using circular regions with radius Rbest. The background counts Bsi were evaluated at the position of each source candidate from the background maps computed by pwdetect (see Damiani et al. 1997) using single event files. Afterwards, we calculated the net source counts using Ti and Bsi (i.e. Ci = Ti − Bsi) and then the Ci were corrected for the encircled count fraction of the PSF (fPSF) at the off-axis angle θi (the distance of the source position from the aim point of each Chandra pointing), as calibrated by the CXC3: Ccori = Ci/fPSF.
The multiple field aperture photometry values, evaluated as described above, were combined to produce a single set of values as in the following:
-
Total source counts
 ;
; -
Total background counts
 ;
; -
Total net PSF corrected source counts
 ;
; -
Source count rate
 , where Expoi are the vignetting corrected exposure times from the exposure maps of each single observation.
Each candidate source is then assigned a Poisson probability of being background fluctuations, according to the formula
 (1)
(1)
Finally, the pwdetect source list is cut at a threshold of PPoisson = 2 × 10⁻⁵, which allowed us to have a reliable catalogue (see e.g. C–COSMOS survey; Elvis et al. 2009; Puccetti et al. 2009). The final list was also visually inspected to identify obviously spurious detections (e.g. on the wings of the Chandra PSF around bright sources). As additional test, we applied this very same procedure to the C–COSMOS data, finding results consistent with the official catalogue (Elvis et al. 2009).
3.2. X-ray catalogues
We produced X-ray source catalogues in three energy bands: 0.5–2 keV (soft band, S), 2–7 keV (hard band, H), and 4–7 keV (very hard band HH). Exposure maps were computed at energies of 1.17, 2.6, and 4.5 keV, respectively, which correspond to the energy mean values over the energy S, H, and HH energy ranges, weighted with the spectral model used to convert count rates in fluxes (see below).
We performed the source detection in the whole Chandra field, but we excluded from our analysis the central region of the Bullet cluster, where the ICM (i.e. intracluster medium) emission is strongest and makes it difficult, if not impossible, to detect point-like sources. The excluded region, denoted by the red ellipse in Fig. 1, includes the cluster core (≲1′), and corresponds to an ICM background level ≳6 × 10⁻⁷ct s−1 arcs−2, ≳5 × 10⁻⁷ct s−1 arcs−2 and ≳2.5 × 10⁻⁷ct s−1 arcs−2 for the S, H, and HH band, respectively.
The count rates (CR) were converted to fluxes (Fx) using the formula Fx = CR/(CF × 1011), where CF is the energy conversion factor, that is evaluated by PIMMS4 using an absorbed power-law spectrum with Γ = 1.45 and Galactic column density towards the position of the Bullet cluster NH = 4.9 × 1020 cm−2, and suitable for the observing cycle 5, during which most of the observations are taken (8 out of 10). In order to compare our results with the literature, count rates estimated in the S, H, and HH band were extrapolated to fluxes in the 0.5–2 keV, 2–10 keV, and 5–10 keV bands, respectively. We used CF = 1.82, 0.34, and 0.22 for the S, H, and HH band, respectively.
We detected 317, 254, and 148 point-like sources in the S, H, and HH bands (see Table 1). The three source lists are merged into one catalogue, using a matching radius of 2.5″. The final catalogue is made up by 381 unique sources.
Number of sources detected in each X-ray band.
4. X-ray number counts and excess density
4.1. Survey sensitivity
As mentioned in the previous sections, the ten Chandra pointings are mostly overlapping but not coaxial; then at each sky position we have a mixture of different PSFs and vignetting factors, a situation similar to the C–COSMOS case (Elvis et al. 2009; Puccetti et al. 2009). For this reason we computed sensitivity maps and sky coverages (the total area in the sensitivity maps covered down to a given flux limit) in the S, H, and HH band, following the analytical method presented in Puccetti et al. (2009).
We evaluated the sky coverages in the three energy bands S, H, and HH for the whole Chandra field around the Bullet cluster and also for the three regions A, B, and C in Fig. 1 at increased distance from the cluster centre. The three regions A, B, and C are defined as follows:
– A is the circular region centred on the main cluster with radius = 0.66 × R200, excluding the area with the strongest ICM emission at R < 0.3 × R200 (red elliptical region in Fig. 1).
– B is the annular region centred on the main cluster with inner radius R = 0.66 × R200 and outer radius R = R200.
– C is the area outside the regions A and (R200 < R ≤ 2 × R200).
Figure 3 shows the sky coverages in the S, H, and HH bands for the whole Chandra Bullet field and the three regions A, B, and C.
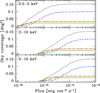 |
Fig. 3. From top to bottom: sky coverage calculated as in Sect. 4.1 in the S, H, and HH energy bands, excluding the area with the strongest ICM emission (black dotted lines, see also Fig. 1) and the A (green solid lines), B (red long dashed lines), and C (blue short dashed lines) regions (see Fig. 1 and Sect. 4.1). |
4.2. X-ray number counts and excess density in the Chandra field
The sky coverages are used to evaluate the integral X-ray number counts using the following equation:
 (2)
(2)
where NS is the total number of detected sources with fluxes larger than S, and Ωi is the sky coverage at the flux of the i–th source.
Figure 4 (top panels) compares the X-ray number counts in the three regions A, B, and C to those in field surveys. The X-ray number counts in all studied X-ray bands S, H, and HH are systematically higher than those from field surveys. We estimated the excess density and uncertainties as follows:
 (3)
(3)
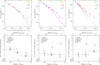 |
Fig. 4. Top panels: X-ray number counts of the X-ray point sources in the Bullet cluster regions A (green solid circles), B (red open circles), and C (blue solid triangles). Left panel: 0.5–2 keV, magenta solid line represents field number counts from Moretti et al. (2003). Central panel: 2–10 keV, magenta solid line indicates field number counts from Moretti et al. (2003). Right panel: 5–10 keV, magenta dash-dotted line shows HELLAS2XMM 5–10 keV number counts from Baldi et al. (2002); magenta open circles indicate CDF-S 5–10 keV number counts from Luo et al. (2008). The black dotted vertical lines identify the three flux ranges: faint, medium, and bright. Bottom panels: excess densities with respect to field number counts as functions of the distance from the cluster centre in the three energy bands 0.5–2 keV (left panel), 2–10 keV (central panel), and 5–10 keV (right panel). Faint flux sources are shown by small open circles; medium flux sources are indicated by medium open circles; bright flux sources are shown by large open circles; all sources are represented by stars. The excess densities could include some contribution from cosmic variance (< 1.25, < 1.20, and < 1.10 in the A, B, and C regions, respectively; see Sect. 4.3). |
where Nobs are the observed number of sources and Nexp are the number of the expected sources evaluated from the compilation of Moretti et al. (2003) for the S and H bands, and from the Luo et al. (2008) and Baldi et al. (2002) determinations for the HH band. The upper (+Δ Excess) and lower (−Δ Excess) uncertainties are evaluated using the formulae of Gehrels (1986) for Poisson statistics for the number of sources (i.e.  ,
,  ).
).
The excess densities for the whole Chandra Bullet field and for the three regions A, B, and C are reported in Table 2.
Excess density.
We estimate excess densities with respect to field number counts of a factor 1.5–2 at ∼6σ in the S band and ∼4σ in the H and HH bands (see Table 2). The analysis of the excess density in flux bins highlights different behaviours of the soft and hard sources. At the faintest fluxes, we find significant excess density in all the three energy bands. At medium and high fluxes, the excess density is significant in the H and HH bands only.
Figure 4 (bottom panels) shows the excess densities with respect to field number counts in three energy bands as functions of R200. The excess density of the soft sources in the full flux range (stars) decreases with the distance from the cluster centre, while the excess density of the hard sources stays about constant and the excess density of the very hard sources increases with the distance from the cluster centre.
The excess densities are also evaluated in three flux ranges: faint, medium, and bright; these ranges are identified in Table 2 and by the black dotted lines in the top panels of Fig. 4. Faint sources are only detected up to a distance of ∼R200 (regions A and B) and show an excess density up to a factor ∼2. Medium and bright sources are detected in all three regions. The excess densities of the soft/medium flux sources decrease with the distance from the cluster centre. The excess densities of the hard/medium flux sources show similar behaviour, but this is consistent with no excess at distances > R200. On the contrary, the excess densities of the hard/bright sources and the medium and bright/very hard sources is up to a factor of ∼3–4 at distances from the centre of the cluster > R200. In general, bright X-ray point sources are missing near to the cluster centre and show an excess density at distance > R200, in particular in the H and HH energy bands. The X-ray catalogue contains 23 sources brighter than 3 × 10⁻¹⁴ erg cm−2 s−1 in the 2–10 keV band, which are located at distance from the main cluster greater than ∼6.1′, and 19 out of 23 are located at distance greater than ∼8.5′ (i.e. greater than R200).
4.3. Possible cosmic variance
Systematic uncertainty from cosmic variance can be significant, especially for surveys covering small areas. For example, Cappelluti et al. (2005) find a cosmic variance of X-ray sources of approximately 15–25% on scales similar to our region A. To better evaluate how the X-ray cosmic variance (σx) can affect our analysis, we estimated the excess density in the Chandra-COSMOS and CDF-S fields in regions of sizes similar to those of regions A, B, and C defined in the Bullet cluster field, and in the three flux bins adopted in Table 2. For each region we evaluated the excess density of X-ray sources using exactly the same procedure followed for the Bullet cluster field. We repeated the exercise at ten not overlapping, different positions in the Chandra-COSMOS and CDF-S fields. We find that the excess density in these regions is always < 1.25 for regions of the size of region A, < 1.20 for regions of the size of region B, and < 1.10 for regions of the size of region C. We conclude that cosmic variance is not likely the cause of the large excess densities found in the Bullet cluster field.
4.4. X-ray properties
We calculated the hardness ratio (H−S)/(H+S) of the hard X-ray sources in the regions A, B, and C as a function of the flux. The hardness ratio distribution of the sources in the whole Bullet cluster field is consistent with that of the C–COSMOS sources (using the Kolmogorov–Smirnov test).
We investigated in more detail the hardness ratio distribution in the A, B, and C regions, by selecting only X-ray sources with 2–10 keV flux > 2 × 10⁻¹⁵ erg cm−2 s−1, for which the average statistical error on (H−S)/(H+S) is 0.2 ± 0.1. In each region we evaluated the fraction of the hard sources Nhard, defined as the fraction of source with (H − S)/(H + S) > 0.5 to the total. This hardness ratio corresponds to a column density NH > 5 × 1021 cm−2, using an absorbed power-law model with photon index 1.9. We find that the fraction of hard sources Nhard is different in the three regions, i.e. 73 ± 2%, 60 ± 2% and 68 ± 2% in the A, B, and C regions, respectively; this suggests less obscured X-ray sources in region B than in regions A and C.
We also analysed the Chandra spectra of bright individual sources. We find that a source with extreme hardness ratios, i.e. (H−S)/(H+S) = 0.93, (HH−H)/(HH+H) = 0.15, has a spectrum dominated by a strong emission line, corresponding to the FeKα transition at a redshift consistent with that of the Bullet cluster. The Chandra spectrum is well fitted with a pure reflection component (XSPEC PEXRAV model (Magdziarz & Zdziarski 1995) plus an emission line (XSPEC ZGAUSS model) with equivalent width ∼2 keV (see Fig. 5 and Table 3), making the source a good candidate to be a Compton thick (CT) AGN (e.g. Puccetti et al. 2014). The source lies in region A, at distance ∼5′ from the cluster centre.
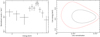 |
Fig. 5. Left panel: Chandra spectrum of source #13 (see Table A.1) grouped to have at least 10 counts per energy bin. Right panel: 68% and 90% confidence contours of the FeKα line energy at redshift ∼0.3 as a function of the line normalisation. |
Best-fitting parameters of the candidate CT source.
5. Multi-wavelength properties
5.1. Optical-infrared counterparts of the X-ray sources
We identified the counterparts of the 381 X-ray sources in the optical and infrared bands using the Rc-band, B-band, and near-infrared IRAC catalogues presented in Sects. 2.2 and 2.3. We searched for counterparts by matching the X-ray and optical and infrared positions within a maximum radius of 3″, which is well suited for Chandra mosaics as demonstrated for the Chandra-COSMOS survey (Civano et al. 2012).
We first matched the X-ray and optical catalogues. We excluded 24 sources after visual inspection, mostly lying in background/saturated regions in the optical images. We identified the Rc–band counterparts for a total of 320 X-ray sources (see Fig. 6). Of the identified sources, 258/320 (302/320) lie within 1″ (2″) from the X-ray centroids. Two X-ray sources are associated with optical galaxies even if they are off–nuclear. In an additional nine cases, the association between the X-ray and optical source is considered tentative because the relative distance is greater than 2″. Figure 6 shows the distribution of the distance between the X-ray sources and their optical counterparts. This distribution is consistent with the analogous distribution produced for the Chandra-COSMOS multi-wavelength catalogue (Civano et al. 2012). For the X-ray sources without an optical counterpart, we calculated the magnitude upper limits as described in Sect. 2.2.
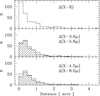 |
Fig. 6. Top panel: histogram of the distances between the X-ray sources and their optical counterparts. Middle panel: histogram of the distances between the X-ray sources and their counterparts in IRAC ch1 (empty histogram), and IRAC ch2 (dashed histogram). Bottom panel: histogram of the distances between the X-ray sources and their counterparts in IRAC ch3 (empty histogram), and IRAC ch4 (dashed histogram). |
We cross-correlated the catalogue of the optical counterparts or the catalogue of the X-ray sources when optical counterparts were not available with the IRAC catalogues presented in Sect. 2.3. We identified 264, 251, 237, and 206, 3.6 μm, 4.5 μm, 5.8 μm, and 8.0 μm counterparts, respectively; 181 X-ray sources have counterparts in all four IRAC channel. Figure 6 shows the distribution of the distance between the X-ray sources and their near-infrared counterparts.
5.2. Infrared properties
Figure 7 shows a IRAC colour–colour diagram for the sources in the regions A, B, and C of the Bullet cluster field; we note that the IRAC coverage is smaller than the Chandra field (see Fig. 2). Using the selection criterion by Stern et al. (2005) to identify luminous unobscured AGN, the percentage of candidates unobscured AGN in the Bullet field is (40±2)%, which is lower than that in the C–COSMOS field (i.e. ∼48%). There is however a concentration of Bullet cluster sources with IRAC colours close to zero, which is much higher than C–COSMOS sources (16±2% of the Bullet cluster sources versus ∼5% of the C–COSMOS sources). If we exclude these sources we obtain a fraction of luminous unobscured AGN in the Bullet cluster field consistent with the C–COSMOS field. Out of the 24 brightest hard source (2–10 keV flux > 10−14 erg cm−2 s−1) with IRAC counterparts, 22 are selected as luminous unobscured AGN according to the Stern et al. (2005) criteria.
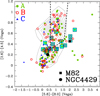 |
Fig. 7. Colour–colour diagram of IRAC sources. Green solid circles indicate sources in region A; red open dots show sources in region B; and blue solid triangles represent sources in region C. The cyan full squares denote sources at the Bullet’s redshift (see Sect. 6). The black contour levels represent C–COSMOS sources. The black solid square and diamond represent two galaxy templates, M 82 and NGC 4429, respectively, which were moved at the redshift of the Bullet. The black dashed line indicates the empirically determined region, largely populated by luminous unobscured AGN (Stern et al. 2005). |
We tried to quantify the fraction of high and low star-formation galaxies in the Bullet cluster IRAC field using the colour–colour locus at the Bullet’s redshift of two non-evolving galaxy templates from Devriendt et al. (1999): M 82 a starburst galaxy with [5.8]−[8.0] = 2 and [3.6]−[4.5] = 0.45, and NGC 4429, an S0/Sa galaxy with a star formation about 4000 times lower (with [5.8]−[8.0] = 0.4 and [3.6]−[4.5] = 0.2). We classified the sources according to the following criteria:
-
High SFR galaxies, HSFRG:
![Mathematical equation: $$ \begin{aligned} 1.5 < [5.8]-[8.0]< 2.2~ \& ~ 0.35 < [3.6]-[4.5] < 0.55; \end{aligned} $$](/articles/aa/full_html/2020/02/aa33601-18/aa33601-18-eq69.gif) (4)
(4) -
Low SFR galaxies, LSFRG:
![Mathematical equation: $$ \begin{aligned} 0.2 < [5.8]-[8.0]< 0.6~ \& ~ 0.1 < [3.6]-[4.5] < 0.3. \end{aligned} $$](/articles/aa/full_html/2020/02/aa33601-18/aa33601-18-eq70.gif) (5)
(5)
We divided the area, covered by the four IRAC channels, in four radial bins, from zero to R200. For each bin we evaluated the ratio of the number of HSFRG and LSFRG to the total (see Fig. 8). We also calculated similar ratios for Chandra sources with IRAC counterparts. We find that the fraction of IRAC LSFRG is dominant near to the cluster centre and decreases at increasing radii. Conversely, the fraction of HSFRG is constant with the radius and remains at all radii smaller than the fraction of LSFRG. We find similar behaviour for Chandra sources with IRAC counterparts, although with poorer statistics.
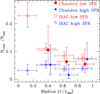 |
Fig. 8. Ratio of the number of IRAC and Chandra LSFRG and HSFRG to the total samples as functions of the distance from the cluster centre. Red solid dots show Chandra LSFRG; blue solid triangles represent Chandra HSFR; red open dots show IRAC LSFRG; blue open triangles indicate IRAC HSFRG. |
5.3. Fraction of X-ray active galaxies (cluster members plus foreground and background sources)
Clusters are over-dense regions of the Universe, and therefore it is not surprising to find an excess of X-ray sources with respect to the field. A different question is how the fraction of active galaxies in the Bullet cluster field compares with the fraction of active galaxies in other cluster fields and in random fields, not targeting dense region of the Universe. To start investigating these issues we first evaluated the fraction of optical galaxies (cluster members plus foreground and background galaxies) hosting an X-ray source, and then compared this value to those of active galaxies in other cluster fields Ehlert et al. (2014) and in the COSMOS–Legacy field (Civano et al. 2016). Following Ehlert et al. (2014) we selected X-ray sources with 0.5–8 keV flux larger than 1 × 10⁻¹⁴ erg cm−2 s−1 (X-ray bright galaxies) and galaxies with aperture magnitude R in the range 18.8–23 mag (see Sects. 2.2 and 5.1). We used R aperture magnitudes with 3″ diameter, coherently with the magnitudes in the Legacy–COSMOS catalogue and in Ehlert et al. (2013) work. We also excluded stars from the analysis using the SEXTRACTOR CLASS_STAR parameter larger than 0.98 and B − R colour larger than 2. For the COSMOS–Legacy field we marked and excluded stars using the flag in the Ilbert et al. (2009) and Marchesi et al. (2016) catalogues.
The fraction of galaxies hosting an X-ray source is then given by
 (6)
(6)
where NXR is the number of galaxies hosting an X-ray source and NR is the total number of R band selected galaxies. The fraction of X-ray bright galaxies is plotted in Fig. 9 (left panel). The upper (+Δ Fraction) and lower (−Δ Fraction) uncertainties are evaluated using the Gehrels (1986) formulae for Poisson statistics for NXR and NR.
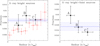 |
Fig. 9. Fraction of X-ray bright galaxies as a function of the distance from the cluster centre in units of R200. Left panel: black solid squares represent Bullet cluster X-ray sources with 0.5–8 keV flux > 1 × 10⁻¹⁴ erg cm−2 s−1 and red open squares indicate the sample of 42 cluster by Ehlert et al. (2014). The average field AGN fraction in the COSMOS–Legacy survey is denoted by a blue solid line; 1σ uncertainties are identified by the dashed region. Right panel: Black squares represent Bullet cluster sources with 0.5–2 keV flux ≥3 × 10⁻¹⁶ erg cm−2 s−1. The average field AGN fraction in the CDF-S 4 Msec survey is denoted by a blue solid line; 1σ uncertainties are identified by the dashed region. |
The average fraction of X-ray bright galaxies in the Bullet field is 0.0070 , which is consistent with the value of 0.0068±0.0005, evaluated for the COSMOS-Legacy field (see left panel of Fig. 9). The fraction in the three spatial regions A, B, and C is also consistent within the error with the COSMOS-Legacy value. Considering the punctual values, these fractions are somewhat higher than those of the Ehlert et al. (2014). However, the rather large uncertainties prevent us from drawing any strong conclusion.
We also evaluated the fraction of galaxies hosting X-ray sources at X-ray fluxes lower than 1 × 10⁻¹⁴ erg cm−2 s−1. At these fluxes the survey incompleteness cannot be neglected, and therefore the number of X-ray sources has been corrected for the sky coverage in Fig. 3. We then evaluated the fraction of galaxies hosting X-ray sources at S flux ≥3 × 10⁻¹⁶ erg cm−2 s−1 and R in the range 18.–24.5 mag to avoid optical incompleteness. As a comparison sample, in this case we used the CDF-S 4 Msec survey (Xue et al. 2011; Lehmer et al. 2012), which is more suitable for a comparison with the Bullet cluster field at the above deep flux limit. The fraction of galaxies hosting X-ray sources in the three Bullet cluster regions B and C is consistent with the average field X-ray sources fraction in the CDF-S within the uncertainties (see right panel of Fig. 9). In region A we find a fraction of X-ray galaxies (clusters members plus foreground and background galaxies) higher than in the CDF-S field, although the difference is only a ∼1σ (see right panel of Fig. 9).
6. Analysis of the source populations based on their redshifts
6.1. VIMOS spectroscopic redshifts
Spectroscopic redshifts have been measured on VIMOS spectra of 194 sources, 106 of which are X-ray selected sources, 69 are near-infrared selected sources, and 19 are optically selected sources. Given the velocity dispersion of the main cluster components (i.e. 1400 km s−1; Bradač et al. 2006), we estimate the 3σ redshift extension of the cluster to be z ± Δz = 0.296 ± 0.014. We find that 49 out of the 194 VIMOS sources have redshifts consistent with this range (see Fig. 10). Table A.1 includes the redshifts of these 49 cluster members derived from the VIMOS spectra, which are also shown in Fig. B.1. Table C.1 lists the redshifts of the remaining 145 non-cluster member point-like sources in the Bullet field.
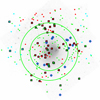 |
Fig. 10. Image mosaic of the 10 Chandra observations of the Bullet field in the 0.5–7 keV energy range (see Fig. 1). The green circles are centred on the main cluster and have increasing radii of 0.66 × R200 and R200 (see Fig. 1). The points of different colours correspond to sources selected from different catalogues with a measured VIMOS redshift: green circles indicate Chandra sources; cyan circles represent WFI sources; and red circles show IRAC sources. The black squares identify the sources with redshifts z ± Δz = (0.296 ± 0.014), corresponding to that of the Bullet cluster. The blue diamonds identify Chandra sources with redshifts, taken from the literature, in the interval z ± Δz = (0.296 ± 0.014). |
6.2. Redshifts: Total sample
We added to our VIMOS sample 1201 redshifts from the literature, of which 231 are spectroscopic and 970 photometric (Foex et al. 2017; Chung et al. 2010; Barrena et al. 2002; Guzzo et al. 2009; Rex et al. 2010; Rawle et al. 2012; Bradač et al. 2009; Jones et al. 2009; Zhang et al. 2016; Souchay et al. 2015; Liang et al. 2000; Johansson et al. 2010; Sereno 2015; Stott et al. 2011). We thus consider a total of 1395 sources with spectroscopic or photometric redshift. Of the 1395 sources, 127 are X-ray selected sources, for which we collected 119 spectroscopic redshifts and 8 photometric redshifts. Figure 11 shows the redshift distribution of the entire redshift sample and of the X-ray sources. The redshift distribution shows a statistically significant peak at the Bullet cluster’s redshift. Twenty-nine X-ray sources have redshifts consistent with that of the Bullet cluster and 25 out of the 29 sources have spectroscopic redshifts.
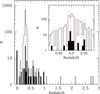 |
Fig. 11. Redshift distribution of the entire analysed sample (open histogram) and X-ray sources (filled histogram). The red dashed line denotes the Bullet cluster’s redshift, the blue dashed line indicates the redshift of a background cluster (Rawle et al. 2010). Inset panel: zoom of the redshift range corresponding to the Bullet cluster, i.e. z ± Δz = (0.296 ± 0.014). |
In the Bullet cluster field there is a background cluster discovered by Herschel at z ± Δz = 0.350 ± 0.007 (Rawle et al. 2010). The full source sample redshift distribution has a statistically significant peak at z ∼ 0.35, while no statistically significant excess at z ∼ 0.35 is seen in the X-ray selected sources.
6.3. Bullet cluster galaxies with X-ray emission
Our sample includes 29 X-ray sources at the Bullet cluster redshift. Fourteen redshifts have been determined from our VIMOS spectra; 15 are from the literature and the redshifts are evaluated through photometric techniques in only 4 cases (see Table A.1). Optical spectra are used to provide a first rough classification based on the presence of emission lines (emission line galaxies; ELGs), or absorption lines (absorption line galaxies; ALGs).
We evaluated X-ray luminosities (2–10 keV) from H-band count rates, assuming a power-law spectrum with Γ = 1.9, reduced at low energies by photoelectric absorption. We consider both Galactic absorption along the line of sight and absorption at the redshift of the source. The luminosities include the k correction. The rest-frame column density NH is estimated using the hardness ratio (H−S)/(H+S) and the same model spectrum. This column density is likely a lower limit to the true value. Non-uniform absorbers or ionised absorbers of a given column density NH may allow significant leaking of low energy photons, producing hardness ratios much smaller than that corresponding to a uniform, cold gas cloud of the same column density NH. Furthermore, low energy photons may also be produced by scattering or reflection, as often observed in CT sources, where a power-law component with normalisation 0.01–0.1 that of the direct power-law often emerges (Comastri et al. 2007; Ueda et al. 2007; Kawamuro et al. 2016; Marchesi et al. 2017; Tanimoto et al. 2018). These limitations of the hardness redshift analysis are clearly highlighted by the case of source #13, which is the candidate CT AGN discussed in Sect. 4.4. We note that the optical spectroscopy redshift is fully consistent with that evaluated from the X-ray spectrum. The iron line equivalent width suggests a column density > 1024 cm−2, that is, about ten times higher than the limit estimated from the hardness ratio analysis. In summary, the luminosities reported in Table A.1 may under-estimate the intrinsic luminosities, if the real spectra of the sources are more complex than our simplistic assumption.
Keeping in mind the caveats briefly mentioned above, we assess the AGN nature of a source based on its X-ray luminosity and hardness ratio. We classify the seven objects with L2 − 10 keV ≳ 1042 erg s−1 as bona fide AGN because the X-ray luminosity produced by star formation, estimated from the narrow Hα luminosity (Kennicutt et al. 1994) and using the Lehmer et al. (2016) or Ranalli et al. (2003) SFR – X-ray luminosity correlations to convert the SFR into an X-ray luminosity, is always much smaller than the above threshold. We note that six of the seven sources have optical spectra classified as ELG, while for the seventh we do not have information on the optical spectrum. Emission line optical spectra were also classified using diagnostic diagrams (BPT; Baldwin et al. 1981; Veilleux & Osterbrock 1987). We find that four out of the five X-ray sources classified as AGN by their X-ray emission using diagnostic diagrams (see Fig. 12) are recognised as AGN.
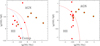 |
Fig. 12. Left panel: [OIII]/Hβ vs. [NII]/Hα diagnostic diagram for the Bullet’s sources. The Kewley et al. (2001) extreme starburst line and the Kauffmann et al. (2003) classification line are shown as red solid and blue dashed lines, respectively. The green open dots denote the X-ray sources at the Bullet redshift classified as AGN according to their 2–10 keV luminosity. Right panel: [OIII]/Hβ vs. [SII]/Hα diagnostic diagram. Symbols are represented as in left panel. |
We classify as candidate AGN the six objects with 41.44 ≤ log(L2 − 10 keV)≤41.84 and (S−H)/(S+H) ≥ 0.5 because the high hardness ratio suggests significant obscuration, and, as explained above, the NH evaluated from a single hardness ratio may under-estimate the real NH. Also in these six cases the X-ray luminosity produced by star formation is smaller than the observed X-ray luminosity; we note that two of the six sources have optical spectra classified as ALG and for the remaining four we do not have information on the optical spectrum.
Finally, we classify as normal galaxies the remaining 16 objects with 40.95 ≤ log(L2 − 10 keV)≤41.64. Out of these 16 sources, 14 are not detected in the H band and therefore, only have an upper limits on their hardness ratio. Stacking together the counts of the 14 sources produces a significant detection in the H band (more than 3σ) and the resulting stacked hardness ratio is ∼–0.12, suggesting very little or no absorption and a steep spectrum. In these sources an active nucleus is either not present or is accreting at very low regimes (e.g. low luminosity AGN, hereinafter LLAGN). The remaining two low luminosity sources detected in the H band have hardness ratios = 0.25–0.37, consistent with that of an unobscured AGN spectrum. Nevertheless, we conservatively classify these two sources as normal galaxies.
There are three contributions to the integrated X-ray emission from normal galaxies (not hosting an active nucleus): (1) high-mass X-ray binaries (HMXBs), (2) low-mass X-ray binaries (LMXBs), and (3) thermal emission from a hot gas. We quantify the possible contribution to the X-ray luminosity of the 29 Chandra sources from these three components. Mineo et al. (2012) show that HMXBs are good tracers of recent star formation and their 0.5–8 keV luminosities scale linearly with the SFR. We then evaluated the HMXB X-ray luminosities from the ∼24 μm SFR (calculated from Spitzer MIPS and WISE archived data) and find that HMXBs can contribute < 1%, < 5%, < 25% of the observed X-ray luminosity for the seven bona fide AGN, the six candidate AGN, and the 16 normal galaxies, respectively. We evaluated the possible contribution from LMXBs or the hot gaseous coronae using the predicted relations between X-ray and K luminosities from Kim & Fabbiano (2004) and Sun et al. (2007), respectively, using 2MASS archive data. Also in this case the contribution of LMXBs and hot haloes to the seven bona fide AGN and the six candidate result negligible (< 0.5 − 4% and < 5 − 10%, respectively), confirming that the X-ray emission from this sources likely originate from accreting SMBHs. In the normal galaxies the contribution of LMXBs and hot haloes to the X-ray emission could reach ∼30 − 35%.
Table A.1 also reports the VIMOS results for 32 IRAC and 3 WFI selected sources at the Bullet cluster redshift.
In summary, we identify 29 Chandra sources at the redshift of the Bullet cluster: 7 bona fide AGN, 6 candidate AGN, and 16 normal galaxies/LLAGN (6 ELGs, 5 ALGs, and 5 with unknown optical classification).
6.4. Redshift distribution of the sources contributing to the observed over-densities
The 127 X-ray sources with measured redshift are distributed almost uniformly in and around the Bullet cluster: 40 are located in region A, 39 in region B, and 44 in region C. Four are located in the central area with the strongest ICM emission at distance less than < 0.3 × R200 from the cluster centre (red elliptical region in Fig. 1). Of the X-ray sources in region A and B, 28% are at the Bullet cluster redshift, while only 13.6% of the X-ray sources in region C belong to the cluster.
The observed over-density at bright fluxes in region B is totally due to bona fide AGN at the Bullet redshift. The situation in region C is different. Of the brightest H band sources (4 out of 6) in region C, 67% are field AGN; 100% of the S and HH brightest sources in region C are luminous AGN at redshift in the range 0.21–1.54. Therefore in this region the observed over-density at the brightest S and HH fluxes is due to field AGN, whereas the excess at the brightest H fluxes could be only in part due to field AGN. The 16 X-ray emitting normal galaxies/LLAGN contribute to the excess densities observed near the survey flux limits.
We analysed the spatial distribution around the cluster of the bona fide AGN, candidate AGN, X-ray normal/LLAGN, ELG, and ALG galaxies. To this aim, we apply the Kolmogorov-Smirnov test to the distributions of the projected distance of each source from the cluster centre. We find no statistically significant difference between the spatial distribution of two types of AGN and normal galaxies in the region A, B, and C. However, in the core of cluster there are only ALG galaxies, as expected.
We find 308 sources detected in all the four IRAC channels at the Bullet cluster redshift. Using these sources, we recalculated the fraction of high and low star-formation galaxies in the Bullet cluster field as done in Sect. 5.2. We confirm that the fraction of IRAC LSFRG is maximum near to the cluster centre and decreases with the distance from the centre, and that the fraction of HSFRG is roughly constant with the radius and remains smaller than the fraction of LSFRG. The fractions evaluated using only the sources with a redshift consistent with that of the Bullet cluster are higher than that evaluated using the total IRAC sample (see Figs. 8 and 13).
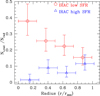 |
Fig. 13. Ratio of the number of IRAC LSFRG and HSFRG to the total samples as functions of the distance from the cluster centre for the 308 cluster members with IRAC fluxes. Red open dots indicate IRAC LSFRG; blue open triangles show IRAC HSFRG. |
6.5. AGN fraction in the Bullet cluster
The availability of a large sample of galaxies with measured redshift and the identification of 13 AGN associated with the cluster (bona fide + candidates) allows us to study the fraction of cluster optical galaxies hosting an X-ray AGN. To this aim, we first selected galaxies with optical magnitude R ≤ 22 mag, a sample including most of the X-ray source counterparts. The fraction of X-ray AGN at the Bullet’s redshift is then given by
 (7)
(7)
where NXRz is the number of galaxies at the cluster redshift hosting an X-ray AGN, which are in regions A, B, and C, most of which have spectroscopic redshifts (see Sect. 6), while NRz is the total number of R-band selected galaxies at the cluster redshift (most of them are photometric, see Sect. 6.2) in the same regions. CompXRz and CompRz are correction factors, which take into account the redshift incompleteness of NXRz and NRz, respectively. The upper (+Δ Fraction) and lower (−Δ Fraction) uncertainties are evaluated using the Gehrels (1986) formulae for Poisson statistics for NXRz and NRz. Figure 14 shows the AGN fraction in the Bullet cluster as a function of the distance from the cluster core. The average fraction of X-ray AGN in the total A+B+C region is 1.0 ± 0.4%.
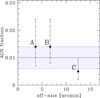 |
Fig. 14. Fraction of cluster members hosting an X-ray AGN vs. the distance from the cluster centre, in units of R200 (black solid circles). The average X-ray AGN fraction in the A+B+C total region is indicated by the blue solid line; 1σ uncertainties are identified by the dashed regions. |
We also estimated the fraction of X-ray AGN at the cluster redshift with L(2–10 keV) ≥1043 erg s−1. This is  and
and  in the total A+B+C region, and within R200, respectively. This difference is due to the lack of luminous X-ray AGN at distances larger than R200.
7. Discussion and conclusions
The analysis of cluster environments is a valuable instrument to investigate the origin of the galaxy nuclear and star formation activity trigger mechanisms. To this aim we performed a detailed analysis of point X-ray sources in the Bullet cluster field. Owing to deep and wide Chandra observations accumulating a total of ∼600 ks, we were able to produce a catalogue of 381 X-ray point sources up to a distance of ∼2 × R200 (1.5 virial radii). We reached a flux limit of ∼1 × 10⁻¹⁶ erg cm−2 s−1 (corresponding to a luminosity of ∼a few 1040 erg s−1 at the cluster redshift), an unprecedented sensitivity in cluster analysis.
Using ESO MPG 2.2 m WFI and Spitzer IRAC images we identified optical and near-infrared counterparts of ∼84% and ∼48% of the X-ray sources, respectively.
We obtained new spectroscopic redshifts for 106 X-ray sources using ESO VLT VIMOS. We collected from the literature additional 21 redshifts of the X-ray sources (8 photometric and 13 spectroscopic). Of the 127 X-ray sources with measured redshifts, 29 are associated with the Bullet cluster in the redshift range 0.28–0.31. Additional 525 infrared selected sources and 113 optical selected sources have a photometric or spectroscopic redshift in the same range, and are thus likely to be associated with the cluster.
7.1. X-ray over-density
Point-like X-ray sources in the Bullet cluster are denser than in the field by a factor 1.5–2 in all S, H, and HH energy bands, as found in most clusters in the past 20 years. The over-densities correspond to ∼100, 70, 50 excess sources in the S, H, and HH bands, respectively, higher than what reported by Gilmour et al. (2009,  ) in the central ∼1 Mpc. Limiting the analysis at the flux limits and area covered by Gilmour et al. (2009) we find an over-density identical to their evaluation, showing that deep and wide observations are truly mandatory to probe the full scale of cluster content of point X-ray sources.
We studied the over-density of X-ray sources as a function of the distance from the cluster core to highlight any radial variation. This is of particular interest in this case because, unlike the majority of clusters of galaxies, in the Bullet cluster the peak of the dark matter distribution is significantly shifted eastward from the peak of the X-ray emission (Clowe et al. 2004, 2006). Magnification of background sources is therefore probably higher outside the cluster core and this may produce an enhancement of X-ray point source detection eastward of the core, where the ICM X-ray emission is fainter than in the core, thus limiting less our ability to detect point sources (both cluster members and background or foreground sources). We studied the three regions A, B, and C, located at increasing distances from the cluster core: A, R ≤ 0.66 × R200; B, 0.66 × R200 < R < R200; and C, R200 < R < 2 × R200 (see Fig. 1). The peak of the dark matter distribution lies in region A, eastward from the core (see Fig. 1), where three X-ray sources are detected. Source #38 in Table A.1 belong to the cluster, nearby source at RA = 104.65632 and Dec= − 55.94062 has a bright point like optical counterpart (R = 16, B = 15.8) and it is likely a star, source at RA = 104.62821 and Dec = −55.96111 in Table C.1 is at z = 0.347; this redshift is consistent with the background cluster discovered by Rawle et al. (2010). The density of X-ray sources in the region corresponding to the peak of the dark matter distribution is similar to that of full region A. This is also the region presenting the highest over-density of faint X-ray sources in both S and H bands. Region C presents the highest over-density of bright H and HH sources. These bright sources are distributed uniformly in region C without significant concentrations.
7.2. What generates the X-ray over-density?
In interpreting number count over-densities we must consider that cosmic variance can produce over-densities, particularly when small regions of the sky are examined. To investigate further this point we evaluated the cosmic variance in regions with dimension and sensitivity similar to those used for the Bullet, based on the C-COSMOS and CDF-S survey data. The values obtained are consistent with those given in the literature, indicating that the cosmic variance cannot exceed ∼25% in regions of the same size as region A, and is ∼10% in zones as large as region C or the whole Chandra Bullet. These results indicate that the over-densities found in the Bullet cluster field can hardly be explained in terms of cosmic variance.
To investigate other scenarios for the over-density of X-ray sources (e.g. cluster AGN, cluster star-forming galaxies, and magnified background sources), we obtained redshifts for ∼33% of the X-ray sources, that is 127 sources comprised of 119 spectroscopic redshifts and 8 photometric redshifts. These sources are uniformly distributed in the three regions A, B, and C (see Fig. 1). The redshift distribution of the X-ray sources shows a statistical significant peak at the Bullet cluster redshift (see Fig. 11) suggesting an excess of X-ray sources belonging to the cluster. We find a similar behaviour in the redshift distributions in each of the regions A, B, and C. Thus, a total of 29 X-ray sources likely belong to the Bullet cluster. We identify seven bona fide AGN, those with L2 − 10 keV ≳ 1042 erg s−1, and six candidate AGN, those with 3 × 1041≲ L2 − 10 keV ≲ 1042 erg s−1. The remaining 16 X-ray sources have L2 − 10 keV ≲ 3 × 1041 erg s−1 and are classified as normal galaxies/LLAGN. For comparison, Haines et al. (2012) find a total of 28 AGN with L0.3 − 7 keV ≳ 1042 erg s−1 and 48 AGN with L0.3 − 7 keV ≳ 2 × 1041 erg s−1 in a sample of 26 clusters at z = 0.15–0.3. This corresponds to an average number of 1 and 2 AGN per cluster, respectively, with an upper limit of 6 AGN per cluster. Gilmour et al. (2009) find similar numbers. Therefore, we find in the Bullet cluster at least three times more AGN than the average value of Gilmour et al. (2009) and Haines et al. (2012), and possibly twice their upper limit.
The 13 bona fide or candidate AGN contribute to the observed over-density of X-ray source with respect to the field at medium and high H band fluxes. In particular, the observed over-density at bright fluxes in region B is totally due to Bullet cluster bona fide AGN. In region C two-thirds of the bright H band sources have an estimated redshift, are field AGN, and are bright HH sources. Therefore in C region part of the observed over-density in the H band could be due to field AGN, even if the remaining sources belonged to the Bullet cluster. Spectroscopic identification of more X-ray bright sources in region C is needed to definitely assess whether sources associated with the Bullet cluster contribute to the over-density in this region. The 16 X-ray emitting normal galaxies/LLAGN contribute to the over-density observed near the survey flux limits. The analysis of X-ray hardness ratios suggests that region A contains a higher concentration of obscured AGN. Moreover, in region A we find a candidate CT AGN at the redshift of the Bullet cluster.
In conclusion, our analysis suggests that the over-density of bright H and HH sources in regions B and C is mostly due to AGN belonging to the Bullet cluster and that the over-density of faint sources X-ray sources in region A is mostly due to star-forming galaxies and low luminosity and/or highly obscured AGN belonging to the Bullet cluster.
It is known that the Bullet cluster has high star-formation activity (Rawle et al. 2010), therefore we can speculate that the over-densities observed in regions A, B, and C can be explained if the same mechanism can trigger both star formation and nuclear accretion. Magnification of background sources has likely little effect in producing the observed over-densities, otherwise we would have observed a higher over-density in the inner regions, closer to the peak of the dark matter distribution.
7.3. Fraction of active, X-ray galaxies
Clusters of galaxies are over-dense regions of the Universe. Thus it is not surprising that excess X-ray sources with respect to the field are found. Haines et al. (2012) and Ehlert et al. (2014) find that the average fraction of bright, active galaxies (F > 10−14 erg cm−2 s−1) in cluster cores is two to three times lower than in the field, while it is similar to that in the field at radii above R200. In the Bullet cluster we find a fraction of bright, active galaxies consistent with that in the field at all radii but the statistical uncertainty at R < 0.66R200 are too big to draw strong conclusions (see Fig. 9).
Finally, we estimated the fraction of galaxies belonging to the Bullet cluster hosting an AGN; we use for this estimate both bona fide and candidate AGN. We find a fraction of 1.0 ± 0.4% constant, within the rather large error-bars, with the distance from the cluster core. This AGN fraction is consistent with the results of Haines et al. (2012, 0.73 ± 0.14%) and Martini et al. (2007, 1%) for AGN of similar luminosities in clusters at redshifts similar to that of the Bullet cluster and also with the results of Haggard et al. (2010; 1.19 ) for AGN in field. Limiting the analysis to AGN with L2 − 10 keV > 1043 erg s−1 reduces the AGN fraction to
  in the total A+B+C region and to
  in the region A+B, within R200 (no luminous AGN is present in region C). At these luminosities Martini et al. (2013) find a slightly smaller fraction, 0.107
 . Haggard (2012, priv. comm. in Martini et al. 2013) reports a field AGN fraction of 0.64
 . In conclusion, the higher luminosity AGN fraction in the Bullet cluster is consistent with the fraction found in the field and thus slightly higher than the average fraction found in clusters. This result is however based on only three AGN, and thus we cannot exclude that it is due to a statistical fluctuation.
7.4. Spatial distribution of active galaxies
We analysed the spatial distribution around the cluster of the bona fide AGN, candidate AGN, X–ray normal/LLAGN, star-forming (ELG), and passive (ALG) galaxies at the redshift of the Bullet cluster. The spatial distribution of the different samples of sources in regions A, B, and C is not statistically different. Nevertheless, as expected, in the core of the cluster (the red elliptical region in Fig. 1), there are only ALG galaxies. The similar spatial distribution of active galaxies suggests that the trigger of gas accretion on SMBHs and star formation is also similar.
The conclusions in Sect. 7.3 are based on galaxies with a measured redshift, which are however a minority of all the galaxies in the Bullet field. To increase the sample and therefore avoid selection effects which can bias the results, we also considered the sample of all galaxies with a measured IRAC colour. This includes of course both cluster members and foreground or background galaxies. We assume that the distribution of the latter galaxies does not depend on the cluster geometry outside the cluster core because outside this region the magnification of background galaxies is likely negligible, as found for the AGN sample.
We considered samples of high and low star-formation galaxies (HSFRG and LSFRG), selected by comparing their IRAC colours to those of M82, a local star-forming galaxy, and NGC 4429, a passive galaxy. The fraction of LSFRG is higher near to the cluster centre and decreases at increasing radii. Conversely, the fraction of HSFRG is constant with the radius and remains at all radii smaller than the fraction of LSFRG. Chandra sources with IRAC counterparts follow a similar behaviour, thus suggesting that AGN and star formation activities are triggered by the same mechanism.
We finally find a high concentration of X-ray sources with IRAC colours near zero, in particular in the C region. We obtained redshifts for 8 of these 29 sources: 7 are stars and 1 is not a cluster member, suggesting that most of these sources are stars.
The cluster core is the region inside the radius at which the surface number density equals one-half its peak value (average value of 0.17 ± 0.02 Mpc for H0 = 70 km s−1 Mpc−1, Bahcall 1973).
The values R500, R200, R100 are the radii within which the density contrast with the critical density of the universe is 500, 200, and 100, respectively. R100 (∼ the virial radius) is ≃1.3 × R200.
fE ∝ E−Γ with Γ = αE + 1 and αE energy index.
Acknowledgments
This work is based on observations collected at the European Southern Observatory under ESO programme 090.A−0267. We are grateful to Andrea Grazian for useful discussions on WFI and IRAC data reduction and to Chiara Feruglio for comments that helped to improve the presentation. We acknowledge the anonymous referee for her/his comments, that helped improving the quality of the manuscript. FF and AB acknowledge support from contract PRIN-INAF-2016 FORECAST, and contract ASI/INAF I/037/12/0.
References
- Bahcall, N. A. 1973, ApJ, 180, 699 [NASA ADS] [CrossRef] [Google Scholar]
- Baldi, A., Molendi, S., Comastri, A., et al. 2002, ApJ, 564, 190 [NASA ADS] [CrossRef] [Google Scholar]
- Baldwin, J. A., Phillips, M. M., & Terlevich, R. 1981, PASP, 93, 5 [NASA ADS] [CrossRef] [EDP Sciences] [Google Scholar]
- Barrena, R., Biviano, A., Ramella, M., Falco, E. E., & Seitz, S. 2002, A&A, 386, 816 [NASA ADS] [CrossRef] [EDP Sciences] [Google Scholar]
- Bertin, E., & Arnouts, S. 1996, A&AS, 117, 393 [NASA ADS] [CrossRef] [EDP Sciences] [Google Scholar]
- Bertin, E., Mellier, Y., Radovich, M., et al. 2002, ASPC, 281, 228 [Google Scholar]
- Binney, J., May, A., & Ostriker, J. P. 1987, MNRAS, 226, 149 [NASA ADS] [Google Scholar]
- Bradač, M., Clowe, D., Gonzalez, A., et al. 2006, ApJ, 652, 937 [NASA ADS] [CrossRef] [Google Scholar]
- Bradač, M., Treu, T., Applegate, D., et al. 2009, ApJ, 706, 1201 [NASA ADS] [CrossRef] [Google Scholar]
- Cappelluti, N., Cappi, M., Dadina, M., et al. 2005, A&A, 430, 39 [NASA ADS] [CrossRef] [EDP Sciences] [Google Scholar]
- Cavaliere, A., & Vittorini, V. 2000, ApJ, 543, 599 [NASA ADS] [CrossRef] [Google Scholar]
- Chung, S. M., Gonzalez, A. H., Clowe, D., Markevitch, M., & Zaritsky, D. 2010, ApJ, 725, 1536 [NASA ADS] [CrossRef] [Google Scholar]
- Civano, F., Elvis, M., Brusa, M., et al. 2012, ApJS, 201, 30 [NASA ADS] [CrossRef] [Google Scholar]
- Civano, F., Marchesi, S., Comastri, A., et al. 2016, ApJ, 819, 62 [NASA ADS] [CrossRef] [Google Scholar]
- Clowe, D., Gonzalez, A., & Markevitch, M. 2004, ApJ, 604, 596 [NASA ADS] [CrossRef] [Google Scholar]
- Clowe, D., Bradac, M., Gonzalez, A., et al. 2006, ApJ, 648, L109 [NASA ADS] [CrossRef] [Google Scholar]
- Comastri, A., Gilli, R., Vignali, C., et al. 2007, Prog. Theor. Phys. Suppl., 169, 274 [NASA ADS] [CrossRef] [Google Scholar]
- Damiani, F., Maggio, A., Micela, G., & Sciortino, S. 1997, ApJ, 483, 350 [NASA ADS] [CrossRef] [Google Scholar]
- Devriendt, J. E. G., Guiderdoni, B., & Sadat, R. 1999, A&A, 350, 381 [NASA ADS] [Google Scholar]
- Ehlert, S., Allen, S. W., Brandt, W. N., et al. 2013, MNRAS, 428, 3509 [NASA ADS] [CrossRef] [Google Scholar]
- Ehlert, S., von der Linden, A., Allen, S. W., et al. 2014, MNRAS, 437, 1942 [NASA ADS] [CrossRef] [Google Scholar]
- Ehlert, S., Allen, S. W., Brandt, W. N., et al. 2015, MNRAS, 446, 2709 [Google Scholar]
- Elmegreen, B. G., Elmegreen, D. M., & Brinks, E. 1998, ApJ, 503, L119 [NASA ADS] [CrossRef] [Google Scholar]
- Elvis, M., Civano, F., Vignali, C., et al. 2009, ApJS, 184, 158 [NASA ADS] [CrossRef] [Google Scholar]
- Fazio, G. G., Hora, J. L., Allen, L. E., et al. 2004, ApJS, 154, 10 [NASA ADS] [CrossRef] [Google Scholar]
- Foex, G., Bohringer, H., & Chon, G. 2017, A&A, 606, A122 [NASA ADS] [CrossRef] [EDP Sciences] [Google Scholar]
- Fruscione, A., McDowell, J., Allen, G., et al. 2006, SPIE, 6270E, 1V [Google Scholar]
- Fukugita, M., Shimasaku, K., & Ichikawa, T. 1995, PASP, 107, 945 [NASA ADS] [CrossRef] [Google Scholar]
- Gaspari, M., & Sadowski, A. 2017, ApJ, 837, 149 [NASA ADS] [CrossRef] [Google Scholar]
- Gaspari, M., Ruszkowski, M., & Oh, S. 2013, MNRAS, 432, 3401 [NASA ADS] [CrossRef] [Google Scholar]
- Gehrels, N. 1986, ApJ, 303, 336 [NASA ADS] [CrossRef] [Google Scholar]
- Genzel, R., Burkert, A., Bouché, N., et al. 2008, ApJ, 687, 59 [NASA ADS] [CrossRef] [Google Scholar]
- Gilmour, R., Best, P., & Almaini, O. 2009, MNRAS, 392, 1509 [NASA ADS] [CrossRef] [Google Scholar]
- Guzzo, L., Schuecker, P., Böhringer, H., et al. 2009, A&A, 499, 357 [NASA ADS] [CrossRef] [EDP Sciences] [Google Scholar]
- Haggard, D., Green, P. J., Anderson, S. F., et al. 2010, ApJ, 723, 1447 [NASA ADS] [CrossRef] [Google Scholar]
- Haines, C. P., Pereira, M. J., Sanderson, A. J. R., et al. 2012, ApJ, 754, 97 [NASA ADS] [CrossRef] [Google Scholar]
- Hopkins, P. F., & Quataert, E. 2011, MNRAS, 415, 1027 [NASA ADS] [CrossRef] [Google Scholar]
- Ilbert, O., Capak, P., Salvato, M., et al. 2009, ApJ, 690, 1236 [NASA ADS] [CrossRef] [Google Scholar]
- Johansson, D., Horellou, C., Sommer, M. W., et al. 2010, A&A, 514, A77 [NASA ADS] [CrossRef] [EDP Sciences] [Google Scholar]
- Jones, D., Read, M., Saunders, W., et al. 2009, MNRAS, 399, 683 [NASA ADS] [CrossRef] [Google Scholar]
- Kauffmann, G., Heckman, T., Tremonti, C., et al. 2003, MNRAS, 346, 1055 [Google Scholar]
- Kawamuro, T., Ueda, Y., Tazaki, F., Terashima, Y., & Mushotzky, R. 2016, ApJ, 831, 37 [NASA ADS] [CrossRef] [Google Scholar]
- Kennicutt, Jr., R. C., Tamblyn, P., & Congdon, C. E. 1994, ApJ, 435, 22 [Google Scholar]
- Kewley, L. J., Dopita, M. A., Sutherland, R. S., Heisler, C. A., & Trevena, J. 2001, ApJ, 556, 121 [Google Scholar]
- Kim, D. W., & Fabbiano, G. 2004, ApJ, 611, 846 [NASA ADS] [CrossRef] [Google Scholar]
- Le Fèvre, O., Cassata, P., Cucciati, O., et al. 2013, A&A, 559, A14 [NASA ADS] [CrossRef] [EDP Sciences] [Google Scholar]
- Lehmer, B. D., Xue, Y. Q., Brandt, W. N., et al. 2012, ApJ, 752, 46 [NASA ADS] [CrossRef] [Google Scholar]
- Lehmer, B. D., Basu-Zych, A. R., & Mineo, S. 2016, ApJ, 825, 7 [NASA ADS] [CrossRef] [Google Scholar]
- Liang, H., Hunstead, R. W., Birkinshaw, M., & Andreani, P. 2000, ApJ, 544, 686 [NASA ADS] [CrossRef] [Google Scholar]
- Luo, B., Bauer, F. E., Brandt, W. N., et al. 2008, ApJS, 179, 19 [NASA ADS] [CrossRef] [Google Scholar]
- Magdziarz, P., & Zdziarski, A. A. 1995, MNRAS, 273, 837 [NASA ADS] [CrossRef] [Google Scholar]
- Mamon, G. A. 1992, ApJ, 401, L3 [NASA ADS] [CrossRef] [Google Scholar]
- Marchesi, S., Civano, F., Elvis, M., et al. 2016, ApJ, 817, 34 [NASA ADS] [CrossRef] [Google Scholar]
- Marchesi, S., Tremblay, L., Ajello, M., et al. 2017, ApJ, 848, 53 [NASA ADS] [CrossRef] [Google Scholar]
- Martini, P., Mulchaey, J. S., & Kelson, D. D. 2007, ApJ, 664, 761 [NASA ADS] [CrossRef] [EDP Sciences] [Google Scholar]
- Martini, P., Miller, E. D., Brodwin, M., et al. 2013, ApJ, 768, 1 [Google Scholar]
- Menci, N., Gatti, M., Fiore, F., & Lamastra, A. 2014, A&A, 569, A37 [NASA ADS] [CrossRef] [EDP Sciences] [Google Scholar]
- Mineo, S., Gilfanov, M., & Sunyaev, R. 2012, MNRAS, 419, 2095 [NASA ADS] [CrossRef] [Google Scholar]
- Monet, D. G., Levine, S. E., Canzian, B., et al. 2003, ApJ, 125, 984 [Google Scholar]
- Moretti, A., Campana, S., Lazzati, D., & Tagliaferri, G. 2003, ApJ, 588, 696 [NASA ADS] [CrossRef] [Google Scholar]
- Poggianti, B. M., Jaffe, Y., Moretti, A., et al. 2017, Nature, 548, 304 [NASA ADS] [CrossRef] [Google Scholar]
- Puccetti, S., Vignali, C., & Cappelluti, N. 2009, ApJS, 185, 586 [NASA ADS] [CrossRef] [Google Scholar]
- Puccetti, S., Comastri, A., Fiore, F., et al. 2014, ApJ, 793, 26 [NASA ADS] [CrossRef] [Google Scholar]
- Ranalli, P., Comastri, A., & Setti, G. 2003, A&A, 399, 39 [NASA ADS] [CrossRef] [EDP Sciences] [Google Scholar]
- Rawle, T. D., Chung, S. M., Fadda, D., et al. 2010, A&A, 518, L14 [NASA ADS] [CrossRef] [EDP Sciences] [Google Scholar]
- Rawle, T. D., Rex, M., Egami, E., et al. 2012, ApJ, 756, 106 [NASA ADS] [CrossRef] [Google Scholar]
- Rex, M., Rawle, T. D., Egami, E., et al. 2010, A&A, 518, L13 [NASA ADS] [CrossRef] [EDP Sciences] [Google Scholar]
- Ruderman, J. T., & Ebeling, H. 2005, ApJ, 623, L81 [NASA ADS] [CrossRef] [Google Scholar]
- Sereno, M. 2015, MNRAS, 450, 3665 [NASA ADS] [CrossRef] [Google Scholar]
- Simkin, S. M., Su, H. J., & Schwarz, M. P. 1980, ApJ, 237, 404 [NASA ADS] [CrossRef] [Google Scholar]
- Souchay, J., Andrei, A. H., Barache, C., et al. 2015, A&A, 583, A75 [NASA ADS] [CrossRef] [EDP Sciences] [Google Scholar]
- Springel, V., & Farrar, G. R. 2007, MNRAS, 380, 911 [NASA ADS] [CrossRef] [Google Scholar]
- Stern, D., Eisenhardt, P., Gorjian, V., et al. 2005, ApJ, 631, 163 [NASA ADS] [CrossRef] [Google Scholar]
- Stott, J. P., Collins, C. A., Burke, C., Hamilton-Morris, V., & Smith, G. P. 2011, MNRAS, 414, 445 [NASA ADS] [CrossRef] [Google Scholar]
- Sun, M., Jones, C., Forman, W., et al. 2007, ApJ, 657, 197 [NASA ADS] [CrossRef] [Google Scholar]
- Tanimoto, A., Ueda, Y., Kawamuro, T., et al. 2018, ApJ, 853, 146 [NASA ADS] [CrossRef] [Google Scholar]
- Ueda, Y., Eguchi, S., Terashima, Y., et al. 2007, ApJ, 664, L79 [NASA ADS] [CrossRef] [Google Scholar]
- Veilleux, S., & Osterbrock, D. E. 1987, ApJS, 63, 295 [NASA ADS] [CrossRef] [Google Scholar]
- Voit, G., & Donahue, M. 2015, ApJ, 799, L1 [Google Scholar]
- Xue, Y. Q., Luo, B., Brandt, W. N., et al. 2011, ApJS, 195, 10 [NASA ADS] [CrossRef] [Google Scholar]
- Zhang, Y., Miller, C., McKay, T., et al. 2016, ApJ, 816, 98 [NASA ADS] [CrossRef] [Google Scholar]
Appendix A: Cluster members
The table in this section shows the properties of the 49 cluster members.
Cluster members properties.
Appendix B: VIMOS optical spectra
The figures in this section show the VIMOS optical spectra of 49 cluster members (see Table A.1).
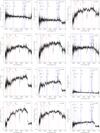 |
Fig. B.1. VIMOS optical spectra of 49 cluster members (see Table A.1). From top to bottom and from left to right spectrum of sources #2, 3, 4, 5, 6, 7, 10, 13, 16, 17, 19, 20. |
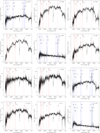 |
Fig. B.1. continued. Sources #21, 22, 23, 24, 25, 26, 29, 31, 32, 33, 34, 35. |
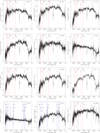 |
Fig. B.1. continued. Sources #37, 38, 39, 40, 41, 42, 44, 45, 46, 47, 48, 50. |
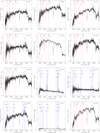 |
Fig. B.1. continued. Sources #51, 52, 53, 54, 55, 57, 58, 59, 60, 61, 62, 63. |
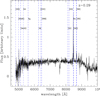 |
Fig. B.1. continued. Source #64. |
Appendix C: New spectroscopic redshift of field sources
New spectroscopic redshift of sources in the Bullet field.
All Tables
All Figures
|
Fig. 1. Mosaic of the 10 Chandra observations (see Sect. 2.1) of the Bullet cluster field in the 0.5–7 keV energy range. The green circles are centred on the main cluster and have radii of ∼5.3′ and ∼8.07′, corresponding to 0.66 and 1 × R200. The observations cover up to ∼2 × R200 (i.e. ∼1.5× virial radii). The red elliptical region denotes the area with the strongest ICM (i.e. intracluster medium) emission at distance less than < 0.3 × R200 (i.e. ∼0.2 × virial radii), which has been excluded from our analysis. The cyan dashed elliptical region is centred in the peak of the dark matter distribution, which is significantly shifted eastward from the peak of the X-ray emission (Clowe et al. 2004, 2006). |
| In the text | |
|
Fig. 2. Grey scale image of the mosaic of the ten Chandra observations of the Bullet cluster field in the 0.5–7 keV energy range (see Fig. 1). The green, red, and black squares indicate three VIMOS fields. The magenta and blue dashed boxes indicate the portion of the field covered by IRAC ch1–ch3 and IRAC ch2–ch4 photometry, respectively. |
| In the text | |
|
Fig. 3. From top to bottom: sky coverage calculated as in Sect. 4.1 in the S, H, and HH energy bands, excluding the area with the strongest ICM emission (black dotted lines, see also Fig. 1) and the A (green solid lines), B (red long dashed lines), and C (blue short dashed lines) regions (see Fig. 1 and Sect. 4.1). |
| In the text | |
|
Fig. 4. Top panels: X-ray number counts of the X-ray point sources in the Bullet cluster regions A (green solid circles), B (red open circles), and C (blue solid triangles). Left panel: 0.5–2 keV, magenta solid line represents field number counts from Moretti et al. (2003). Central panel: 2–10 keV, magenta solid line indicates field number counts from Moretti et al. (2003). Right panel: 5–10 keV, magenta dash-dotted line shows HELLAS2XMM 5–10 keV number counts from Baldi et al. (2002); magenta open circles indicate CDF-S 5–10 keV number counts from Luo et al. (2008). The black dotted vertical lines identify the three flux ranges: faint, medium, and bright. Bottom panels: excess densities with respect to field number counts as functions of the distance from the cluster centre in the three energy bands 0.5–2 keV (left panel), 2–10 keV (central panel), and 5–10 keV (right panel). Faint flux sources are shown by small open circles; medium flux sources are indicated by medium open circles; bright flux sources are shown by large open circles; all sources are represented by stars. The excess densities could include some contribution from cosmic variance (< 1.25, < 1.20, and < 1.10 in the A, B, and C regions, respectively; see Sect. 4.3). |
| In the text | |
|
Fig. 5. Left panel: Chandra spectrum of source #13 (see Table A.1) grouped to have at least 10 counts per energy bin. Right panel: 68% and 90% confidence contours of the FeKα line energy at redshift ∼0.3 as a function of the line normalisation. |
| In the text | |
|
Fig. 6. Top panel: histogram of the distances between the X-ray sources and their optical counterparts. Middle panel: histogram of the distances between the X-ray sources and their counterparts in IRAC ch1 (empty histogram), and IRAC ch2 (dashed histogram). Bottom panel: histogram of the distances between the X-ray sources and their counterparts in IRAC ch3 (empty histogram), and IRAC ch4 (dashed histogram). |
| In the text | |
|
Fig. 7. Colour–colour diagram of IRAC sources. Green solid circles indicate sources in region A; red open dots show sources in region B; and blue solid triangles represent sources in region C. The cyan full squares denote sources at the Bullet’s redshift (see Sect. 6). The black contour levels represent C–COSMOS sources. The black solid square and diamond represent two galaxy templates, M 82 and NGC 4429, respectively, which were moved at the redshift of the Bullet. The black dashed line indicates the empirically determined region, largely populated by luminous unobscured AGN (Stern et al. 2005). |
| In the text | |
|
Fig. 8. Ratio of the number of IRAC and Chandra LSFRG and HSFRG to the total samples as functions of the distance from the cluster centre. Red solid dots show Chandra LSFRG; blue solid triangles represent Chandra HSFR; red open dots show IRAC LSFRG; blue open triangles indicate IRAC HSFRG. |
| In the text | |
|
Fig. 9. Fraction of X-ray bright galaxies as a function of the distance from the cluster centre in units of R200. Left panel: black solid squares represent Bullet cluster X-ray sources with 0.5–8 keV flux > 1 × 10⁻¹⁴ erg cm−2 s−1 and red open squares indicate the sample of 42 cluster by Ehlert et al. (2014). The average field AGN fraction in the COSMOS–Legacy survey is denoted by a blue solid line; 1σ uncertainties are identified by the dashed region. Right panel: Black squares represent Bullet cluster sources with 0.5–2 keV flux ≥3 × 10⁻¹⁶ erg cm−2 s−1. The average field AGN fraction in the CDF-S 4 Msec survey is denoted by a blue solid line; 1σ uncertainties are identified by the dashed region. |
| In the text | |
|
Fig. 10. Image mosaic of the 10 Chandra observations of the Bullet field in the 0.5–7 keV energy range (see Fig. 1). The green circles are centred on the main cluster and have increasing radii of 0.66 × R200 and R200 (see Fig. 1). The points of different colours correspond to sources selected from different catalogues with a measured VIMOS redshift: green circles indicate Chandra sources; cyan circles represent WFI sources; and red circles show IRAC sources. The black squares identify the sources with redshifts z ± Δz = (0.296 ± 0.014), corresponding to that of the Bullet cluster. The blue diamonds identify Chandra sources with redshifts, taken from the literature, in the interval z ± Δz = (0.296 ± 0.014). |
| In the text | |
|
Fig. 11. Redshift distribution of the entire analysed sample (open histogram) and X-ray sources (filled histogram). The red dashed line denotes the Bullet cluster’s redshift, the blue dashed line indicates the redshift of a background cluster (Rawle et al. 2010). Inset panel: zoom of the redshift range corresponding to the Bullet cluster, i.e. z ± Δz = (0.296 ± 0.014). |
| In the text | |
|
Fig. 12. Left panel: [OIII]/Hβ vs. [NII]/Hα diagnostic diagram for the Bullet’s sources. The Kewley et al. (2001) extreme starburst line and the Kauffmann et al. (2003) classification line are shown as red solid and blue dashed lines, respectively. The green open dots denote the X-ray sources at the Bullet redshift classified as AGN according to their 2–10 keV luminosity. Right panel: [OIII]/Hβ vs. [SII]/Hα diagnostic diagram. Symbols are represented as in left panel. |
| In the text | |
|
Fig. 13. Ratio of the number of IRAC LSFRG and HSFRG to the total samples as functions of the distance from the cluster centre for the 308 cluster members with IRAC fluxes. Red open dots indicate IRAC LSFRG; blue open triangles show IRAC HSFRG. |
| In the text | |
|
Fig. 14. Fraction of cluster members hosting an X-ray AGN vs. the distance from the cluster centre, in units of R200 (black solid circles). The average X-ray AGN fraction in the A+B+C total region is indicated by the blue solid line; 1σ uncertainties are identified by the dashed regions. |
| In the text | |
|
Fig. B.1. VIMOS optical spectra of 49 cluster members (see Table A.1). From top to bottom and from left to right spectrum of sources #2, 3, 4, 5, 6, 7, 10, 13, 16, 17, 19, 20. |
| In the text | |
|
Fig. B.1. continued. Sources #21, 22, 23, 24, 25, 26, 29, 31, 32, 33, 34, 35. |
| In the text | |
|
Fig. B.1. continued. Sources #37, 38, 39, 40, 41, 42, 44, 45, 46, 47, 48, 50. |
| In the text | |
|
Fig. B.1. continued. Sources #51, 52, 53, 54, 55, 57, 58, 59, 60, 61, 62, 63. |
| In the text | |
|
Fig. B.1. continued. Source #64. |
| In the text | |
Current usage metrics show cumulative count of Article Views (full-text article views including HTML views, PDF and ePub downloads, according to the available data) and Abstracts Views on Vision4Press platform.
Data correspond to usage on the plateform after 2015. The current usage metrics is available 48-96 hours after online publication and is updated daily on week days.
Initial download of the metrics may take a while.