Free Access
Fig. 5.
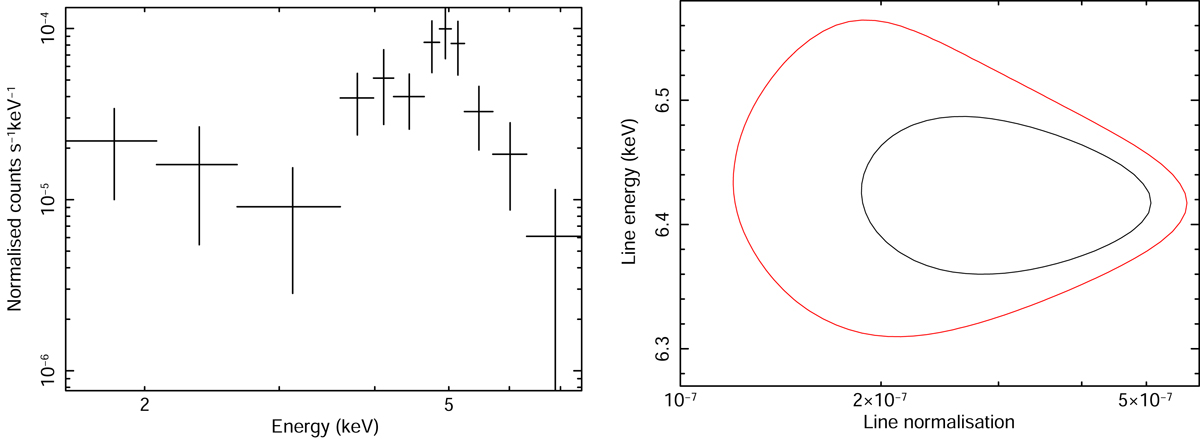
Left panel: Chandra spectrum of source #13 (see Table A.1) grouped to have at least 10 counts per energy bin. Right panel: 68% and 90% confidence contours of the FeKα line energy at redshift ∼0.3 as a function of the line normalisation.
Current usage metrics show cumulative count of Article Views (full-text article views including HTML views, PDF and ePub downloads, according to the available data) and Abstracts Views on Vision4Press platform.
Data correspond to usage on the plateform after 2015. The current usage metrics is available 48-96 hours after online publication and is updated daily on week days.
Initial download of the metrics may take a while.