Fig. 11.
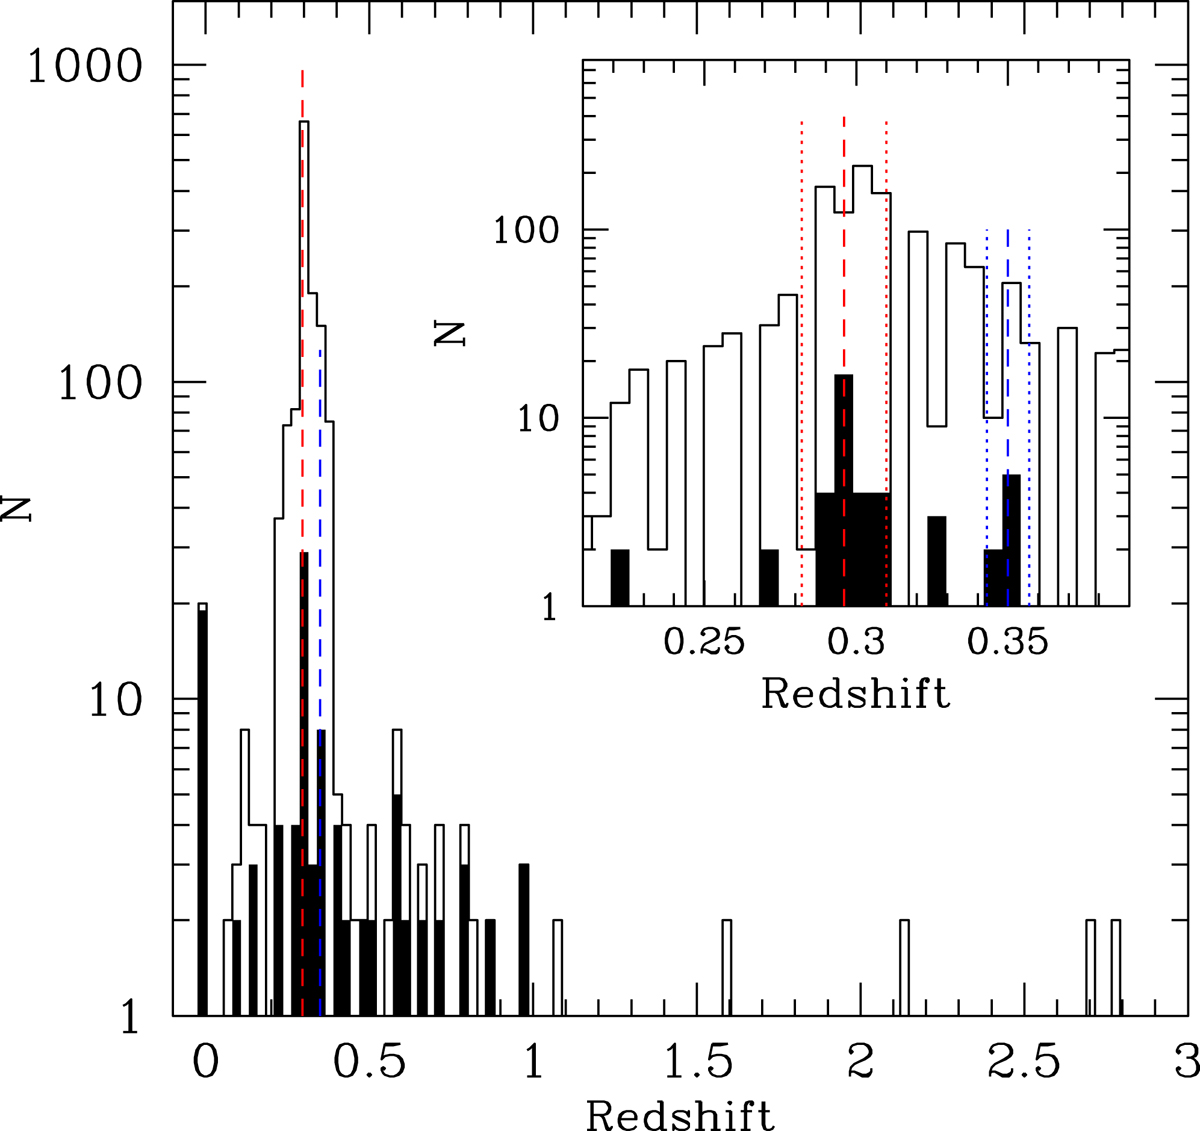
Redshift distribution of the entire analysed sample (open histogram) and X-ray sources (filled histogram). The red dashed line denotes the Bullet cluster’s redshift, the blue dashed line indicates the redshift of a background cluster (Rawle et al. 2010). Inset panel: zoom of the redshift range corresponding to the Bullet cluster, i.e. z ± Δz = (0.296 ± 0.014).
Current usage metrics show cumulative count of Article Views (full-text article views including HTML views, PDF and ePub downloads, according to the available data) and Abstracts Views on Vision4Press platform.
Data correspond to usage on the plateform after 2015. The current usage metrics is available 48-96 hours after online publication and is updated daily on week days.
Initial download of the metrics may take a while.