Fig. 12.
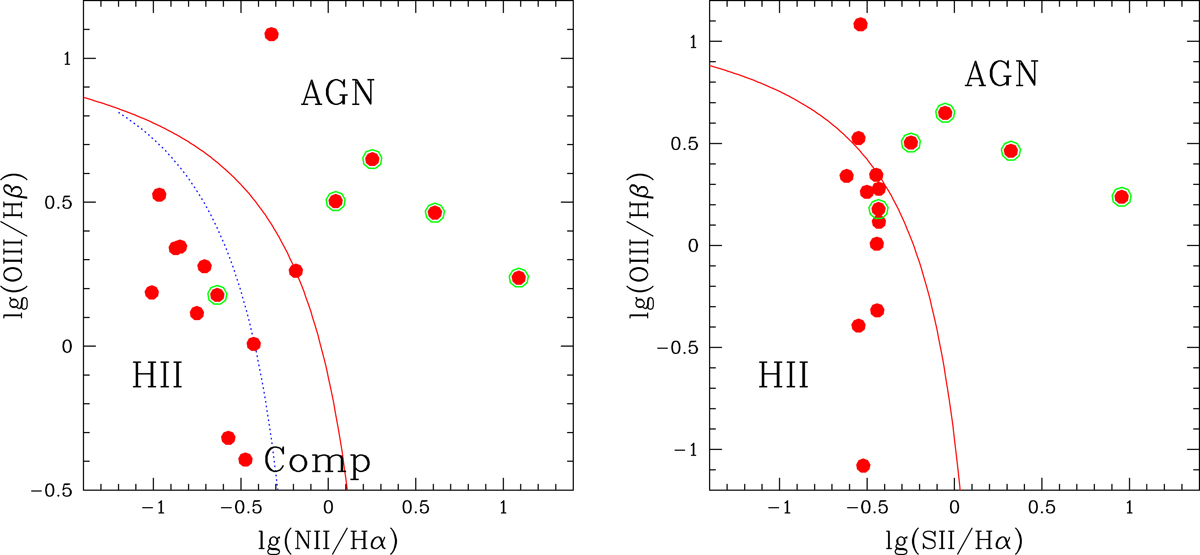
Left panel: [OIII]/Hβ vs. [NII]/Hα diagnostic diagram for the Bullet’s sources. The Kewley et al. (2001) extreme starburst line and the Kauffmann et al. (2003) classification line are shown as red solid and blue dashed lines, respectively. The green open dots denote the X-ray sources at the Bullet redshift classified as AGN according to their 2–10 keV luminosity. Right panel: [OIII]/Hβ vs. [SII]/Hα diagnostic diagram. Symbols are represented as in left panel.
Current usage metrics show cumulative count of Article Views (full-text article views including HTML views, PDF and ePub downloads, according to the available data) and Abstracts Views on Vision4Press platform.
Data correspond to usage on the plateform after 2015. The current usage metrics is available 48-96 hours after online publication and is updated daily on week days.
Initial download of the metrics may take a while.