Fig. 1.
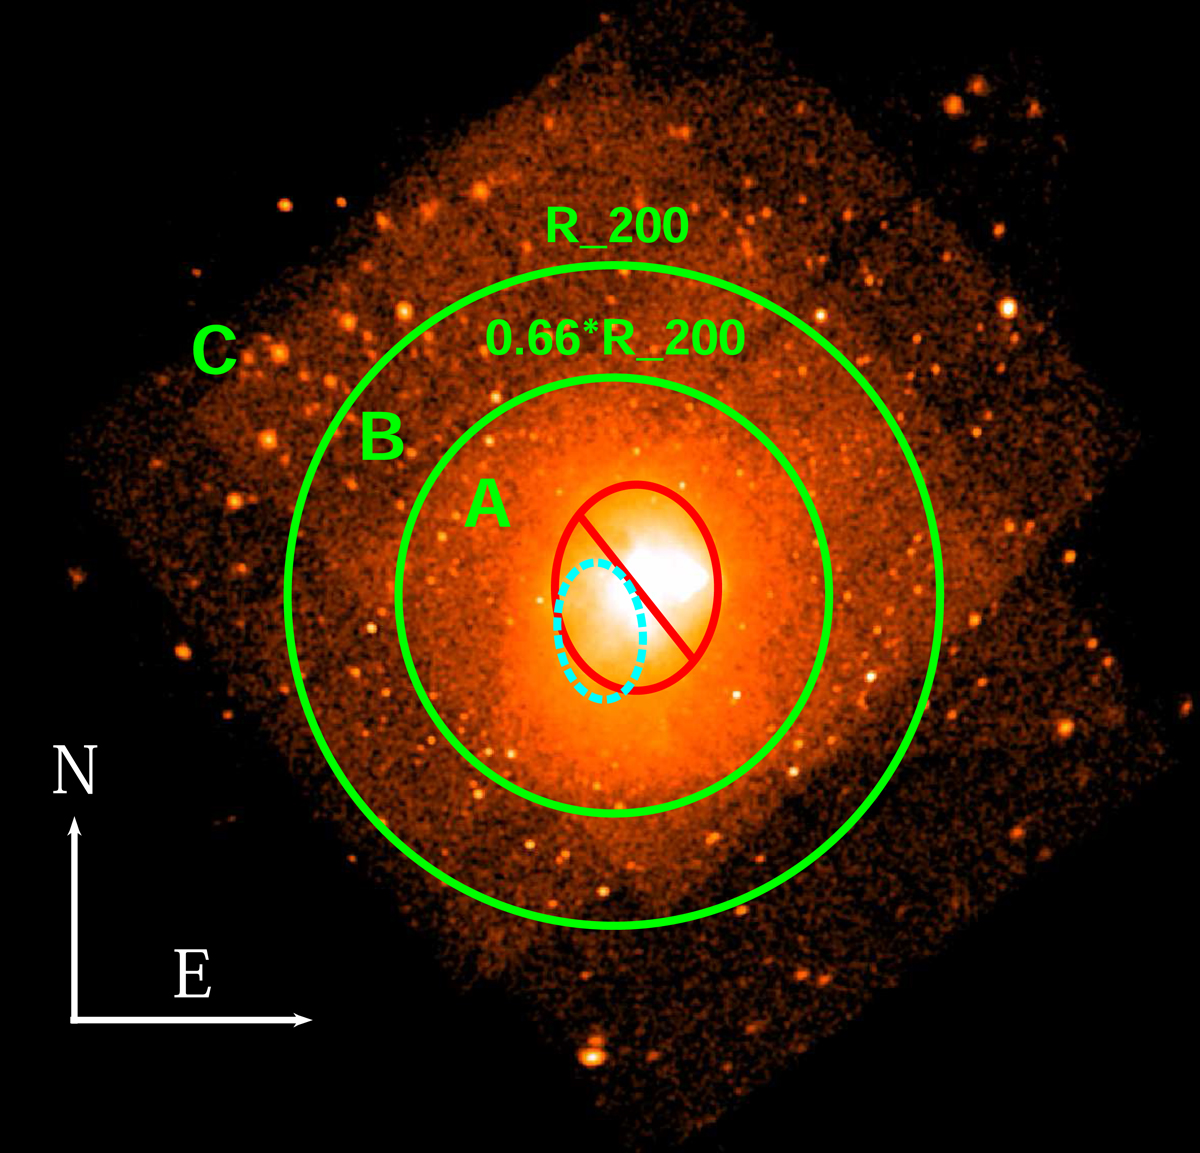
Mosaic of the 10 Chandra observations (see Sect. 2.1) of the Bullet cluster field in the 0.5–7 keV energy range. The green circles are centred on the main cluster and have radii of ∼5.3′ and ∼8.07′, corresponding to 0.66 and 1 × R200. The observations cover up to ∼2 × R200 (i.e. ∼1.5× virial radii). The red elliptical region denotes the area with the strongest ICM (i.e. intracluster medium) emission at distance less than < 0.3 × R200 (i.e. ∼0.2 × virial radii), which has been excluded from our analysis. The cyan dashed elliptical region is centred in the peak of the dark matter distribution, which is significantly shifted eastward from the peak of the X-ray emission (Clowe et al. 2004, 2006).
Current usage metrics show cumulative count of Article Views (full-text article views including HTML views, PDF and ePub downloads, according to the available data) and Abstracts Views on Vision4Press platform.
Data correspond to usage on the plateform after 2015. The current usage metrics is available 48-96 hours after online publication and is updated daily on week days.
Initial download of the metrics may take a while.