Fig. 4.
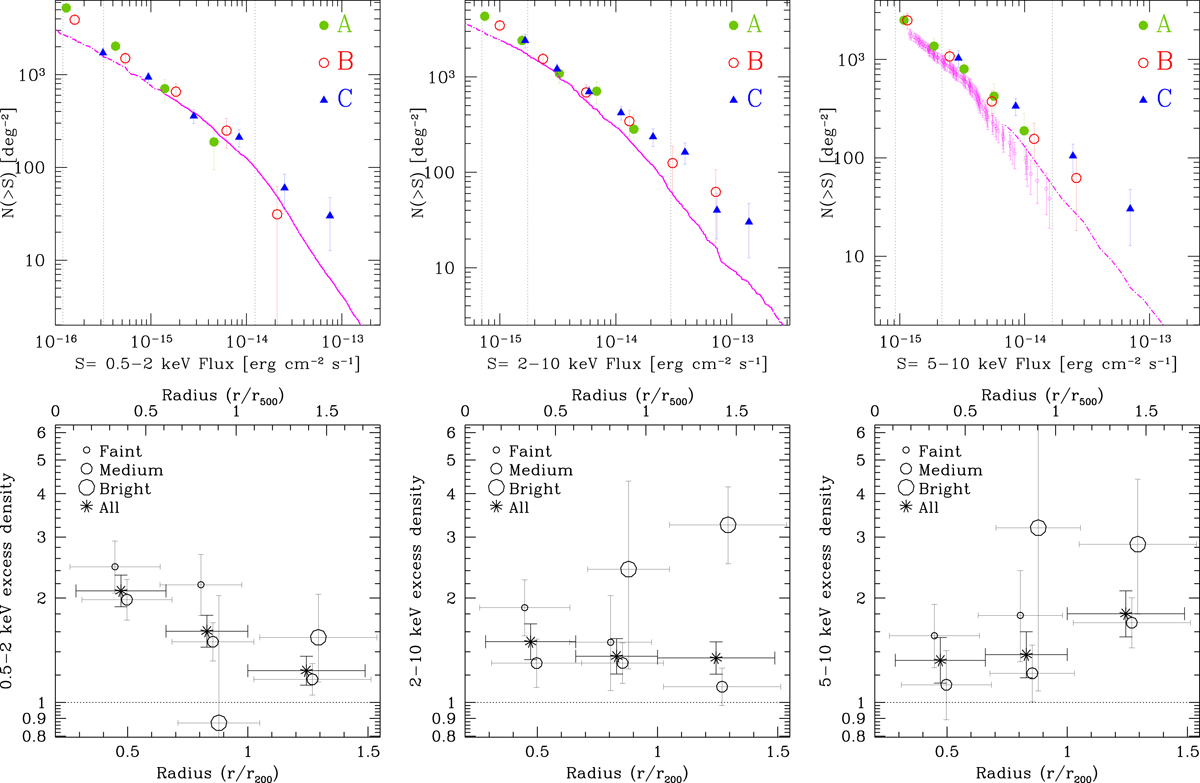
Top panels: X-ray number counts of the X-ray point sources in the Bullet cluster regions A (green solid circles), B (red open circles), and C (blue solid triangles). Left panel: 0.5–2 keV, magenta solid line represents field number counts from Moretti et al. (2003). Central panel: 2–10 keV, magenta solid line indicates field number counts from Moretti et al. (2003). Right panel: 5–10 keV, magenta dash-dotted line shows HELLAS2XMM 5–10 keV number counts from Baldi et al. (2002); magenta open circles indicate CDF-S 5–10 keV number counts from Luo et al. (2008). The black dotted vertical lines identify the three flux ranges: faint, medium, and bright. Bottom panels: excess densities with respect to field number counts as functions of the distance from the cluster centre in the three energy bands 0.5–2 keV (left panel), 2–10 keV (central panel), and 5–10 keV (right panel). Faint flux sources are shown by small open circles; medium flux sources are indicated by medium open circles; bright flux sources are shown by large open circles; all sources are represented by stars. The excess densities could include some contribution from cosmic variance (< 1.25, < 1.20, and < 1.10 in the A, B, and C regions, respectively; see Sect. 4.3).
Current usage metrics show cumulative count of Article Views (full-text article views including HTML views, PDF and ePub downloads, according to the available data) and Abstracts Views on Vision4Press platform.
Data correspond to usage on the plateform after 2015. The current usage metrics is available 48-96 hours after online publication and is updated daily on week days.
Initial download of the metrics may take a while.