Fig. 10.
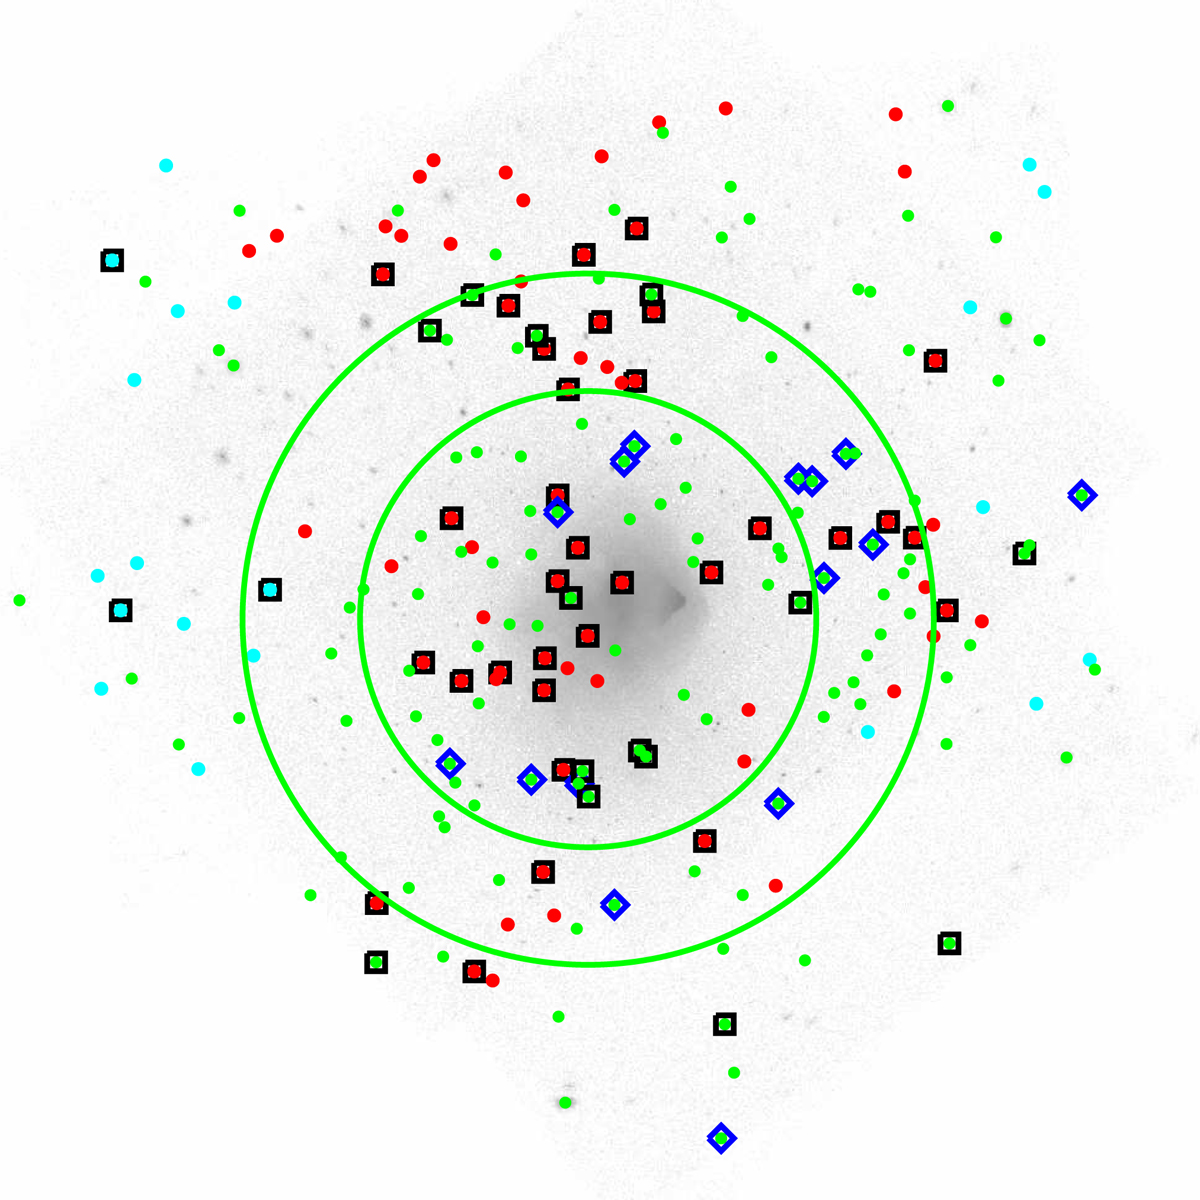
Image mosaic of the 10 Chandra observations of the Bullet field in the 0.5–7 keV energy range (see Fig. 1). The green circles are centred on the main cluster and have increasing radii of 0.66 × R200 and R200 (see Fig. 1). The points of different colours correspond to sources selected from different catalogues with a measured VIMOS redshift: green circles indicate Chandra sources; cyan circles represent WFI sources; and red circles show IRAC sources. The black squares identify the sources with redshifts z ± Δz = (0.296 ± 0.014), corresponding to that of the Bullet cluster. The blue diamonds identify Chandra sources with redshifts, taken from the literature, in the interval z ± Δz = (0.296 ± 0.014).
Current usage metrics show cumulative count of Article Views (full-text article views including HTML views, PDF and ePub downloads, according to the available data) and Abstracts Views on Vision4Press platform.
Data correspond to usage on the plateform after 2015. The current usage metrics is available 48-96 hours after online publication and is updated daily on week days.
Initial download of the metrics may take a while.