Fig. 6.
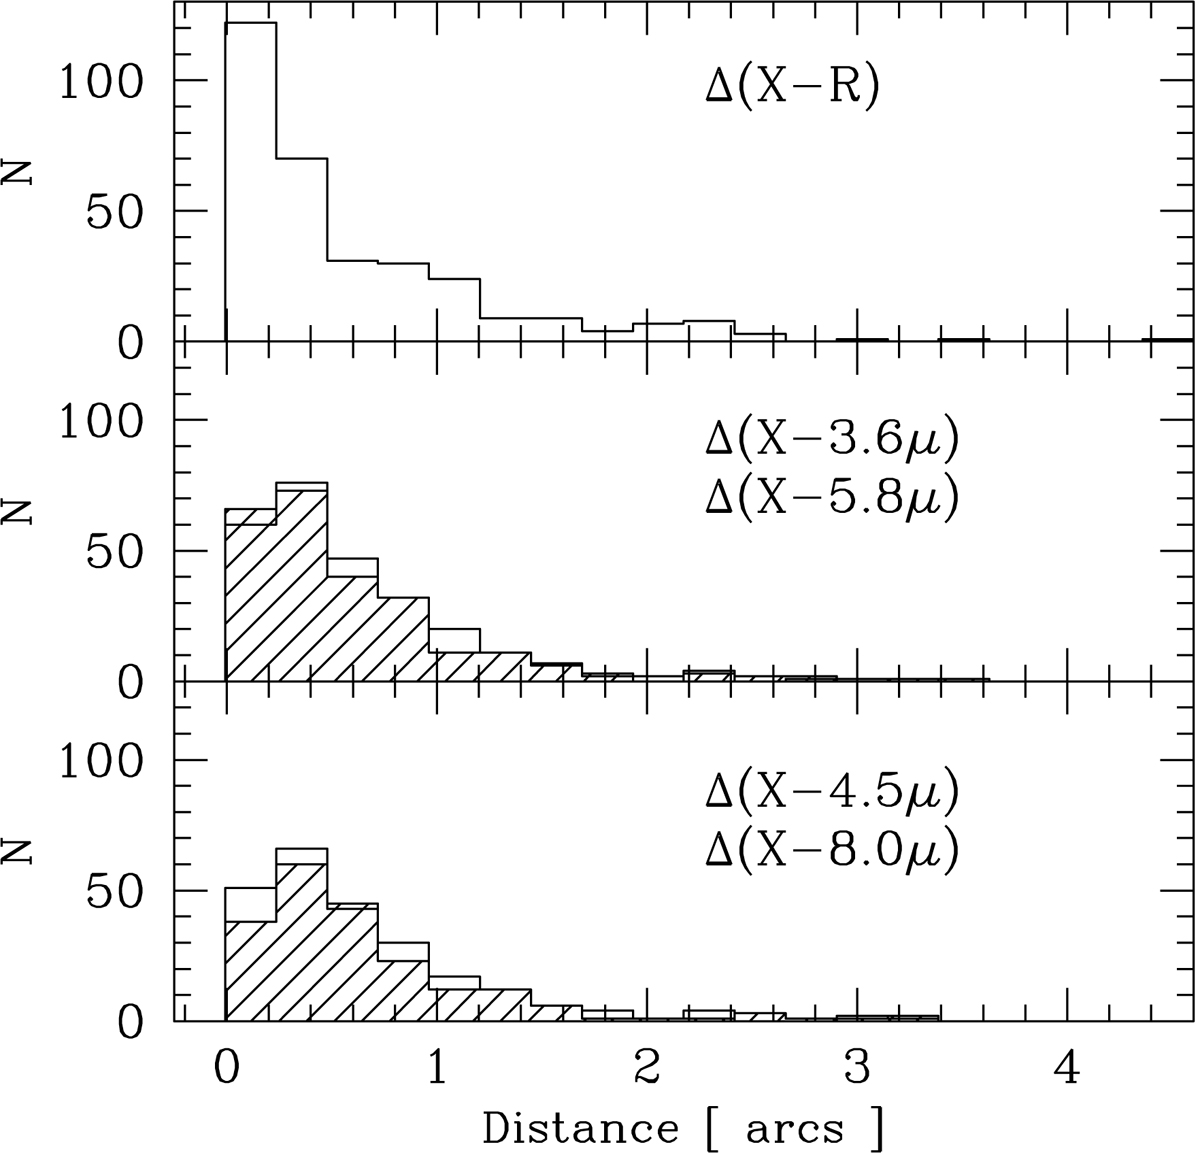
Top panel: histogram of the distances between the X-ray sources and their optical counterparts. Middle panel: histogram of the distances between the X-ray sources and their counterparts in IRAC ch1 (empty histogram), and IRAC ch2 (dashed histogram). Bottom panel: histogram of the distances between the X-ray sources and their counterparts in IRAC ch3 (empty histogram), and IRAC ch4 (dashed histogram).
Current usage metrics show cumulative count of Article Views (full-text article views including HTML views, PDF and ePub downloads, according to the available data) and Abstracts Views on Vision4Press platform.
Data correspond to usage on the plateform after 2015. The current usage metrics is available 48-96 hours after online publication and is updated daily on week days.
Initial download of the metrics may take a while.