Fig. 2.
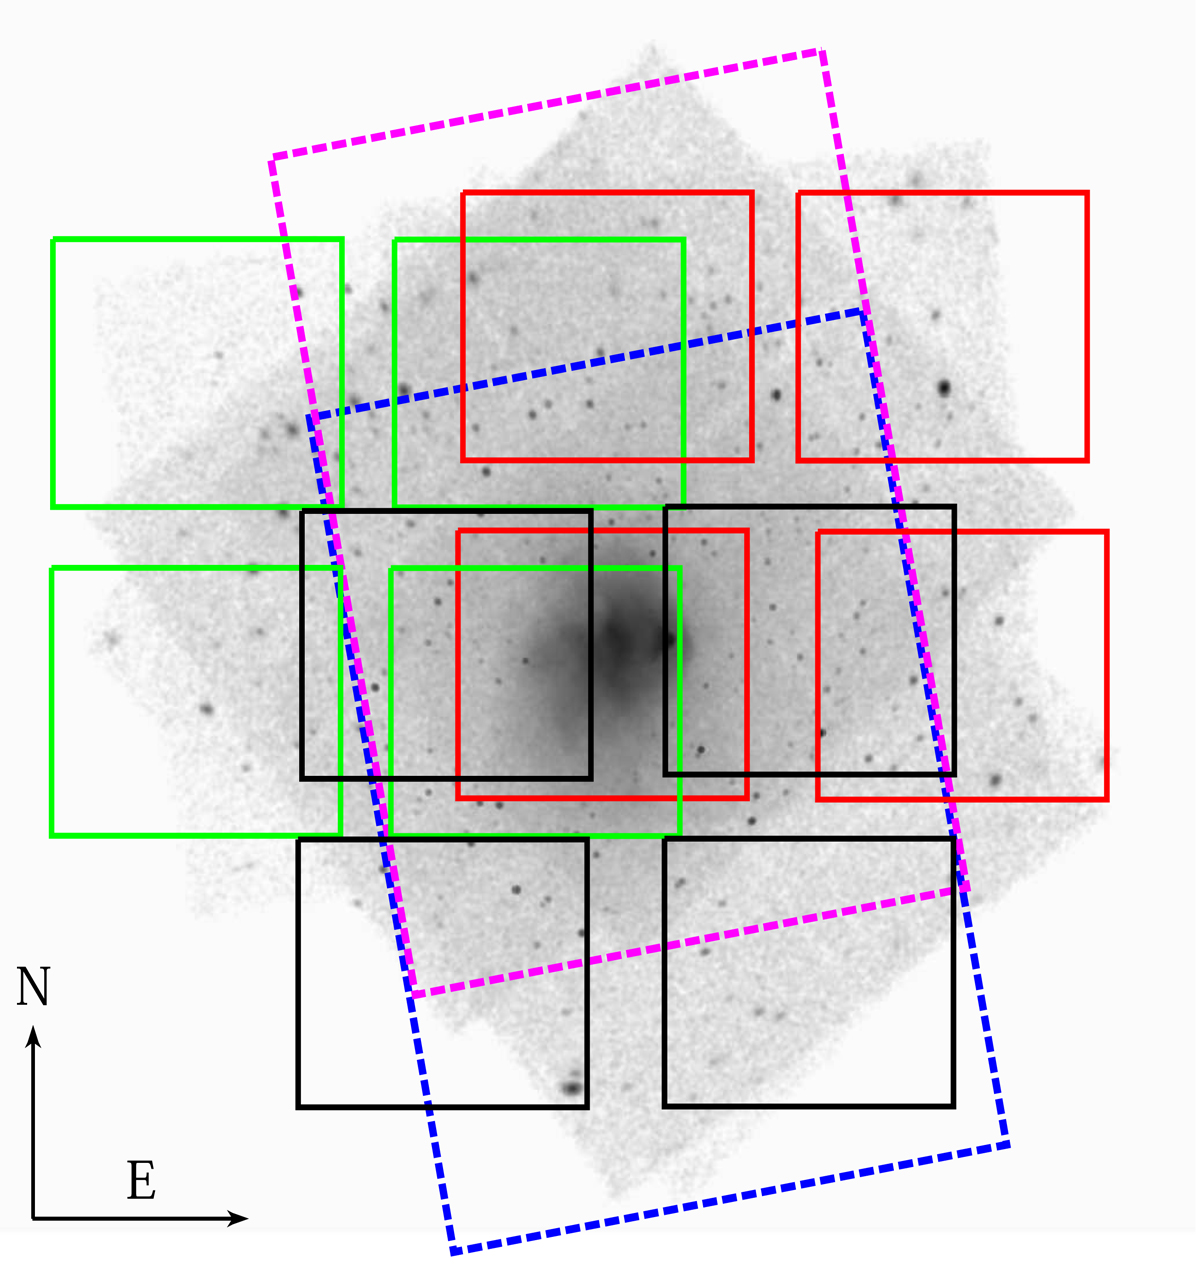
Grey scale image of the mosaic of the ten Chandra observations of the Bullet cluster field in the 0.5–7 keV energy range (see Fig. 1). The green, red, and black squares indicate three VIMOS fields. The magenta and blue dashed boxes indicate the portion of the field covered by IRAC ch1–ch3 and IRAC ch2–ch4 photometry, respectively.
Current usage metrics show cumulative count of Article Views (full-text article views including HTML views, PDF and ePub downloads, according to the available data) and Abstracts Views on Vision4Press platform.
Data correspond to usage on the plateform after 2015. The current usage metrics is available 48-96 hours after online publication and is updated daily on week days.
Initial download of the metrics may take a while.