Free Access
Fig. 13.
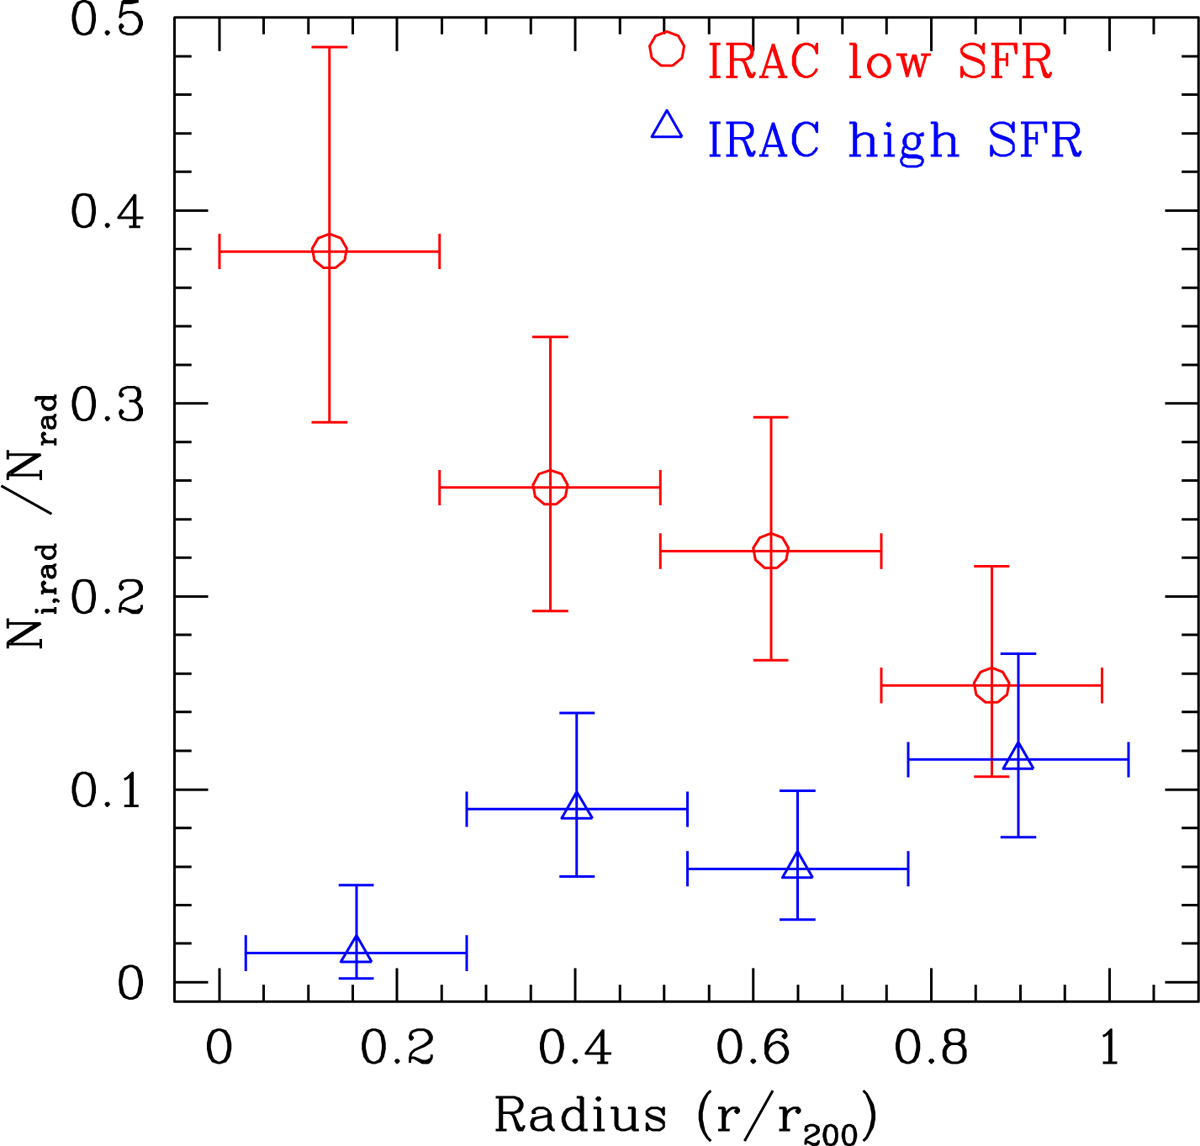
Ratio of the number of IRAC LSFRG and HSFRG to the total samples as functions of the distance from the cluster centre for the 308 cluster members with IRAC fluxes. Red open dots indicate IRAC LSFRG; blue open triangles show IRAC HSFRG.
Current usage metrics show cumulative count of Article Views (full-text article views including HTML views, PDF and ePub downloads, according to the available data) and Abstracts Views on Vision4Press platform.
Data correspond to usage on the plateform after 2015. The current usage metrics is available 48-96 hours after online publication and is updated daily on week days.
Initial download of the metrics may take a while.