Free Access
Fig. 3.
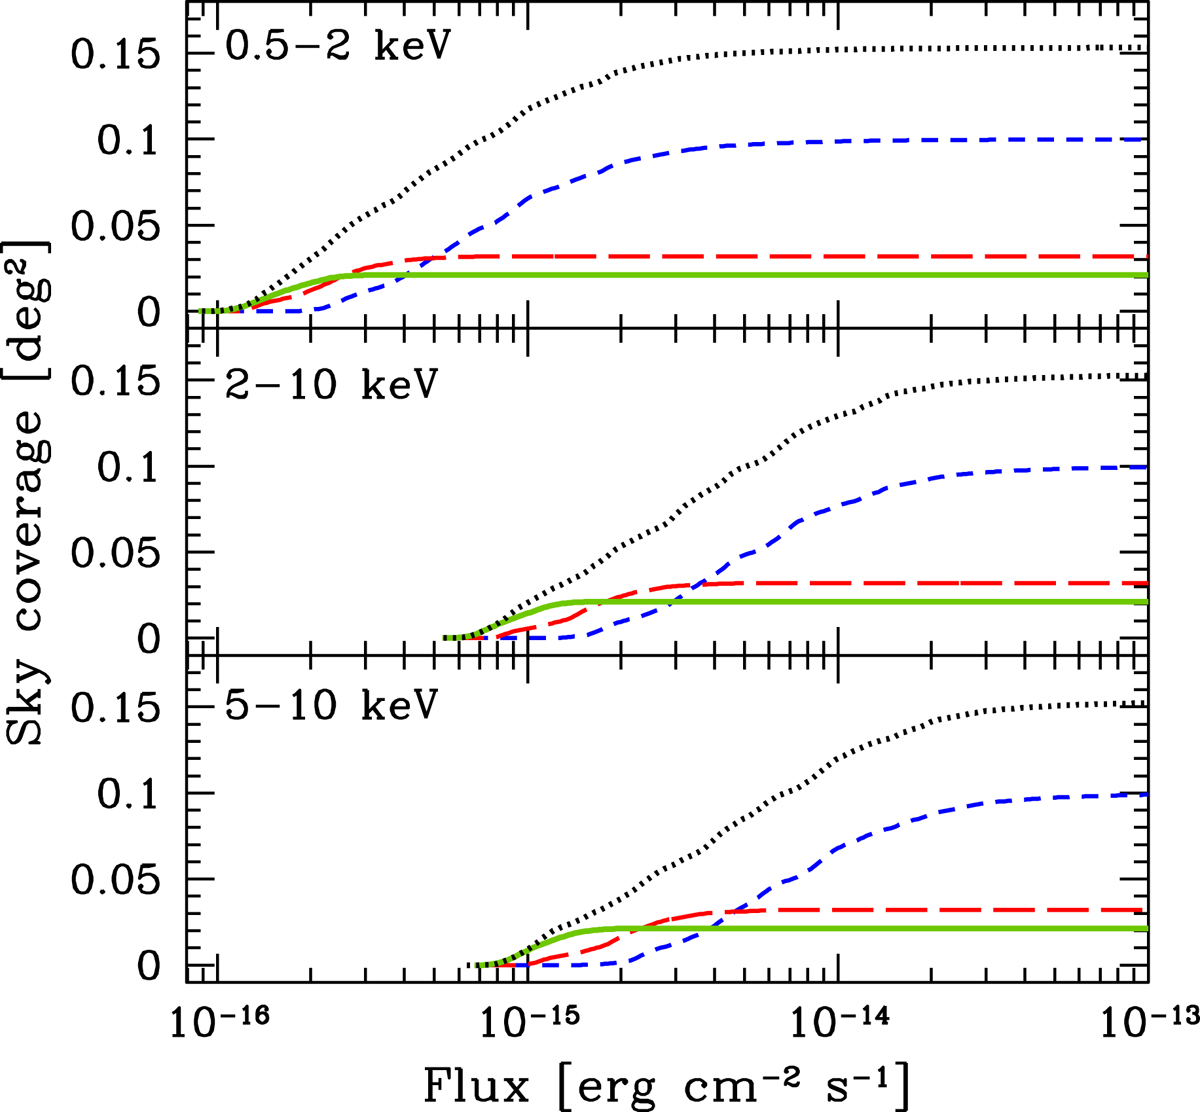
From top to bottom: sky coverage calculated as in Sect. 4.1 in the S, H, and HH energy bands, excluding the area with the strongest ICM emission (black dotted lines, see also Fig. 1) and the A (green solid lines), B (red long dashed lines), and C (blue short dashed lines) regions (see Fig. 1 and Sect. 4.1).
Current usage metrics show cumulative count of Article Views (full-text article views including HTML views, PDF and ePub downloads, according to the available data) and Abstracts Views on Vision4Press platform.
Data correspond to usage on the plateform after 2015. The current usage metrics is available 48-96 hours after online publication and is updated daily on week days.
Initial download of the metrics may take a while.