| Issue |
A&A
Volume 629, September 2019
|
|
|---|---|---|
| Article Number | A57 | |
| Number of page(s) | 23 | |
| Section | Extragalactic astronomy | |
| DOI | https://doi.org/10.1051/0004-6361/201834972 | |
| Published online | 05 September 2019 | |
The extraplanar type II supernova ASASSN-14jb in the nearby edge-on galaxy ESO 467-G051⋆
1
Instituto de Astrofísica, Pontificia Universidad Católica de Chile, Av. Vicuña Mackenna 4860, 782-0436 Macul, Santiago, Chile
e-mail: This email address is being protected from spambots. You need JavaScript enabled to view it.
2
Núcleo de Astronomía de la Facultad de Ingeniería y Ciencias, Universidad Diego Portales, Av. Ejército 441, Santiago, Chile
3
Millennium Institute of Astrophysics, Santiago, Chile
4
PITT PACC, Department of Physics and Astronomy, University of Pittsburgh, Pittsburgh, PA 15260, USA
5
European Southern Observatory, Alonso de Córdova 3107, Casilla 19, Santiago, Chile
6
Harvard-Smithsonian Center for Astrophysics, 60 Garden St., Cambridge, MA 02138, USA
7
Department of Astronomy, The Ohio State University, 140 West 18th Avenue, Columbus, OH 43210, USA
8
Center for Cosmology and AstroParticle Physics (CCAPP), The Ohio State University, 191 W. Woodruff Avenue, Columbus, OH 43210, USA
9
Tuorla Observatory, Department of Physics and Astronomy, University of Turku, Väisäläntie 20, 21500 Piikkiö, Finland
10
Instituto de Astronomía, Universidad Nacional Autónoma de Mexico, A. P. 70-264, 04510 México, D.F., Mexico
11
Coral Towers Observatory, 4870 Cairns, Queensland, Australia
12
The Observatories of the Carnegie Institution for Science, 813 Santa Barbara Street, Pasadena, CA 91101, USA
13
Institute for Astronomy, University of Hawai’i, 2680 Woodlawn Drive, Honolulu, HI 96822, USA
Received:
23
December
2018
Accepted:
19
July
2019
Abstract
We present optical photometry and spectroscopy of the Type II supernova ASASSN-14jb, together with Very Large Telescope (VLT) Multi Unit Spectroscopic Explorer (MUSE) integral field observations of its host galaxy and a nebular-phase spectrum. This supernova, in the nearby galaxy ESO 467-G051 (z = 0.006), was discovered and followed-up by the all-sky automated survey for supernovae (ASAS-SN). We obtained well-sampled las cumbres network (LCOGTN) BVgri and Swift w2m1w1ubv optical, near-UV/optical light curves, and several optical spectra in the early photospheric phases. The transient ASASSN-14jb exploded ∼2 kpc above the star-forming disk of ESO 467-G051, an edge-on disk galaxy. The large projected distance from the disk of the supernova position and the non-detection of any H II region in a 1.4 kpc radius in projection are in conflict with the standard environment of core-collapse supernova progenitors and suggests the possible scenario that the progenitor received a kick in a binary interaction. We present analysis of the optical light curves and spectra, from which we derived a distance of 25 ± 2 Mpc using state-of-the-art empirical methods for Type II SNe, physical properties of the SN explosion (56Ni mass, explosion energy, and ejected mass), and properties of the progenitor; namely the progenitor radius, mass, and metallicity. Our analysis yields a 56Ni mass of 0.0210 ± 0.0025 M⊙, an explosion energy of ≈0.25 × 1051 ergs, and an ejected mass of ≈6 M⊙. We also constrained the progenitor radius to be R* = 580 ± 28 R⊙ which seems to be consistent with the sub-Solar metallicity of 0.3 ± 0.1 Z⊙ derived from the supernova Fe II λ5018 line. The nebular spectrum constrains strongly the progenitor mass to be in the range 10–12 M⊙. From the Spitzer data archive we detect ASASSN-14jb ≈330 days past explosion and we derived a total dust mass of 10−4 M⊙ from the 3.6 μm and 4.5 μm photometry. Using the FUV, NUV, BVgri,Ks, 3.6 μm, and 4.5 μm total magnitudes for the host galaxy, we fit stellar population synthesis models, which give an estimate of M* ≈ 1 × 10⁹ M⊙, an age of 3.2 Gyr, and a SFR ≈0.07 M⊙ yr−1. We also discuss the low oxygen abundance of the host galaxy derived from the MUSE data, having an average of 12 + log(O/H) = 8.27+0.16−0.20 using the O3N2 diagnostic with strong line methods. We compared it with the supernova spectra, which is also consistent with a sub-Solar metallicity progenitor. Following recent observations of extraplanar H II regions in nearby edge-on galaxies, we derived the metallicity offset from the disk, being positive, but consistent with zero at 2σ, suggesting enrichment from disk outflows. We finally discuss the possible scenarios for the unusual environment for ASASSN-14jb and conclude that either the in-situ star formation or runaway scenario would imply a low-mass progenitor, agreeing with our estimate from the supernova nebular spectrum. Regardless of the true origin of ASASSN-14jb, we show that the detailed study of the environment roughly agree with the stronger constraints from the observation of the transient.
Key words: supernovae: individual: ASASSN-14jb / galaxies: individual: ESO 467-G051 / HII regions / galaxies: abundances / supernovae: general / galaxies: distances and redshifts
Reduced spectra and lightcurves are only available at the CDS via anonymous ftp to cdsarc.u-strasbg.fr (130.79.128.5) or via http://cdsarc.u-strasbg.fr/viz-bin/qcat?J/A+A/629/A57
© ESO 2019
1. Introduction
Originally classified based on the absence (Type I) or presence (Type II) of hydrogen lines in their optical spectra (Minkowski 1941), supernovae (SNe) represent the explosive ending of a star. Decades of research have added a considerable degree of complexity to the simple scheme of Minkowski (see, e.g., Filippenko 1997 or Turatto et al. 2007). The great diversity of core-collapse supernovae (CCSNe) is understood as the result of a rich variety of parent systems. Initial differences in mass, radius, metallicity or rotation, and evolutionary differences in mass lost to stellar winds or interacting binary companions, results in a wide distribution of envelope masses when the progenitor stars reach the time of core collapse (e.g., Heger et al. 2003; Kasen & Woosley 2009; Dessart et al. 2013; Pejcha & Prieto 2015a). According to the chemical composition of the outer layers at the time of explosion, the spectroscopic signatures are of Type II, or Type IIb, Ib, or Ic with little or no presence of hydrogen. The latter are collectively called “stripped envelope SNe”. Finally, according to the total mass of hydrogen in the envelope, a bona fide Type II SN will show a slower or faster rate of decline after maximum and will be named “plateau” (IIP) or “linear” (IIL, Barbon et al. 1979). The convention has stuck although we know now that there is a continuous distribution of decline rates (e.g., Anderson et al. 2014a; Sanders et al. 2015; Pejcha & Prieto 2015b; Galbany et al. 2016a) and that Type IIP and IIL have similar progenitors (Valenti et al. 2015). Extreme mass loss shortly before explosion may lead to the formation of a dense circumstellar medium (CSM). The interaction of SN ejecta with the CSM would produce narrow emission lines of hydrogen and the SN is named Type IIn in these cases (e.g., Dopita et al. 1984; Schlegel 1990; Stathakis & Sadler 1991; Chugai 1994). Progenitors of type IIP SNe have been identified in pre-explosion images (Smartt et al. 2009; Smartt 2015) and found to be red supergiants (RSG) with zero age main sequence (ZAMS) masses between ∼8 and ∼17 M⊙. As CCSNe progenitors are massive stars with relatively short lifetimes of ∼4−50 Myr, it is expected that the SNe are still associated with their birth places, namely spiral arms or H II regions (Bartunov et al. 1994; McMillan & Ciardullo 1996; Aramyan et al. 2016), although CCSNe in early-type galaxies with residual star formation have been reported in the literature (Hakobyan et al. 2008). The correlation between CCSNe and star forming regions is expected to decrease toward the lower-mass progenitors and get diluted by progenitors resulting from binary evolution, which can result in longer timescales before explosion (Zapartas et al. 2017; Eldridge et al. 2017). Recent work has found that stripped envelope SNe are more closely associated with star forming regions than hydrogen rich SNe, as expected from the increasing progenitor mass of the sequence Ia → II → IIb/IIn → Ib/c (e.g., Anderson et al. 2012; Galbany et al. 2014).
Observations of the SN host metallicity, either global (Prieto et al. 2008; Arcavi et al. 2010) or local (Modjaz et al. 2008; Anderson et al. 2010; Stoll et al. 2013; Galbany et al. 2014; Kuncarayakti et al. 2018), and the spatial distribution of CCSNe (e.g., Van Dyk et al. 1999; Petrosian et al. 2005; Mikhailova et al. 2007; Kangas et al. 2017), also provide constrains on the different progenitors. Chemical abundance studies generally associate stripped envelope SNe with higher metallicity hosts as expected from the probable increase of mass loss with metallicity (e.g., Henry & Worthey 1999; Sánchez et al. 2014; Sánchez-Menguiano et al. 2016). Studies of the radial distribution of SNe find that Type Ib/c SNe are more centrally concentrated in their hosts (Anderson & James 2009; Hakobyan et al. 2009), which is again consistent with the higher metal enrichment toward the center of galaxies. And studies of the height distribution of SNe in edge-on disk galaxies (Hakobyan et al. 2017), find that CCSNe are nearly twice as much concentrated toward the disk than thermonuclear SNe, a result consistent with the height scale of the stellar populations where their progenitors are expected to originate.
Some CCSNe, however, defy the common sense implicit in this description by appearing far from any identifiable birthplace. One striking example is SN 2009ip located ∼5 kpc from NGC 7259, the nearest spiral galaxy (e.g., Fraser et al. 2013; Mauerhan et al. 2013; Pastorello et al. 2013; Prieto et al. 2013). SN 2009ip was first identified as a SNe impostor in 2009 three years before exploding as a Type IIn supernova (Smith et al. 2014). Late time HST data rules out the presence of star forming regions comparable to Carinae or the Orion Nebula (Smith et al. 2016) at the explosion site. The possibility that the progenitor was a runaway star is also rejected. The peculiar velocity of the SN is smaller than 400 km s−1 and the high mass of the progenitor implies a lifetime shorter than the travel time from the nearest star forming site located at a distance of ∼1.5 kpc.
This paper introduces another example of this sort, the Type IIP like supernova ASASSN-14jb in the edge-on disk galaxy ESO 467-G051 (Brimacombe et al. 2014; Challis 2014; Zhang & Wang 2014). The SN exploded 2.5 kpc from the center and 2.1 kpc above the galactic disk where no significant star forming region is detected. Also, it is interesting that ESO 467-G051 and NGC 7259, the host of SN 2009ip, form an interacting pair. The SNe are separated by 2.4′ in the sky (∼18 kpc).
We present here photometric and spectroscopic observations of ASASSN-14jb and Integral Field Spectroscopy (IFS) of its explosion site. We perform a thorough analysis to estimate physical parameters of the SN, the progenitor star, and the parent galaxy. The paper is organized as follows. In Sect. 2 we describe the photometric and spectroscopic observations. Section 3 contains our comparative analysis of the SN, including the photometric and spectroscopic evolution of the ASASSN-14jb. Section 4 contains the estimates of basic physical parameters of the SN, Sect. 5 includes the analysis of the host galaxy and its H II regions. Finally, Sect. 6 includes our discussion and Sect. 7 our conclusions.
2. Data
2.1. Discovery and explosion time
The supernova ASASSN-14jb (or SN 2014dq) was discovered on UT 2014-10-19.09 (MJD = 56949.09, Vdisc = 16.9 mag, Brimacombe et al. 2014) at RA = 22:23:16.12, Dec = −28:58:30.78 (J2000.0) by the ongoing All-Sky Automated Survey for SuperNovae (ASAS-SN; Shappee et al. 2014; Holoien et al. 2017a) from the Cassius 4-telescope unit at the Cerro Tololo Inter-American Observatory (CTIO), in Chile, hosted by the Las Cumbres Observatory (LCOGTN; Brown et al. 2013). It was spectroscopically classified as a young Type II on UT 2014-10-20 (Challis 2014; Zhang & Wang 2014). The last non-detection was on MJD = 56943.098 with a 3σ magnitude upper limit of V > 18.5 mag, 6 days before the time of discovery. We take the midpoint between this last non-detection and the discovery time, t0 = 56946.1 ± 3 (MJD), as the “explosion” time. The uncertainty is estimated as half the interval between the last non-detection and the discovery epoch.
2.2. Photometry
Optical photometric observations of ASASSN-14jb were obtained with the ASAS-SN unit “Cassius” at CTIO in the V-band and the LCOGTN 1 m telescopes at CTIO, the Siding Spring Observatory (SSO), the South African Astronomical Observatory (SAAO), and the McDonald Observatory (MDO) in the BV and the Sloan Digital Sky Survey (SDSS) gri filters. All the ASAS-SN images are processed in an automated pipeline using the ISIS image subtraction package (Alard & Lupton 1998; Alard 2000), with further details given in Shappee et al. (2014). Using the IRAF1apphot package, we performed aperture photometry on the subtracted images and then calibrated the results using the AAVSO Photometric All-Sky Survey (APASS; Henden et al. 2012). The ASAS-SN photometry is presented in Table 1.
ASAS-SN V-band photometry of ASASSN-14jb, including pre-discovery and post-plateau upper limits.
The fully reduced LCOGTN 1 m images (bias/overscan subtracted and flat-fielded) were retrieved from the LCOGTN data archive. We solved the astrometry of each CCD frame using the astrometry.net software package (Lang et al. 2010). We obtained calibrated BVgri magnitudes for local standard stars in the field from the APASS catalog. In Fig. 1 we display one of the LCOGT images showing the position of the SN, the local standards, and the nearby SN 2009ip. The data of the local standard sequence is given in Table 2. ASASSN-14jb was recorded with high signal-to-noise ratio (S/N) in the images of LCOGTN. This, together with the negligible background from the host galaxy at the SN site, prompted us to measure the SN flux using aperture photometry. The procedure is explained in detail in Appendix A.
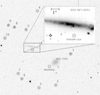 |
Fig. 1. r-band image of the field of ASASSN-14jb from LCOGTN. The circles show the position of ASASSN-14jb, the local photometric standards (numbered 1–10), and the nearby SN 2009ip in NGC 7259. The zoom around the position of ASASSN-14jb and its host galaxy, ESO 467-G051, is a synthetic r-band image obtained from the MUSE datacube. The MUSE image field of view is of 1.5 × 1.0 arcmin. |
BVgri magnitudes of the local APASS standard star sequence used.
As our observations extended only ∼80 days after explosion, we searched for public images of the field which could have recorded ASASSN-14jb at later times. We found some images in the european southern observatory (ESO) archive2. We retrieved ESO/NTT EFOSC images in BV filters that contained ASASSN-14jb’s explosion site at three different epochs during 2015, obtained by the public ESO spectroscopic survey of transient objects (PESSTO; Smartt et al. 2015, ESO program ID 191.D-0935). The CCD frames were overscan subtracted and flat-fielded with calibration frames obtained the same day using standard IRAF routines. Since the SN is fainter in these late-time images, we measured the SN brightness using PSF fitting photometry as implemented in IRAF DAOPHOT package. We calibrated the magnitudes using local standards from Pastorello et al. (2013). The early LCOGTN and late ESO/NTT photometry are presented in Table 3.
LCOGT BVgri and NTT/EFOSC BV photometry of ASASSN-14jb.
We supplemented our ground-based optical photometry with data from the Swift and Spitzer space-born observatories. Repeated optical and near-UV observations of ASASSN-14jb were obtained by Swift/UVOT in the passbands w2,m1 w1,u,b,v during the first ∼30 days after explosion. We retrieved them from the Swift Optical/Ultraviolet Supernova Archive (SOUSA; Brown et al. 2014). Also, the field of ASASSN-14jb and its host have been observed nine times since 2010 in the 3.6 μm and 4.5 μm bands by the Spitzer IRAC instrument (Fazio et al. 2004). The observations obtained on 2015-09-13 (program ID 11053) and 2016-08-17 (program ID 12099) were taken when the SN was ∼330 and ∼670 days past explosion, respectively. We retrieved these images from the data archive3 and also images taken on 2014-09-05 (program ID 10139) to use as templates for image subtraction. We used HOTPANTS (Becker 2015) for difference imaging and measured aperture photometry on the difference images. The SN is detected on 2015-09-13 and undetected on 2016-08-17.
Our near-UV and optical photometry is displayed in Figs. 2 and 3. The first shows the near-UV and optical light curves for the first ∼80 days after explosion, and the second the complete light curves in B and V bands. The Spitzer mid-infrared photometry is discussed in Sect. 4.5.
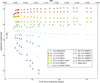 |
Fig. 2. ASAS-SN V, LCOGTN BVgri, and Swift/UVOT w2, m1, w1, ubv, light curves of ASASSN-14jb. Each band has been shifted to the value showed in the label for presentation purposes. The observed time is given in days since the estimated explosion epoch t0 = 56946.1 (MJD) in the bottom x-axis and in MJD in the top axis. The black squares are the non-detection derived from the ASAS-SN V-band images. |
 |
Fig. 3. B and V photometry from Fig. 2, combined with the EFOSC late time photometry. The 56Co → 56Fe decay slope is also showed. |
2.3. Spectroscopy
A total of ten single-slit, low-resolution optical spectra of ASASSN-14jb were obtained with the FAST spectrograph (Fabricant et al. 1998) mounted on the Fred L. Whipple Observatory Tillinghast 1.5 m telescope (3500−7400 Å, R ∼ 1700) and with the Inamori-Magellan Areal Camera and Spectrograph (IMACS; Dressler et al. 2011) mounted on the Magellan Baade 6.5m telescope at Las Campanas Observatory (3800−9800 Å, R ∼ 1000). The CCD images were reduced and the 1D spectra were extracted and calibrated using standard routines in the IRAF packages ccdproc and onedspec, respectively. The epochs of the ten spectra obtained in the photospheric phase are presented in Table 4. A montage of the spectra obtained in the photospheric phase is shown in Fig. 4.
Log of spectroscopic observations of ASASSN-14jb.
 |
Fig. 4. Full rest frame spectroscopic time series, on a logarithmic scale, for ASASSN-14jb in the photospheric phase (up to 80 days past explosion). The time next to each spectrum, in days, is measured since the estimated time of explosion t0 = 56946.1 ± 3 (MJD). The vertical lines show the wavelengths of the some of the main features in the spectra of type II SNe. Lines with the ⨁ symbol represent the position of strong telluric absorptions. |
We also observed the field of ASASSN-14jb as part of the All-weather MUse Supernova Integral field Nearby Galaxies program (AMUSING; Galbany et al. 2016b) with the Multi Unit Spectroscopic Explorer (MUSE, Bacon et al. 2010) on ESO’s Very Large Telescope UT4 (Yepun). MUSE is a state-of-the-art integral field spectrograph with a field of view of 1 arcmin2 and  spaxels. It covers the spectral range 4800−9300 Å with a resolving power R ≃ 1800−3000. Our MUSE data were obtained on 2015-11-14 and consisted of two different pointings of four dithered exposures each with an integration time of 698 s. The sky conditions were clear, and we measured a full-with-half-maximum for the stellar point-spread function of 1
 08 at 6600 Å. We reduced the MUSE spectroscopy with version 1.2.1 of the pipeline provided by ESO (Weilbacher et al. 2014), but also checked and corrected the astrometric zeropoint using LCOGTN images (for further details on MUSE data reduction see Prieto et al. 2016).
Although the MUSE observations were obtained ∼394 days after explosion (see Table 4) when ASASSN-14jb was faint, the quality and depth of the exposures allow us to easily detect the SN and extract a nebular phase spectrum. We used a circular aperture with a radius of  to extract the spectrum at the position of the SN with QFitsView4. To take care of any offset in the flux scale we estimated the V magnitude of the SN at the time of the spectrum from the late time light curve (V = 21.51) and compared it with the synthetic V-band magnitude obtained from the nebular spectrum (V = 21.86). We then applied an offset of 0.35 mag (factor of 1.38 in flux) to obtain an approximate absolute flux calibration. We also checked the wavelengths of the main sky emission lines at the position of the SN and found a small, but systematic offset of ≈ − 30 km s−1. We correct for this offset when discussing the velocity offset between the SN emission lines and the host (Sect. 3.4). The nebular spectrum of ASASSN-14jb is displayed in Fig. 11.
3. Comparative analysis
To put ASASSN-14jb in context we assembled a comparison sample representative of the wide range of properties of Type II SNe. These include the luminous Type IIP SN 2007pk (Inserra et al. 2013), normal Type IIP like SN 1999em (e.g., Hamuy et al. 2001), and the subluminous Type II SN 2005cs (e.g., Pastorello et al. 2009). We chose objects with data in the public domain, good coverage of the photospheric phase, ideally including gri photometry (8 SNe), and optical nebular spectra at ∼400 days after explosion (6 SNe). Further details of the comparison set are given in Table 5.
Relevant information of the SN II in the literature used for comparison with ASASSN-14jb.
Estimates of the distance and total foreground reddening are needed in order to compare ASASSN-14jb with the rest. We use a distance modulus of μ = 32.0 mag, to be justified below. We estimate extinction by dust in the Galaxy using the maps of Schlafly & Finkbeiner (2011). Taking the average in a circle with 5 arcminutes of diameter centered on the SN position we obtain E(B − V) = 0.0154 ± 0.001 mag. Extinction by foreground dust in the host galaxy is expected to be low, as the SN exploded at a significant distance from the host galaxy disk. Consistent with this, the narrow Na I D doublet at the host galaxy redshift are not detected in our spectra, which is a clear sign of low reddening (Phillips et al. 2013). In addition, the MUSE data to be discussed below shows no significant star forming region near the explosion site. We conclude, hence, that ASASSN-14jb is affected only by Galactic extinction. Assuming a standard reddening law with a ratio of total to selective absorption RV = 3.1, we estimate AV = 0.05 mag.
3.1. Photometric evolution
Figure 5 shows the absolute V-band light curve of ASASSN-14jb together with those of the comparison set. The peak at MV, max = −16.04 ± 0.18 mag is within the usual range of Type IIP SNe, although lower than the average MV, max = −16.71 ± 1.01 mag in the sample of Type II SNe of Anderson et al. (2014a; from now onward A14). The supernova ASASSN-14jb is dimmer than the classic, well-studied Type II-SN 1999em by 0.80 ± 0.18 mag, but it shows a similar behavior in its V-band plateau (Hamuy et al. 2001; Leonard et al. 2002a). Up to ∼80 days since explosion the photometry shows the behavior typical of Type IIP like SNe.
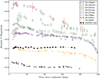 |
Fig. 5. Absolute V-band magnitude evolution for ASASSN-14jb (black filled stars) and the comparison sample of Type II SNe as a function of days after their estimated time of explosion. See Table 5 for the references for each SNe, including the adopted distance and reddening. |
The measured slope of the plateau (35−70 days after explosion) in the V-band for ASASSN-14jb is s2, V = −0.15 ± 0.02 mag per 100 days, lower than the average V-band plateau slope in the A14 sample (1.27 ± 0.93 mag per 100 days). The slow increase in brightness of the plateau is consistent with the correlation between plateau slope and absolute V-band magnitude found by A14 and later work (e.g., Valenti et al. 2016). It is also an effect seen in bolometric light curves of CCSNe models resulting from the explosion of low mass progenitors (Sukhbold et al. 2016).
In Figs. 6 and 7 we present the extinction corrected color evolution of ASASSN-14jb and the comparison set. The (B − V)0 color of ASASSN-14jb is bluer than average at 50 days after explosion, being comparable only to LSQ 13fn (Polshaw et al. 2016) and SN 2007pk (Inserra et al. 2013) at 80 days after explosion. The change in color from the onset of the plateau up to 80 days is Δ(B − V) = 0.20 ± 0.04 mag, which is low compared to comparison sample. The color evolution of ASASSN-14jb in (g − r)0, (g − i)0 and (r − i)0 also indicates a comparatively bluer continuum, except in the (V − i)0 color. This behavior may be due to a true difference in the temperature evolution or it may be an effect of lower line-blanketing in the blue part of the spectrum, resulting from low-metallicity of the progenitor. The similarity in the color evolution of ASASSN-14jb and LSQ 13fn, a Type II SN that probably comes from a low-metallicity progenitor (Polshaw et al. 2016), might suggest that a similar physical mechanism is at play.
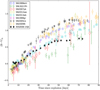 |
Fig. 6. Extinction corrected B − V colors for ASASSN-14jb (black filled stars) and the comparison sample of Type II SNe. The reddening values used are given in Table 5. |
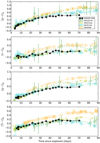 |
Fig. 7. Extinction corrected V − i, g − i, r − i and g − r colors for ASASSN-14jb (black filled stars) and the Type II SNe comparison sample. The reddening values used are given in Table 5. |
3.2. Spectroscopic evolution in the plateau phase
As shown in Fig. 4, the spectral evolution of ASASSN-14jb resembles the evolution of other hydrogen-rich Type II SNe. At very early times the ejecta are optically thick and the spectra show a hot blue continuum with relatively weak, but broad, Balmer lines without P-Cygni absorption troughs. In the first spectrum at ∼4 days after explosion, we detect broad Balmer lines in emission and the high ionization He II λ4686 line. The FWHM of the Balmer lines and the He II lines in this earliest spectrum are ∼11 000−13 000 km s−1 and ∼8000 km s−1, respectively, and all the emission peaks are clearly blueshifted by ∼2000−4000 km s−1. The strength of the He II line decreases substantially in the spectrum obtained a day later, at 5 days after explosion, and the Balmer lines start to develop P-Cygni profiles. We also detect the He I λ5875 line in the early spectra. At 6 days after explosion, the He II line has weakened further and it is undetected in the spectrum obtained at 7 days after explosion.
At phases later than ≳30 days, the ejecta cools and the hydrogen lines develop strong P-Cygni profiles. The blueshift of the peak of the Balmer lines decreases to ∼1000 km s−1. This is a common feature in Type II SNe during the photospheric epochs and it has been attributed to the shallow density profile of the ejecta compared to a typical stellar wind (Dessart & Hillier 2005a; Anderson et al. 2014b). Lines from transitions in metals such as Fe II, Sc II, and Ti II also start to appear and significantly contribute to line blanketing. The Na I D doublet at λλ5890, 5896 appears now in the wavelength range where He I λ5875 was detected at early times. Comparison of the photospheric phase spectra of ASASSN-14jb with those of the comparison sample at ∼60 days past explosion (see Fig. 8) shows that the absorption features of the former in the range 5300−6300 Å are relatively weak.
In Fig. 9 we present the time evolution of the Hα, Hβ and Fe II λ5169 lines. The last two spectra we obtained in the plateau phase, at 64 and 80 days after explosion, show clear absorption features on the blue side of both the Hα and Hβ main absorption troughs. These high velocity (HV) features are at ∼7000 km s−1, while the main absorption features are at ∼4000 km s−1. The HV absorption lines cannot be explained by Si II λ6355 or Ba II absorption features and have been observed in 59% of the Type II SNe studied by Gutiérrez et al. (2017a).
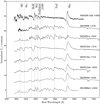 |
Fig. 8. Comparison of rest-frame photospheric phase spectra at ≈60 days after explosion. The spectra are not corrected for extinction. |
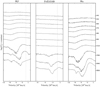 |
Fig. 9. Evolution of the Hβ (left), Fe II λ5169 (middle) and Hα (right) line profiles, in velocity space, as a function of time after explosion t0 = 56946.1 ± 3 (MJD), in the plateau phase for ASASSN-14jb (up to 80 days past explosion). In each panel, a vertical dashed line indicates zero velocity. |
3.3. Expansion velocities
The ejecta of the Type II SNe achieve near homologous expansion after a few days (Bersten et al. 2011) and at early times the hydrogen atmosphere is opaque and the line forming region is in the outer layers at high velocities. As the temperature drops, the opacity decreases and the photosphere recedes in mass (Lagrangian) coordinate, and appears at lower velocities. The photosphere is tightly bound to the opacity drop caused by hydrogen recombination (Bersten et al. 2011). In practice one estimates the photospheric velocity by measuring the blueshift of maximum absorption for a specific P-Cygni profile. This can over or under estimate the true photospheric velocity (Dessart & Hillier 2005b, 2010; Takáts & Vinkó 2012). Other methods used are the cross-correlation with library spectra, the comparison with detailed NLTE codes like CMFGEN or PHOENIX (Dessart & Hillier 2005c; Baron et al. 2005) or comparison with more simplified, parametrized LTE spectral modeling (e.g., SYNOW, Takáts & Vinkó 2012).
The expansion velocity measured from optical spectra is an important physical parameter directly related to the explosion energy and the plateau luminosity. These are also fundamental for distance measurements (Hamuy & Pinto 2002). Strong Balmer lines and Fe II lines velocities were measured in our spectra. The spectra were first normalized to a global continuum fitting a black body or a local power law. Then, when possible, low degree polynomials were fit to the P-Cygni profile absorptions and the minimum was taken as a proxy for the expansion velocity. We did not applied corrections for reddening or peculiar velocities. Details of the P-Cygni profile fitting are in Appendix B. In Fig. 10 we show the expansion velocities of ASASSN-14jb together with those of the comparison set. For LSQ 13fn we only present the velocities after 30 days due to the low signal to noise of the spectra. The velocities of SN 2013ab are directly taken from Bose et al. (2015). The measured velocities are also collected in Table 6 together with the average velocity of our comparison set and those of Gutiérrez et al. (2017b).
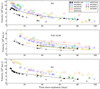 |
Fig. 10. Expansion velocities of the Hβ (top), Fe II λ5169 (middle), and Hα (bottom) lines as a function of time after explosion in the plateau phase, measured from the P-cygni profile minima of the Balmer lines Hα, Hβ and the Fe II λ5169 line for ASASSN-14jb (black filled stars) and the Type II SNe comparison sample. |
P-Cygni absorption velocities for ASASSN-14jb.
To compare with well known correlations (Hamuy 2003; Faran et al. 2014), we interpolated the velocities of our sample to 50 days after explosion using a Monte–Carlo approach. For each SN we generated a re-sampling of each velocity using the measured errors and following a nonlinear least squares procedure, using the curve fit function from the NumPy library, we fit a power law model each time. For this procedure we select only velocities after 20 days, as early velocities do not follow the same decay rate as in the plateau. We then take the average and standard deviation of the re-samplings as the 50 days velocity and error, respectively. For all the lines measured the velocities for ASASSN-14jb are slightly under average. The Fe II λ5169 velocity interpolated at 50 days is measured to be 2774 ± 69 km s−1, while the average of our sample is 3442 km s−1, with a sample dispersion of 977 km s−1. Our sample average velocity is in agreement with the value obtained with a larger sample in Gutiérrez et al. (2017b), of 3537 ± 851 km s−1 at 53 days after explosion. The photospheric velocities inferred are in agreement with the velocity-luminosity correlations (see Sect. 3.2 above).
As is common in Type II SNe distance measurements (Hamuy & Pinto 2002; de Jaeger et al. 2017), we fit a power law to interpolate the velocities. The Fe II λ5169 logarithmic decay (which does not depend on the choice of units5) presents an average of −0.55 ± 0.16 in our sample, compared to the value obtained for ASASSN-14jb, of −0.62 ± 1.80. We observe a strong anti-correlation between the velocity decay slope and the V-band absolute magnitude at 50 days. This is expected as there is an internal correlation between both parameters of the power law (de Jaeger et al. 2017) and the velocity scale correlates with the luminosity (Hamuy & Pinto 2002).
In conclusion, ASASSN-14jb presents expansion velocities consistent, both from the scale and velocity decay, with below average luminosity Type II SNe.
3.4. Nebular spectrum
The nebular spectrum of ASASSN-14jb is shown in Fig. 11 together with a sample of Type II SNe. It shows the typical emission lines of Type IIP like SNe at nebular phases: Hα, [Ca II] λλ7291, 7324, [O I] λλ6300, 6364, Ca II λλλ8498, 8542, 8662, [Fe II] λλ7155, 7172, with a boxy profile, Na I λλ5890, 5896 and [O I] λ5577, in order of observed intensity (Silverman et al. 2017). Also, a strong [C I] λ8727 line is present, which has been detected in other Type IIP like SNe such as SN 2004dj (Silverman et al. 2017). A weak He I line at λ7065 is observed, but with no He I counterpart at λ6678. The clear separation observed in different multiplets like [O I], [Ca II] and Ca II + [C I] is a sign of a low explosion energy for ASASSN-14jb.
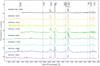 |
Fig. 11. Comparison of nebular spectra of observed Type II SNe at ≈400 days past explosion. |
The blueshift with respect to the host galaxy of ∼170 km s−1 observed (∼200 km s−1 minus the ∼30 km s−1 offset detected using the sky lines) in the peaks of the strongest lines is particularly interesting. It cannot be caused by the same physical effect as in the plateau because in this optically-thin phase the outer density profile is less relevant to the emission (Anderson et al. 2014b). It is also significantly larger than the maximal HI rotational velocity of the host galaxy of ∼60 km s−1 (see Sect. 5.1). Other hypotheses to explain this blueshift may be: (1) a shift in velocity relative to the host due to dynamical effects or an intrinsically high-velocity of the progenitor star; (2) dust production; (3) Some lines are still optically thick at 400 days past explosion; or (4) an asymmetry in the explosion itself. Notable is the asymmetry observed in Hα (see Figs. 16 and 17 for a close-up on Hα + [O I]) which is not as clearly observed in other lines, besides a small apparent skewness in the line profiles. This kind of asymmetry is also seen in the nebular spectra of other Type IIP like SNe (Elmhamdi et al. 2003; Chugai et al. 2005; Utrobin & Chugai 2009).
4. Distance and physical parameters of ASSASN-14jb
Progenitors of Type IIP like SNe have been constrained by pre-explosion images to be RSGs with ZAMS masses of ≈8−17 M⊙ (Smartt et al. 2009; Smartt 2015). The discrepancy between these initial mass constraints and the predictions from evolutionary codes (Heger et al. 2003; Ekström et al. 2012) has been called the “RSG problem”. The data set we have compiled allow us to constrain the basic physical parameters of the progenitor of ASSASN-14jb, compare them with the expected values for SN Type IIP like progenitors, and contribute to this discussion. But doing so requires a good estimate of the distance to the SN.
4.1. Distance
We measured the distance toward ASSASN-14jb using some of the most recent empirical methods: the Photospheric Magnitude Method (Rodríguez et al. 2014), the Standard Candle Method (Hamuy & Pinto 2002), and the Photometric Color Method, (de Jaeger et al. 2017). Further details of our hypothesis and calculations are given in Appendix C.
The three different estimates of distance are shown in Fig. 12. They are consistent with each other within each method’s intrinsic dispersion. They are also consistent with the distance obtained from the Virgo-inflow corrected recession velocity of the host galaxy and the Hubble law, assuming H0 = 68 km s−1 Mpc−1. Given this, we simply take as the final distance the weighted average, considering the statistical errors only, of μ = 32.00 ± 0.18 mag (D = 25.1 Mpc).
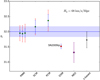 |
Fig. 12. Distance modulus estimates for ASASSN-14jb using PMM, SCM, and PCM methods (green dots). The black triangle is the distance modulus from the host galaxy redshift and a Hubble law with H0 = 68 km s−1 Mpc−1, with a dispersion of 200 km s−1 as a reference error for the CMB frame redshift. The purple diamond is the average from the Tully-Fisher measurements obtained from the NED database, all normalized to H0 = 68 km s−1 Mpc−1. The thick blue line is the adopted distance modulus in this work, μ = 32.00 ± 0.18, obtained as the weighted average of the PMM, SCM and PCM methods and the standard deviation is showed as a blue fill. We also show as a reference the distance measured to SN 2009ip in NGC 7259 as a red square with its corresponding error (Potashov et al. 2013). |
4.2. Temperature evolution and the progenitor radius
The early emission, a few days after explosion, for a Type II SN comes from the adiabatic cooling of the outer envelope and depends mainly on the pre-supernova radius (Rabinak & Waxman 2011; Sapir & Waxman 2017). Observationally, the pre-supernova radius has been constrained from early UV and optical photometry, using semi-analytic models (Rabinak & Waxman 2011; Nakar & Sari 2010), on individual Type II SNe (Gezari et al. 2010; Valenti et al. 2014; Bose et al. 2015; Huang et al. 2016, 2018; Tartaglia et al. 2018), and on larger samples to make statistical studies (González-Gaitán et al. 2015; Gall et al. 2015; Rubin et al. 2016).
We build the spectral energy distribution (SED) for ASASSN-14jb at early times, from ∼4 to 26 days after explosion to derive an estimate of the progenitor radius. Using the Swift/UVOT near-UV and optical photometry, we build the SED of ASASSN-14jb at each epoch, after correcting for extinction assuming an standard Galactic extinction law with total to selective extinction ratio RV = 3.1 (Cardelli et al. 1989). We fit a blackbody function to the SED and obtain the photospheric temperature and radius evolution, assuming the distance to the host galaxy obtained in Sect. 4.1.
The results are presented in Fig. 13. The observed photospheric temperatures are in the range 5−21 × 103 K and the radii are in the range 2−18 × 103 R⊙. We observe a change in the evolution ∼10 days after explosion. The observed temperature logarithmic decay increases from −0.726 ± 0.055 to −0.850 ± 0.019 and the photospheric radius growth rate increases from 0.890 ± 0.012 to 1.45 ± 0.06.
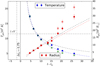 |
Fig. 13. Black-body temperature (blue dots) and radius evolution (red dots) as inferred from the SED of Swift data. The light blue and red squares show the temperature and radius evolution assuming a blackbody. The SED was corrected by a reddening value of E(B − V) = 0.0154 ± 0.001 mag and with RV = 3.1. The horizontal line indicates the kT = 1 eV level, where recombination is expected to become relevant afterwards. The vertical black solid line indicates the assumed explosion epoch at MJD 56946.1 ± 3 and the vertical dashed lines is at the assumed offset (Δt0 = −1.75) in the explosion epoch, for the optimal cooling model from RW11. The red dashed lines shows a power-law fit to the photospheric radii (only using the data points with kTph > 1eV) while the blues dashed lines shows the same for the Temperatures. The black curved dashed lines are the fits assuming the RW11 model for Tph and Rph. |
Rabinak & Waxman (2011, hereafter RW11), developed analytic expressions for the early evolution of the photospheric radius Rph and temperature Tph, expected to be valid before hydrogen recombination is significant. The expressions depend on progenitor properties at the time of explosion such as radius R*, opacity κ, and density profile. They also depend on the explosion energy E and ejecta mass Mej.
![Mathematical equation: $$ \begin{aligned} \frac{R_{\rm ph}}{[\mathrm{cm}]}&= 3.3 f_{\rho }^{-0.062} E_{51}^{0.41}M_{\rm ej}^{-0.31}\kappa _{0.34}^{0.093} t_5^{0.81} \times 10^{14} \end{aligned} $$](/articles/aa/full_html/2019/09/aa34972-18/aa34972-18-eq5.gif) (1)
(1)
![Mathematical equation: $$ \begin{aligned} \frac{T_{\rm ph}}{[\mathrm{eV}]}&= 1.6 f_{\rho }^{-0.037} E_{51}^{0.0027}M_{\rm ej}^{-0.054}R_{*,13}^{1/4}\kappa _{0.34}^{-0.28} t_5^{-0.45} \end{aligned} $$](/articles/aa/full_html/2019/09/aa34972-18/aa34972-18-eq6.gif) (2)
(2)
where 0.079 < fρ < 0.13 for RSGs, depends on the progenitor density profile, Mej is the ejected mass in solar masses, E51 is the explosion energy in units of 1051 erg, κ34 is the opacity normalized by 0.34, R*, 13 is the progenitor radius in units of 1013 cm and t5 is the time since shock breakout in units of 105 s.
It is well known that the emission from Type II SNe differs from a pure black body (Eastman et al. 1996; Dessart & Hillier 2005b). When the atmosphere is highly ionized, the electron scattering opacity dominates and the photon thermalization layer differs from the photosphere, the former being underneath at higher temperatures. Because of this the observed temperature (or color temperature Tc, as it is usually called) can differ significantly from the photospheric temperature Tph. RW11 estimate this departure with the parameter fT = Tcol/Tph. Following RW11 we take fT = 1.2 as a good approximation at early times in this work. This difference between Tcol and Tph, together with the increasing line blanketing and departures from the plane parallel atmosphere approximation, can make the observed SED significantly different from a black body. This effect can be corrected using a theoretically estimated dilution factor ζ, so that the emergent flux is defined as,
 (3)
(3)
where dL is the luminosity distance and Bλ(Tc) is the Planck function (Eastman et al. 1996; Dessart & Hillier 2005b). The dilution factor is in general wavelength dependent and directly affects the angular diameter distance estimate to a supernova. However, as we take the luminosity distance from empirical methods independent of Eq. (3), the dilution factor only affects the photospheric radius estimation and not the temperature. We note, however, that in the RW11 scheme  , which translates in a factor of 1/ζ ≈ 1.44 increase in the photospheric radius (see Eq. (38) in RW11). In our case we choose a representative value of ζλ = 0.5 for this high temperature regime, as obtained in Dessart & Hillier (2005b) and Pejcha & Prieto (2015b).
To test the effects of the deviations from a black body, we used a semi-empirical approach. We first selected the 15 M⊙ progenitor mass supernova explosion model from Dessart et al. (2013) that best fits the observed near-UV colors of ASASSN-14jb (named m15z8m8 in this case). Then, the best fit model was used as an information prior to the SED fitting at each epoch using,
 (4)
(4)
a model built from the weighted geometric mean of a black body and the normalized explosion model. The normalization ensures that the model’s intrinsic brightness does not affect the fit parameters. In principle, the weighting parameter w is unconstrained but to ensure a smooth correction and to not get biased by the model we fixed its value to be between 0.1−0.3 and selected the w parameter with the minimum residuals. As the model spectra is normalized, only it’s shape (color) is important when fitting the SN data. Figure 13 show our results for both approaches. We see that both temperature and radius evolution become smoother when including the models, probably because the hybrid approach accounts better for line blanketing. Since the available models start from ≈10 days past explosion, all the SEDs before that time were fit with a single black body. The derived slope in the temperature changes to −0.703 ± 0.017 after 10 days. The photospheric radius follows roughly a linear expansion with a logarithmic slope of 1.167 ± 0.068 during the same epochs.
We applied the RW11 models using the modified black body. We fit the temperature evolution assuming the fiducial values of E51 = 1, κ34 = 1, fρ = 0.1, and used only temperatures greater than ∼1 eV because RW11 inform that their models are more reliable in this range. The radius we obtain is 985 ± 49 R⊙. Noting the impact of the time since explosion in the result, we varied the shock-breakout (SBO) epoch and look for the one that minimizes the χ2 of the fit. We then obtain R = 580 ± 28 R⊙, for a SBO occurring 1.75 days earlier than our initial estimate (reduced χ2 = 3.62).
Inverting Eq. (2) is another form of understanding possible variations of R*:
![Mathematical equation: $$ \begin{aligned} R_* \approx 1.52 \times f_{\rho }^{0.148} \left[\frac{T_{\rm col}(t)}{(f_T/1.2)}\right]^4 t_5^{1.8} \times 10^{12}\,[\mathrm{cm}]. \end{aligned} $$](/articles/aa/full_html/2019/09/aa34972-18/aa34972-18-eq10.gif) (5)
(5)
where we take fT = 1.2 as before6.
The values obtained using Eq. (5) with early time observations are consistent with R* ≈ 400−1000 R⊙. As expected, the radius decreases as the actual decay of the photospheric temperatures is faster than the model, and the fT varies due to the changing opacity of the ejecta.
We choose as our best estimate of the progenitor radius, the RW11 fit with an SBO offset of −1.75 days, which gives an estimate of R* = 580 ± 28 R⊙. We note that the error quoted is the statistical error on the fitting of the observed data. This does not include systematics on chosen fixed parameters of the model (e.g., the dilution factor). This value is consistent with the color evolution of the mildly sub-solar (Z = 0.4 Z⊙) and compact (R* = 611 R⊙) RSG progenitor (m15z8m3) used in Dessart et al. (2013) which best fits ASASSN-14jb NUV colors. As the photospheric radius growth strongly depends on the explosion energy to ejecta mass ratio (Eq. (1)) we can estimate the ejecta mass as a function of the explosion energy. Fixing κ34 = 1,fρ = 0.1 as before we obtain  .
.
4.3. Bolometric light curve and the 56Ni mass
We constructed a bolometric light curve of ASASSN-14jb, by applying the semi-analytic bolometric corrections from Pejcha & Prieto (2015b) for the extinction corrected B − V colors. Figure 14 shows the result, together with the bolometric light curves of the comparison sample. The bolometric luminosity of ASSASN-14jb ∼50 days after explosion is log(L/L⊙) = 8.4 ± 0.18, which is under-luminous compared to SN 1999em, SN 2012aw or SN 2013ab.
The late-time bolometric light curve can be used to estimate the 56Ni and total masses ejected in the explosion. We assume a model of partial trapping of gamma rays (Clocchiatti & Wheeler 1997), where the energy released by Cobalt decay is scaled by the transparency factor I(t) = (1 − exp( − (T0/t)2)), and the characteristic time is given by  . We assumed a fixed density slope η = 10 and constant gamma-ray opacity κγ = 0.06 (which involves assuming an electron fraction per nucleon of Ye = 0.03). The late-time light curve and fit model are plotted in Fig. 15. The best fit gives T0 = 319 ± 33 days, which would correspond to an ejecta mass of 12 ± 1 M⊙ for an explosion energy of 1051 erg (1 foe). The 56Ni mass results 0.0210 ± 0.0025 M⊙, which is slightly lower than the median of 0.031 M⊙ corresponding to the Type II SNe sample studied by Müller et al. (2017). Finally, if we compare the tail B + V luminosity with SN 1987A (we assume the same bolometric correction for SN 1987A and ASASSN-14jb in this case) we obtain a nickel mass which is closely half than SN 1987A or 0.036 M⊙, assuming 0.071 M⊙ for SN 1987A (Seitenzahl et al. 2014). Late-time light curves that decay faster than Cobalt are expected in SNe with low mass ejecta, as in the case of stripped enveloped SNe and some fast declining Type II SNe (e.g., SN 2014G, SN 2013hj and ASASSN-15nx, Bose et al. 2016; Terreran et al. 2016; Bose et al. 2018). Given the low energetics shown in, for example, the expansion velocities, the ejected mass estimated above is consistent with the low mass range of Type IIP SNe progenitors.
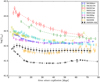 |
Fig. 14. Comparison of bolometric light curves using the bolometric corrections of Pejcha & Prieto (2015b). Each SN was corrected for extinction. See Table 5 for the references of the comparison sample. |
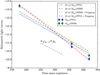 |
Fig. 15. Bolometric light curves in the radioactive tail derived from the B and V-band photometry from EFOSC imaging, using the bolometric corrections of Pejcha & Prieto (2015a; PP15, blue dots) and Bersten & Hamuy (2009; MH09, green squares). The decay is faster than the expected from full trapping of 56Co decay (showed as a dashed black line). The non-full trapping model from Clocchiatti & Wheeler (1997) gives a 56Ni Mass of 0.0210 ± 0.0025 M⊙ for the Pejcha & Prieto (2015a) bolometric corrections. The time scale for this fit is T0 = 319 ± 33 days, which corresponds to a ejecta mass of 12 M⊙ for an explosion energy of 1 foe. |
The ejected mass estimated with the late-time light curve can be compared with that obtained in the previous section using the early light curve. The scaling in this case is  which implies an “agreement” pair (Mej, Eexp) at (6 M⊙,0.25 foe).
Anderson et al. (2014b) discusses the observations of higher deviation from the expected full trapping decay for the brightest Type II SNe in their sample (in the V-band) and they suggest that this would be explained by the expected more diluted (i.e., less massive ejecta or more extended) hydrogen associated with faster declining SNe. In our case, the ejecta mass is slightly below what would be needed for a relatively low energy explosion of ≈0.25 foe to have a high gamma ray opacity (τγ = (T0/t)2 ≥ 1) at ≈400 days.
We can also estimate the ejected 56Ni mass using its correlation with the FWHM of Hα (Maguire et al. 2012). A value of FWHM ≃ 35 Å gives us a 56Ni mass of 0.0118 ± 0.0012 M⊙. This is lower by a factor of two than the late-time bolometric light curve estimate. The low nickel mass log(M56Ni) ≈ − 1.5 agrees with the explosion parameters according to the classic explosion models for Type II SNe (Popov 1993; Litvinova & Nadezhin 1985) and observed correlations (Hamuy 2003).
4.4. Nebular spectra and the progenitor mass
In the nebular phase, spectra of Type IIP like SNe show prominent Hα, O I, Ca II and Fe II emission lines. The [O I] λλ6300, 6364 emission can be used to estimate the Oxygen core mass and therefore the main sequence mass of the progenitor star (e.g., Uomoto 1986; Fransson & Chevalier 1989; Elmhamdi et al. 2003; Jerkstrand et al. 2012; Kuncarayakti et al. 2015). We compare our spectra with models from Dessart et al. (2013), Jerkstrand et al. (2014, 2018). Dessart et al. (2013, hereafter D13), in particular, presented radiative transfer models for Type II SNe using a grid of 15 M⊙ stellar models from MESA STAR, with varying mixing length, metallicity, and rotation. We choose the nebular spectra in their “m15” model, which reach up to 400 days past explosion (see Table 1 in D13 for details). Jerkstrand et al. (2014, hereafter J14), calculated models for 12, 15, 19 and 25 M⊙ stars evolved using the KEPLER code, assuming Solar metallicity and no rotation. We also included the recent model of 9 M⊙ from Jerkstrand et al. (2018, hereby J18).
In Figs. 16 and 17 we compare the data and the models for the [O I] λλ6300, 6364 and Hα lines. In the case of D13 models m15z2m2 and m15z8m3 provide the best fit. They correspond to a progenitor metallicities of Z = 0.02 and 0.008, oxygen masses of MO = 0.325 and 0.507 M⊙, and nickel masses of M(56Ni) = 0.05 and 0.081 M⊙, respectively (for details see Table 1 in D13). In the case of the J14 and J18 models the 9 M⊙ and 12 M⊙ are closest to the data, although all the models over-predict the Hα emission line. A problem with this direct comparison is that the explosion models presented in D13 and J14 produce higher 56Ni masses than the measured for ASASSN-14jb, while J18 model produces less. If the spectra are normalized by the Hα emission to approximately take care of this difference, the J14 model of 15 M⊙ and the 9 M⊙ model from J18 become closest to the data. On the other hand, the D13 models reveal a high degeneracy given their differences in stellar evolution.
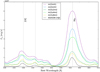 |
Fig. 16. Comparison of the nebular spectra of ASASSN-14jb with the NLTE models of Dessart et al. (2013) at ≈400 days past explosion. The vertical dashed lines shows the rest wavelength of Hα and the [O I] λλ6300, 6364 doublet. |
 |
Fig. 17. Comparison of the nebular spectra of ASASSN-14jb with the NLTE models of Jerkstrand et al. (2014, 2018) at ≈400 days past explosion. The vertical dashed lines shows the rest wavelength of Hα and the [O I] λλ6300, 6364 doublet. |
Other approach we can use to alleviate the impact in the spectra of the 56Ni mass discrepancy between ASASSN-14jb and the models, is to normalize the flux in a given line by the 56Ni decay power. Doing this for the [O I] λλ6300, 6364 line, we obtain a ratio of L6300, 6364/L56Ni ≈ 0.04. This leads to a surprising better consistency with the higher mass range of J14 models (15−19 M⊙), but again to a better fit of the 9 M⊙. According to Jerkstrand et al. (2018) this results both from the oxygen shell in the 9 M⊙ model lying closer to the 56Ni and a significant contribution of Fe I to the [O I] λλ6300, 6364 doublet.
As a final estimate we calculate an upper limit to the emitting oxygen mass using the analytic formula provided by J14,
![Mathematical equation: $$ \begin{aligned} \max (M_{\rm O\,I }) = \frac{L_{\rm [O\,I] }/\beta _{\rm [O\,I] }}{9.7\times {10^{41}}} \times {\exp \left(\frac{22720}{T}\right)}, \end{aligned} $$](/articles/aa/full_html/2019/09/aa34972-18/aa34972-18-eq14.gif) (6)
(6)
where L[O I] is the luminosity of the [O I]λλ6300, 6364 doublet in erg s−1, β[O I] is its Sobolev escape probability, and T the equilibrium temperature in K. A temperature in the range 3900–4300 K was estimated from the ratio between the lines [O I] λλ6300, 6364 and [O I] λ55777. The resulting values of max(MO I) fall in the range 0.09–0.18 M⊙, which is 20−40% above that of the 9 M⊙ model of J18 and 1.5–3 times lower than that of the 14 M⊙ model of J14.
We conclude that the nebular spectra confidently points at a low mass progenitor for CCSNe standards, in the range ∼10−12 M⊙. This is supported by surveys of theoretical explosions spanning a wide grid of progenitor properties (e.g., Sukhbold et al. 2016), which show that models above ∼12.5 M⊙ are much more efficient at producing oxygen than below that ZAMS mass.
4.5. Warm dust in the ejecta
ASASSN-14jb is clearly detected in the 2015-09-13 Spitzer images, with m3.6 = 17.85 ± 0.03 mag and m4.5 = 16.38 ± 0.03 mag (magnitudes in the AB system), but undetected on 2016-08-17. The implied absolute magnitudes (M3.6 ≃ −14.1, M4.5 ≃ −15.6) and red color (m3.6 − m4.5 ≃ 1.5 mag) at ∼333 days after explosion are consistent with warm dust formation in other Type II SNe (e.g., Prieto et al. 2012; Szalai et al. 2019). We used a black body function with dust emissivity Qλ ∝ λ−1 to fit the mid-infrared SED and found L ∼ 1.1 × 10⁶ L⊙, T ∼ 444 K, and R ∼ 839 AU. Using Eq. (1) in Prieto et al. (2009) (from Dwek et al. 1983), we obtain a total dust mass of Md ∼ 10−4 M⊙. These estimates are consistent with models of newly formed dust in the SN ejecta and observations for other Type II SNe at a similar epoch after explosion (e.g., Sarangi & Cherchneff 2015).
4.6. Progenitor metallicity
The pseudo-equivalent widths (pEWs) of the Fe II λ5018 line during the photospheric epoch of Type IIP SNe are a proxy for the progenitor metallicity. This has been shown both by models (D14) and correlation of observed pWEs with metallicities of H II regions in the host galaxies (Anderson et al. 2016). We measured the pEW evolution during the plateau phase of ASSASN-14jb and compare it with those of D13 models. The result is shown in Fig. 18. The models span four progenitor metallicities (2 Z⊙, 1 Z⊙, 0.4 Z⊙ and 0.1 Z⊙) and four different mixing-length scales for the Solar composition model, which greatly change the progenitor radius. We see that the observed pEWs of the Fe II line are most consistent with the curve for 0.4 Z⊙, but the Solar metallicity model for the progenitor with largest radius is also close enough. If we linearly interpolate the models and, assume that the dispersion given by different radii at Solar metallicity is a fair estimate of the uncertainty, we obtain Z = 0.3 ± 0.1 Z⊙ for ASASSN-14jb.
 |
Fig. 18. Measurements of the pseudo-equivalent width of the Fe II λ5018 line for ASASSN-14jb (black stars), with the correspondent epoch since explosion t0 = 56946.1 ± 3 (MJD). The solid lines show Dessart et al. (2013) models for progenitors with different metallicities and the dashed lines show models with Solar metallicity and different initial radii. |
5. The host galaxy of ASASSN-14jb
Statistical constrains on properties of the progenitor stars can be also establish through the study of the galactic environment of the SNe (e.g., Stoll et al. 2013; Anderson et al. 2015; Galbany et al. 2016c).
Relevant to our discussion are recent integral field spectroscopy observations (IFS) which have provided metallicities and ages of nearby stellar populations (Kuncarayakti et al. 2013, 2018; Galbany et al. 2016b, 2018).
Integrated magnitudes of the host galaxy of ASASSN-14jb, ESO 467-G051.
Of particular interest are the studies of H II regions, which rapidly fade away after the massive stars which provide the ionizing photons explode as SNe (e.g., Pols et al. 1998). Since typical lifetimes are up to a few tens of Myr they trace well the ongoing star formation. Typical sizes of giant H II regions are in the hundreds parsecs (Sánchez et al. 2012). Our MUSE observations of ASASSN-14jb were done with a seeing of 1 08 in the R-band, providing a resolution of ∼130 pc at the distance of the host.
We built 2D Hα emission maps of ESO 467-G051 from the MUSE datacube following the procedures of Galbany et al. (2016b). In brief, we fit the spectrum of each spaxel using a combination of the stellar continuum modeled with the stellar population synthesis code STARLIGHT (Cid Fernandes et al. 2009), with Gaussian profiles at the central wavelengths of the emission lines detected with S/N greater than 3, and we corrected the line ratios using the Galactic reddening map of Schlafly & Finkbeiner (2011) and an estimate of the internal extinction in ESO 467-G051 using the Balmer decrement. In addition, we used the H II-Explorer code (Sánchez et al. 2012) to detect and analyze H II regions in the datacube.
5.1. Overall properties of ESO 467-G051
The host galaxy of ASASSN-14jb, ESO 467-G051, is an edge-on, Scd galaxy (de Vaucouleurs et al. 1991). Our observations, together with extensive data in the literature, make it possible to measure integrated fluxes from the UV up to the IR. To do so, we (1) used co-added LCGOTN images with good seeing and measured the total BVgri magnitudes using a large elliptical aperture in ds9; (2) used a near-infrared Ks-band image of the field from the ESO data archive8 to measure the magnitude of the host within an elliptical aperture calibrated to 2MASS (Cutri et al. 2003) stars in the field; (3) obtained archival ultraviolet magnitudes from GALEX (Morrissey et al. 2007) and mid-infrared magnitudes from Spitzer’s S4G survey (Sheth et al. 2010). The integrated apparent magnitudes are presented in Table 7. Using our distance, the absolute magnitudes of ESO 467-G051, corrected by Galactic extinction, are MB ≈ − 17.6 mag, MV ≈ − 18.0 mag, and MKs ≈ − 19.1 mag. Figure 19 shows a histogram with the distribution of host galaxy MKs magnitudes of Type II SNe discovered by ASAS-SN in 2013–2017 from Holoien et al. (2017a,b,c, 2019). The host galaxy of ASASSN-14jb is in the lower Ks absolute magnitude (lower stellar mass) range of the Type II SNe discovered by ASAS-SN. The stellar mass, age and star formation rate (SFR) of ESO 467-G051 can be estimated from these data. We fit stellar population synthesis (SPS) models to the FUV, NUV, BVgri, Ks, 3.6 μm, and 4.5 μm magnitudes using FAST (Kriek et al. 2009). We assumed a Galactic extinction law, a Salpeter IMF, an exponentially declining star formation law (SFR ∝ e−t/τ, with τ = 1 Gyr), and the Bruzual & Charlot (2003) SPS models. The best-fit model provides the following parameters: M⋆ ≃ 1 × 10⁹ M⊙, age ≃ 3.2 Gyr, and SFR ≃ 0.07 M⊙ yr−1, where the uncertainties are 1σ. The SFR can be also estimated from the Hα extinction-corrected fluxes (see below, Kennicutt 1998), which provides SFR(Hα)∼0.07 M⊙ yr−1. This is fully consistent with the SED SPS fit.
Neutral hydrogen (HI 21 cm) observations suggest that the host galaxy of ASASSN-14jb is undergoing a direct encounter with 467-ESOG050 or NGC 7259, the host galaxy of SN 2009ip (ΔV = 92.6 ± 5.6 km s−1, Nordgren et al. 1997). The total HI flux is SHI = 23.1 ± 0.8 Jy km s−1 and the derived HI mass is MHI = (3.1 ± 0.8) [109 M⊙]9. Using our distance estimate (25 ± 2 Mpc) the HI mass scales to MHI = (3.5 ± 0.9) [109 M⊙]. This gives a gas fraction of Mgas/(Mgas + M*)≈0.77.
The maximal HI rotational velocity is 60 ± 1 km s−1 (Hyperleda database10). In our Hα velocity map we observe this velocity limit more clearly on the east side of the galaxy.
5.2. Hα and oxygen abundance maps
Our map of the Hα dereddened emission line fluxes is given in Fig. 20. It includes H II regions, diffuse emission in the host, and the nebular emission from ASASSN-14jb. The position of the H II regions detected with the H II-Explorer code, and that of the SN, are marked. ASASSN-14jb is at a vertical distance of ≈2.1 kpc from the disk major axis. The H II region nearest to the SN is at a distance of ≈1.4 kpc.
 |
Fig. 19. Histogram with the distribution of absolute Ks-band magnitudes of the host galaxies of 94 Type II SNe discovered by ASAS-SN in 2013–2017 (Holoien et al. 2017a,b,c, 2019). The dashed vertical line marks the absolute magnitude of the host galaxy of ASASSN-14jb, ESO 467-G051, indicating a relatively low stellar mass for a Type II SN host in this sample. |
 |
Fig. 20. Hα MUSE map of the host galaxy and the supernova explosion site. Black circles marks the position of the H II regions, from the MUSE data of the host galaxy, detected with H II-Explorer. Coordinates are the right ascension and declination offsets from the center of ESO 467-G051, in arcminutes. The 1 kpc scale of the image is marked in the upper left. |
The spectra of the H II regions can be used to estimate the gas-phase oxygen abundance. We did so using the O3N2 and N2 strong emission line methods (Marino et al. 2013). The median obtained, with 99% confidence intervals, were  and
and  , respectively. A new strong line calibration by Dopita et al. (2016, hereafter D16), which uses [S II], [N II], and Hα lines, provides significantly lower values, with a median of
  . The D16 and O3N2 maps are presented in Fig.21. Median values of the maps are
  and
and  , for the spaxels with S/N ≥ 10.
The distributions of oxygen abundances obtained with the N2, O3N2 and D16 nebular emission line diagnostics is given in Fig. 22. All the mean values are sub-Solar (using as reference 12 + log(O/H)⊙ = 8.69, from Asplund et al. 2009), and significantly below 12 + log(O/H)⊙ = 8.54 (Galbany et al. 2018), the average for H II regions near Type II SNe of the PMAS/PPAK Integral-Field Supernova Host Compilation (PISCO). Our host galaxy B-band absolute magnitude, of MB = −17.6 mag, compares well with the mean B-band magnitude of  mag in the recent sample of Type II SNe in low-metallicity, dwarf galaxies (Gutiérrez et al. 2018). Also, as showed in Gutiérrez et al. (2018), lower luminosity galaxies hosts lower metallicity Type II SNe, filling the space between the 0.1 and 0.4 Z⊙ metallicity models. This is expected given the strong correlation between stellar mass (or galaxy luminosity) and metallicity. It is worthwhile to mention that the O3N2 map shows lower oxygen abundances in the cores of the H II regions. This could be a consequence of the unaccounted internal gradient of the ionization parameter of each H II region in the empirical strong line methods (Krühler et al. 2017).
5.3. D16 and the N/O ratio
The significant discrepancy of the D16 with other strong line oxygen abundance calibrations calls our attention. This abundance scale relies on a specific relation between the N/O and O/H ratios (Dopita et al. 2016) for which it is useful to consider a diagnostic independent on any a priori relation. Pérez-Montero (2014) developed a semi-empirical code, H II-CHI-MISTRY, that derives O/H, N/O and the ionization parameter U, using the reddening-corrected fluxes of [O II] λ3727, [O III] λ4363, λ5007, [N II] λ6584 and [S II] λλ6717,6731, relative-to-Hβ. When the O auroral lines are absent, as is our case, the code uses a limited grid of empirically constrained models to provide abundances that are consistent with the “direct” electron temperature measurement method. We applied H II-CHI-MISTRY v3.0 with the accessible lines [O I] λ5007, [N II] λ6584 and [S II] λλ6717,6731. The output N/O ratio is shown as a function of the oxygen abundances in Fig. 23. We observe a clear offset from the D16 calibration. The mean of the oxygen abundances is 8.53 ± 0.13 while the N/O ratio has a mean of −1.63 ± 0.1. There is a trend with the ionization parameter so that higher oxygen abundances show lower N/O and U values (same with Hα luminosity instead of U) and, vice versa, the lower abundances correspond to higher N/O ratios and also they are closer to the D16 prescription. The negative correlation between N/O and O/H, together with the trend with Hα luminosity, has been observed in blue compact dwarf galaxies (Kumari et al. 2018).
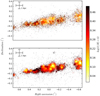 |
Fig. 21. D16 (top) and O3N2 (bottom) oxygen abundance maps of the host galaxy ESO467-G051 as seen by MUSE, shifting the D16 map by +0.4 dex to provide an easier comparison. Coordinates are the right ascension and declination offsets from the center of ESO 467-G051, in arc-minutes. The 1 kpc scale of the image is marked in the upper left. |
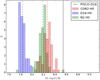 |
Fig. 22. Distribution of the gas-phase oxygen abundances used for ESO 467-G051 H II regions, based on the D16, O3N2 and N2 calibrations. The dashed lines represent the median for each distribution and the black vertical line indicates the average abundance for Type II SNe hosts from the PISCO compilation using the D16 calibration (Galbany et al. 2018). |
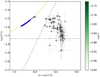 |
Fig. 23. Oxygen abundances versus N/O ratios obtained with the code developed in Pérez-Montero (2014). Each point has the errorbars delivered by the code and each point is colored according to the ionization parameter U delivered. The solid orange line indicates the relation as assumed in the D16 calibration and the blue dots correspond to the observed values for our H II regions abundances using D16. The dashed lines indicate the asymptotes for orange line, at the very high and very low O/H ratios regimes. |
6. Discussion
ASASSN-14jb is a normal Type IIP SN located at a projected distance of ∼2.1 kpc from the mid-plane and ∼1.4 kpc from the closest, diffuse H II region of ESO 467-G051. Since Type II SNe come from stars with short life times, the unusual location begs for an explanation. Several hypothesis have been advanced for SNe with no clear parent galaxy. One is that the host is an undetected low-surface brightness (LSB) galaxy, or even a small fragment of a disrupted satellite galaxy (Abadi et al. 2009). For ASASSN-14jb a tidal tail from the interaction with NGC 7259 could be also a possibility for the origin of the progenitor location. Other interesting possibility is that the progenitor of ASASSN-14jb traveled ≈1.4 kpc from its birthplace driven by gravitational interaction.
6.1. Type II SNe from runaway stars
Different scenarios have been proposed for SNe coming from runaway stars. One is the Binary Supernova Scenario (BSS) where they are pushed by the interaction with a massive binary companion that exploded as a supernova. Other is the Dynamical Ejection Scenario (DES), where the impulse comes from close encounters in clusters, including those with binaries, very massive stars, or intermediate or massive black-holes (Gvaramadze et al. 2009; Hansen & Milosavljević 2003; Gualandris & Portegies Zwart 2007). Yet another is the hyper-velocity star (HVS) scenario, resulting from the so-called Hills Mechanism, where velocities higher than 100 km s−1 are provided by interaction with a supermassive black-hole at the center of the galaxy (see Brown 2015, for a review on HVS).
The approximate lifetime of a star with ZAMS mass of ∼10 M⊙ in single stellar evolution is ∼30 Myr. Covering the ∼1.4 kpc from the nearest star forming region in this time would require a projected space velocity of ∼47 km s−1. Considering the lifetime of the least massive stars that undergo core collapse in the models of Zapartas et al. (2017), ∼48 Myr for ∼8 M⊙ progenitors, reduces the requirement to ∼30 km s−1. Both are plausible velocities given the observed population of runaway stars in the Galaxy and the Magellanic Clouds (e.g., Schnurr et al. 2008). The velocity distribution of early type runaway stars in the Milky Way also supports these estimates (Silva & Napiwotzki 2011). OB stars at high Galactic latitudes exceed the minimum velocity needed to reach 1 kpc off the Galactic disk. Scaling the result to ESO 467-G051 to account for its smaller mass, the maximum height above the disk that would be reached for a given velocity would be comparable to that of ASASSN-14jb. Let us now consider an illustrative case of the BSS scenario, with a primary star of 25 M⊙ at ZAMS. The primary would explode ≈8 Myr after formation (e.g., Pols et al. 1998, assuming half solar metallicity in their grid), leaving 22 Myr as the flight time for a secondary of 10 M⊙ at ZAMS. Traveling the ∼1.4 kpc in this time requires a velocity of v ≃ 61 km s−1. Finally, the HVS scenario is also feasible. The projected distance from the position of ASASSN-14jb to the host galaxy center is 2.5 kpc. Taking the lifetime of the longest living CCSN progenitors of Zapartas et al. (2017) (48 Myr) the lower limit for the space velocity is v ≥ 51 km s−1. Comparing this with the case of the Type II SN 2006bx (Zinn et al. 2011), the progenitor of which would have been an HVS with v ≳ 848 km s−1, an HVS progenitor for ASASSN-14jb seems unnecessary.
On the other hand, theory is not as supportive of the runaway progenitor scenario. Eldridge et al. (2011) studied the distribution of spatial velocities and distances traveled for progenitors of CCSNe in the BSS scenario, ignoring the galaxy potential. They obtained a total average of 190 ± 380 pc (non-Gaussian distribution) with a 17.5 ± 18.7 km s−1 space velocity for the secondary of the binary system exploding as a Type IIP like SN at Solar metallicity (Z = 0.02), while Z = 0.004 gives mildly higher velocities. A more recent study by Renzo et al. (2019) confirms these results, showing that 2.5% of binary systems have a disruption velocity ≳30 km s−1 after the explosion of the primary. Hence, the bulk of the ejected populations does not reach the velocities needed by the progenitor of ASASSN-14jb and taking the host galaxy potential into account would make the scenario less probable. There are, however, tails in the ejected velocity distributions where the velocities are consistent with the requirements of the ASSASN-14jb progenitor.
6.2. Disk thickness and extraplanar star formation
Hakobyan et al. (2017) studied the vertical distribution of both SNe Ia and CCSNe in edge-on, late-type disk galaxies using a sample of 102 historical SNe. For Sc-Sd type galaxies the scale height, in units of the isophotal radius at a surface brightness in g-band of 25 mag arcsec−2 or R25, 0.0440 ± 0.007 for CCSNe. ASASSN-14jb has zSN/R25 = 0.22, being five times above this scale. Given this, it seems clear that the location for ASASSN-14jb is very rare for a CCSN.
We estimated the height scale of z0/R25 = 0.053 ± 0.012 for ESO 467-G051 by fitting a sech2z/z0 profile to the Hα profile along the perpendicular between the disk and the SN. Fits to the V or the R-band images gave slightly larger values of z0/R25 = 0.0585 ± 0.0018 and z0/R25 = 0.0599 ± 0.0019, respectively.
The scale height of each supernova type is expected to match that of the stellar population supplying their progenitors (e.g., Kangas et al. 2017). For Type II SNe we expect that the vertical distribution follows the distribution of recent star formation (OB stars). In particular, as the thick disk population is generally significantly older (Dalcanton & Bernstein 2002; Yoachim & Dalcanton 2008; Elmegreen et al. 2017), we are less likely to observe a Type II SN in the thick disk. Nevertheless, Howk et al. (2018a) compiled a sample of 6 extraplanar H II regions detected in nearby, edge-on disk galaxies. The projected vertical distances of these regions above their disk cover the range 0.9−3.0 kpc, up to 0.11 in units of R25, which is within a factor of two of the height of ASASSN-14jb above the disk of ESO 467-G051. Given this, the scenario of in-situ star formation for the progenitor of ASASSN-14jb is possible (see Howk et al. 2018a for a discussion on the necessary conditions for extraplanar star formation).
The MUSE nebular spectrum can be used to put constrains on any in-situ star formation at the position of ASASSN-14jb. We fit the spectrum at the wavelength of the [O III] λ5007 line and obtain a 3σ upper limit to the emission line luminosity of ≈1035 erg s−1. We did not use Hα because the strong and broad SN nebular emission line dominates at those wavelengths. Comparing the [O III] λ5007 luminosity upper limit with the ionization models of Xiao et al. (2018), we conclude that any underlying H II region would have to be at least ≈10 Myr old, implying MZAMS < 15 M⊙ for a single star progenitor. All massive O stars would have been gone and exploded as CCSNe in such conditions. This indicates the need for a relatively low-mass progenitor of ASASSN-14jb in the in-situ star formation scenario, as well.
6.3. Abundance offset
Another relevant piece of information is the expected abundance offset, Δϵ, of a former, or undetected, star forming region at the position of the SN (Howk et al. 2018b,a). To do so we need estimates of the oxygen abundance at the supernova position and the disk, given in the same scale. Howk et al. (2018b) show that relative abundances in the O3N2 scale are reliable so we chose this one.
For the reference disk (z = 0) we take the average of the H II regions within 1σ of their vertical distribution, which corresponds to a vertical distance of ≈0.25 kpc. The result is 12 + log(O/H) = 8.22 ± 0.07 dex. For ASASSN-14jb we obtain the oxygen abundance from our estimate of the iron abundance derived in Sect. 4.6 of Z = 0.3 ± 0.1 Z⊙. We adopt the linear relation between [O/H] and [Fe/H] given by Stoll et al. (2013), and obtain 12 + log(O/H) = 8.4 ± 0.1 dex. The oxygen abundance offset implied results Δϵ = 0.3 ± 0.1 dex.
Recent data from the Apache Point Observatory Galactic Evolution Experiment survey (APOGEE, Majewski et al. 2017), provides for an independent estimate. Rojas-Arriagada et al. (Rojas-Arriagada et al. 2019) study abundance gradients using red giant branch stars, assumed to be likely bulge members by their spatial location. Adopting the same strategy on APOGEE data of our host we obtain relation between [O/H] and [Fe/H] similar to that of Stoll et al. (2013). A linear fit of the form [Fe/H] = c1 + c2 × [O/H], using a re-sampling technique to estimate the errors, provides coefficients c1 = −0.2552 ± 0.0014 and c2 = 1.0452 ± 0.0056 was obtained. This finally translates to an offset of Δϵ = 0.21 ± 0.11 dex.
Another possible estimate of the abundance at the supernova height is the extrapolation of the vertical gradient derived from the H II regions in the disk. Doing a linear fit as a function |z|, we obtain a gradient of −0.62 ± 0.32 dex per height normalized by R25, which for ASASSN-14jb height corresponds to an oxygen abundance offset of Δϵ = −0.14 ± 0.07 dex.
In Fig. 24 we show the vertical oxygen abundance gradient Δϵ/z derived for the extraplanar H II region compilation of Howk et al. (2018b) and ASASSN-14jb, as a function of the height in kiloparsec in units of R25. There are three interesting points to note from these plots: (1) There is a 2σ offset between our abundance offset estimates (direct EW measurements from the SN versus vertical gradient of the disk abundance profile); (2) The metallicity estimate from ASASSN-14jb corresponds to a positive offset relative to the mean reference measurement of H II regions in the galaxy disk; and (3) Including the R25 normalization, the hypothetical H II region where the progenitor of ASASSN-14jb could have formed (in an in-situ star-formation scenario) is farther than the Howk et al. (2018b) sample.
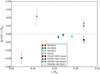 |
Fig. 24. Metalicity gradient obtained from the extraplanar H II-regions from Howk et al. (2018a) and from ASASSN-14jb, as a function of the vertical distance to the disk normalized by the isophotal radius R25. The metallicity offset from ASASSN-14jb was obtained from measurements of the Fe II λ5018 line pEW and the calculated mean oxygen abundance of the host, ESO467-G051, from the O3N2 diagnostic. We also estimated the oxygen abundance at the supernova position extrapolating the vertical gradient obtained from our H II-region abundances using the regions at any azimuthal position, dubbed “linear”, and from a two dimensional model, dubbed “planar”, which are marked as a black triangle and square, respectively. |
An important caveat to consider in the previous analysis is that, because the galaxy is edge-on, we are probably observing mostly the outer H II regions of the host galaxy that generally will not be representative of the whole disk. In general star-forming galaxies have higher metallicity gas in their inner regions, having a common radial gradient of ≈ − 0.1 dex/Reff (or 0.3 ± 0.2 dex/R25) up to 2 Reff (e.g., Sánchez et al. 2012; Pilyugin et al. 2014; Sánchez-Menguiano et al. 2016). As we do not actually know the radial coordinate of ASASSN-14jb and the observed H II regions, there might be a systematic error on what we consider the reference abundance for the disk, being higher if the observed H II regions are in average metal poor at the external disk. If we consider up to ≈0.2 dex in the metallicity offset, given by the possible bias in our H II regions, ASASSN-14jb metallicity is still consistent with the disk at the 1σ level. This is consistent with the possibility that the progenitor star actually came from the disk as a runaway or that the gas from which it formed at this height has significant contribution of enriched material from the disk.
6.4. SN-Host connection
We have constrained the properties of ASASSN-14jb both from the observations of the transient and from the observations of its host. Both sets of results provide a consistent picture. From the early and late light curves we estimated an ejected mass (≤10 M⊙), given a low explosion energy (≤0.25 foe) consistent with the transient energetics, and the low estimate of the 56Ni mass. Also, our analysis of the nebular spectra points to a low mass progenitor of 10−12 M⊙. The analysis of the environment of ASASSN-14jb, led us to two possible explanations for the unusual location of the transient, which are the extraplanar in-situ star formation and the runaway scenarios. In both cases, a low mass progenitor is required because their longer lifetime allows for a longer flight time in the runaway case and a longer time delay between the explosion of the more massive ionizing stars versus the less massive ones, given the strong upper limit of the possible underlying H II region in the in-situ scenario. We have also obtained a constraint on the progenitor metallicity from a direct measurement of the Fe II λ5169 pseudo equivalent width. The value of 0.3 ± 0.1 Z⊙ is consistent, or mildly higher, than the values inferred for the gas-phase metallicity of the disk. This, again we argue, is consistent with both scenarios as the progenitor metallicity could reflect that the star formed in the disk and was ejected or that the enriched gas itself was ejected and contributed to the abundance of the in-situ extraplanar region where the progenitor could have been born. The efficiency of extraplanar enrichment depends on the depth of the galaxy potential well, which is a decreasing function of the stellar mass (Peeples & Shankar 2011; Brook et al. 2014; Christensen et al. 2016; Chisholm et al. 2018). Hence, the extraplanar relative enrichment is expected to be larger in low mass galaxies, as the ASASSN-14jb host, than, for example, Milky Way-like galaxies. The same reasoning applies for runaways stars as the maximum height that they achieve would be a decreasing function of the potential well depth, as well.
The possibility that the interaction of the host of ASASSN-14jb and SN 2009ip could explain their unusual locations, especially for ASASSN-14jb, should be tested in more detail. Our data and analysis discards the presence of some kind of weak tidal tail, but a more thorough study could be carried in the future with deeper imaging.
7. Conclusions
ASASSN-14jb shows light curves and spectral evolution consistent with typical Type II SNe. The SN had a peak absolute V-band magnitude of MV, max = −16.04 ± 0.18 mag and an estimated bolometric luminosity at 50 days of log(L/L⊙) = 8.4 ± 0.18, which puts it in the low luminosity tail of the brightness distribution. Both the decline slope in the plateau phase (s2, V = −0.15 ± 0.02 mag per 100 days) and the expansion velocity at 50 days (v (Fe II)=2774 ± 69 km s−1) follow the observed correlations with absolute magnitudes. The color evolution of ASASSN-14jb points to a bluer continuum than other Type IIP like SNe. This behavior may be due to a true difference in the temperature evolution or it may be an effect of lower line-blanketing in the blue part of the spectrum due to a lower metallicity of the progenitor star.
The spectral evolution presents a couple of interesting peculiarities. All our plateau observations show weaker lines (lower pseudo-EW) compared with a set of prototypical Type II SNe from the literature, which also points to a relatively bluer continuum or lower metallicity progenitor. Also, in photospheric spectra obtained at 64 and 80 days after explosion, we clearly detect high velocity absorption components at ≈7000 km s−1 in the Hα and Hβ lines. These absorption components cannot be Si II λ6355 or Ba absorption features, and signal a moderate interaction with circumstellar material.
We used three empirical methods to measure Type II SNe distances and found internal consistency in the distance estimates, considering their uncertainties. The weighted average distance modulus of ASASSN-14jb was found to be μ = 32.00 ± 0.18 mag (D = 25 ± 2 Mpc).
From the late-time, nebular-phase photometry we estimate a 56Ni mass of 0.0210 ± 0.0025 M⊙, slighly lower than the median for normal Type II SNe. Based on the near-UV photometry from Swift/UVOT and analytic models from RW11 we estimate a progenitor radius of R* ≃ 579 ± 28 R⊙, which is consistent with the color evolution of the mildly sub-Solar and compact RSG progenitor model (m15z8m3) presented in D13. Comparing our nebular-phase spectrum with models from D13 and J14 we conclude ASSASN14jb had a low to moderate mass progenitor (10−12 M⊙). The early light curve analysis yields  , while at nebular times it implies
  . Both constraints intersect at the pair (Mej, Eexp) ≈ (6 M⊙, 0.25 foe). The estimated pseudo-equivalent width of the Fe II λ5018 line and its time evolution are more consistent with the theoretical expectations for a (0.3 ± 0.1) Z⊙ metallicity progenitor. Given that the progenitor seems to be relatively compact (R* < 600 R⊙), the metallicity could be lower. More models would be needed to constrain this further.
We used our MUSE data to constrain the host galaxy gas-phase oxygen abundances. From the O3N2 and N2 strong line methods (Marino et al. 2013) the H II regions have a median abundance of  and
and  , respectively. Using the D16 (Dopita et al. 2016) calibration we obtained a median of
  . These values are significantly below the average of the PISCO sample mean for Type II SNe nearby H II regions, of 12 + log(O/H) = 8.54 dex. This is independent of the diagnostics used.
Finally, we discussed scenarios for the unusual explosion site of ASASSN-14jb, which is 5 times farther from the disk of its host than the height scale measured for CCSNe according to Hakobyan et al. (2017). We conclude that, although the probablity of ejection from the disk is low from theory (Eldridge et al. 2011; Renzo et al. 2019) and the specific mechanism to initiate the star formation at this heights is uncertain, both scenarios require a low mass progenitor with a ZAMS mass of ≈10−12 M⊙. This estimate is consistent with the physical parameters derived for the explosion.
IRAF is distributed by the National Optical Astronomy Observatory, which is operated by the Association of Universities for Research in Astronomy (AURA) under a cooperative agreement with the National Science Foundation.
In this case the logarithmic derivative is  . Usually the time was normalized by 100 days and the velocity to 1000 km s−1, but this was just to ensure stability for the fitting procedure.
We note that this equation is a corrected version of Eq. (33) in RW11. The original one is ![Mathematical equation: $ R_{*} = 0.7 \times f_{\rho}^{0.1} \left[T_{\mathrm{col}}/(f_T/1.2)\right]^4 t_5^{1.9} \times 10^{12}\,[\mathrm{cm}] $](/articles/aa/full_html/2019/09/aa34972-18/aa34972-18-eq28.gif) , which is inconsistent with Eq. (13) of the same paper (our Eq. (1)).
, which is inconsistent with Eq. (13) of the same paper (our Eq. (1)).
Assuming  as in J14 and estimating the fluxes by fitting a skewed Gaussian to the line profiles.
Image obtained with SOFI at the NTT by the PESSTO program (ID 191.D-0935) with SOFI mounted on the ESO/NTT.
MHI = 2.356 × 10⁵ × D2∫Sνdν M⊙, D = 23.5 Mpc.
αSCM = 3.18 ± 0.41, βSCM = 0.97 ± 0.25, ℳSCM = −1.13 ± 0.04.
Acknowledgments
NM acknowledges the Insitute of Astrophysics at PUC, the Millennium Institute of Astrophysics (MAS), and the Astronomy Nucleus for University Diego Portales (UDP) for supporting this research. We thank Luc Dessart, Enrique Perez-Montero, Ondrej Pejcha, Franz Bauer, Melina Bersten, Lin Xiao, Artur Hakobyan and Antonia Bevan for valuable discussions. Support for NM and JLP was provided in part by FONDECYT through the grants 1151445 and 1191038. Support for NM, JLP, and AC was also provided by the Ministry of Economy, Development, and Tourism’s Millennium Science Initiative through grant IC120009, awarded to The Millennium Institute of Astrophysics, MAS. The authors thank Las Cumbres Observatory and its staff for their continued support of ASAS-SN. ASAS-SN is supported by the Gordon and Betty Moore Foundation through grant GBMF5490 to the Ohio State University and NSF grant AST-1814440. Development of ASAS-SN has been supported by NSF grant AST-0908816, the Center for Cosmology and AstroParticle Physics at the Ohio State University, the Mt. Cuba Astronomical Foundation, the Chinese Academy of Sciences South America Center for Astronomy (CASSACA), and by George Skestos. This research has made use of data from the Public ESO Spectroscopic Survey of Transient Objects (PESSTO; Smartt et al. 2015, ESO program ID 191.D-0935) and Spitzer IRAC data from 2015-09-13 (program ID 11053), 2016-08-17 (program ID 12099) and 2014-09-05 (program ID 10139). This paper includes data gathered with the 6.5 m Magellan Telescopes located at Las Campanas Observatory, Chile. This research has made use of the NASA/IPAC Extragalactic Database (NED) which is operated by the Jet Propulsion Laboratory, California Institute of Technology, under contract with the National Aeronautics. We acknowledge the use of the HyperLeda database (http://leda.univ-lyon1.fr). This work is based in part on observations made with the Spitzer Space Telescope, which is operated by the Jet Propulsion Laboratory, California Institute of Technology under a contract with NASA. Observations made with the NASA Galaxy Evolution Explorer (GALEX) were used in the analyses presented in this manuscript. Some of the data presented in this paper were obtained from the Mikulski Archive for Space Telescopes (MAST).
References
- Abadi, M. G., Navarro, J. F., & Steinmetz, M. 2009, ApJ, 691, L63 [NASA ADS] [CrossRef] [Google Scholar]
- Alard, C. 2000, A&AS, 144, 363 [NASA ADS] [CrossRef] [EDP Sciences] [Google Scholar]
- Alard, C., & Lupton, R. H. 1998, ApJ, 503, 325 [NASA ADS] [CrossRef] [Google Scholar]
- Alatalo, K., Cales, S. L., Rich, J. A., et al. 2016, ApJS, 224, 38 [NASA ADS] [CrossRef] [Google Scholar]
- Anderson, J. P., & James, P. A. 2009, MNRAS, 399, 559 [NASA ADS] [CrossRef] [Google Scholar]
- Anderson, J. P., Covarrubias, R. A., James, P. A., Hamuy, M., & Habergham, S. M. 2010, MNRAS, 407, 2660 [NASA ADS] [CrossRef] [Google Scholar]
- Anderson, J. P., Habergham, S. M., James, P. A., & Hamuy, M. 2012, MNRAS, 424, 1372 [NASA ADS] [CrossRef] [Google Scholar]
- Anderson, J. P., González-Gaitán, S., Hamuy, M., et al. 2014a, ApJ, 786, 67 [NASA ADS] [CrossRef] [Google Scholar]
- Anderson, J. P., Dessart, L., Gutierrez, C. P., et al. 2014b, MNRAS, 441, 671 [NASA ADS] [CrossRef] [Google Scholar]
- Anderson, J. P., James, P. A., Habergham, S. M., Galbany, L., & Kuncarayakti, H. 2015, PASA, 32, e019 [NASA ADS] [CrossRef] [Google Scholar]
- Anderson, J. P., Gutiérrez, C. P., Dessart, L., et al. 2016, A&A, 589, A110 [NASA ADS] [CrossRef] [EDP Sciences] [Google Scholar]
- Aramyan, L. S., Hakobyan, A. A., Petrosian, A. R., et al. 2016, MNRAS, 459, 3130 [NASA ADS] [CrossRef] [Google Scholar]
- Arcavi, I., Gal-Yam, A., Kasliwal, M. M., et al. 2010, ApJ, 721, 777 [NASA ADS] [CrossRef] [Google Scholar]
- Arnett, D. 1996, Supernovae and Nucleosynthesis: An Investigation of the History of Matter, from the Big Bang to the Present (Princeton, NJ: Princeton University Press) [Google Scholar]
- Asplund, M., Grevesse, N., Sauval, A. J., & Scott, P. 2009, ARA&A, 47, 481 [NASA ADS] [CrossRef] [Google Scholar]
- Bacon, R., Accardo, M., Adjali, L., et al. 2010, Proc. SPIE, 7735, 773508 [Google Scholar]
- Baldwin, J. A., Phillips, M. M., & Terlevich, R. 1981, PASP, 93, 5 [NASA ADS] [CrossRef] [EDP Sciences] [Google Scholar]
- Barbon, R., Ciatti, F., & Rosino, L. 1979, A&A, 72, 287 [Google Scholar]
- Baron, E., Nugent, P. E., Branch, D., & Hauschildt, P. H. 2004, ApJ, 616, L91 [NASA ADS] [CrossRef] [Google Scholar]
- Baron, E., Nugent, P. E., Branch, D., & Hauschildt, P. H. 2005, ASP Conf. Ser., 342, 351 [NASA ADS] [Google Scholar]
- Bartunov, O. S., Tsvetkov, D. Y., & Filimonova, I. V. 1994, PASP, 106, 1276 [NASA ADS] [CrossRef] [Google Scholar]
- Becker, A. 2015, Astrophysics Source Code Library [record ascl:1504.004] [Google Scholar]
- Bersten, M. C., & Hamuy, M. 2009, ApJ, 701, 200 [NASA ADS] [CrossRef] [Google Scholar]
- Bersten, M. C., Benvenuto, O., & Hamuy, M. 2011, ApJ, 729, 61 [NASA ADS] [CrossRef] [Google Scholar]
- Bertin, E., & Arnouts, S. 1996, A&AS, 117, 393 [NASA ADS] [CrossRef] [EDP Sciences] [Google Scholar]
- Blaauw, A. 1993, ASP Conf. Ser., 35, 207 [Google Scholar]
- Blinnikov, S. I., & Bartunov, O. S. 1993, A&A, 273, 106 [NASA ADS] [Google Scholar]
- Bose, S., Kumar, B., Sutaria, F., et al. 2013, MNRAS, 433, 1871 [NASA ADS] [CrossRef] [Google Scholar]
- Bose, S., Valenti, S., Misra, K., et al. 2015, MNRAS, 450, 2373 [NASA ADS] [CrossRef] [Google Scholar]
- Bose, S., Kumar, B., Misra, K., et al. 2016, MNRAS, 455, 2712 [NASA ADS] [CrossRef] [Google Scholar]
- Bose, S., Dong, S., Kochanek, C. S., et al. 2018, ApJ, 862, 107 [NASA ADS] [CrossRef] [Google Scholar]
- Branch, D., & Wheeler, J. C. 2017, SupernovaExplosions: Astronomy and Astrophysics Library (Springer-Verlag GmbH Germany), Cap. 1.3 [CrossRef] [Google Scholar]
- Brimacombe, J., Kiyota, S., Holoien, T. W.-S., et al. 2014, ATel, 6592 [Google Scholar]
- Brook, C. B., Stinson, G., Gibson, B. K., et al. 2014, MNRAS, 443, 3809 [NASA ADS] [CrossRef] [Google Scholar]
- Brown, W. R. 2015, ARA&A, 53, 15 [Google Scholar]
- Brown, T. M., Baliber, N., Bianco, F. B., et al. 2013, PASP, 125, 1031 [NASA ADS] [CrossRef] [Google Scholar]
- Brown, P. J., Breeveld, A. A., Holland, S., Kuin, P., & Pritchard, T. 2014, Ap&SS, 354, 89 [NASA ADS] [CrossRef] [Google Scholar]
- Bruzual, G., & Charlot, S. 2003, MNRAS, 344, 1000 [NASA ADS] [CrossRef] [Google Scholar]
- Cardelli, J. A., Clayton, G. C., & Mathis, J. S. 1989, ApJ, 345, 245 [NASA ADS] [CrossRef] [Google Scholar]
- Challis, P. 2014, ATel, 6600 [Google Scholar]
- Chevalier, R. A., & Soderberg, A. M. 2010, ApJ, 711, L40 [NASA ADS] [CrossRef] [Google Scholar]
- Chisholm, J., Tremonti, C., & Leitherer, C. 2018, MNRAS, 481, 1690 [NASA ADS] [CrossRef] [Google Scholar]
- Christensen, C. R., Davé, R., Governato, F., et al. 2016, ApJ, 824, 57 [NASA ADS] [CrossRef] [Google Scholar]
- Chugai, N. N. 1994, Circumstellar Media in Late Stages of Stellar Evolution (Cambridge: Cambridge University Press), 148 [CrossRef] [Google Scholar]
- Chugai, N. N., Fabrika, S. N., Sholukhova, O. N., et al. 2005, Astron. Lett., 31, 792 [NASA ADS] [CrossRef] [Google Scholar]
- Cid Fernandes, R., Schoenell, W., Gomes, J. M., et al. 2009, RM&AC Conf. Ser., 35, 127 [NASA ADS] [Google Scholar]
- Clocchiatti, A., & Wheeler, J. C. 1997, ApJ, 491, 375 [NASA ADS] [CrossRef] [Google Scholar]
- Cutri, R. M., Skrutskie, M. F., van Dyk, S., et al. 2003, VizieR Online Data Catalog: II/246 [Google Scholar]
- Dalcanton, J. J., & Bernstein, R. A. 2002, AJ, 124, 1328 [NASA ADS] [CrossRef] [Google Scholar]
- Dall’Ora, M., Botticella, M. T., Pumo, M. L., et al. 2014, ApJ, 787, 139 [NASA ADS] [CrossRef] [Google Scholar]
- Dessart, L., & Hillier, D. J. 2005a, A&A, 437, 667 [NASA ADS] [CrossRef] [EDP Sciences] [Google Scholar]
- Dessart, L., & Hillier, D. J. 2005b, A&A, 439, 671 [NASA ADS] [CrossRef] [EDP Sciences] [Google Scholar]
- Dessart, L., & Hillier, D. J. 2005c, The Fate of the Most Massive Stars (San Francisco, CA: Astronomical Society of the Pacific), 332, 427 [NASA ADS] [Google Scholar]
- Dessart, L., & Hillier, D. J. 2010, MNRAS, 405, 2141 [NASA ADS] [Google Scholar]
- Dessart, L., Hillier, D. J., Waldman, R., & Livne, E. 2013, MNRAS, 433, 1745 (D13) [NASA ADS] [CrossRef] [Google Scholar]
- de Jaeger, T., González-Gaitán, S., Anderson, J. P., et al. 2015, ApJ, 815, 121 [NASA ADS] [CrossRef] [Google Scholar]
- de Jaeger, T., González-Gaitán, S., Hamuy, M., et al. 2017, ApJ, 835, 166 [NASA ADS] [CrossRef] [Google Scholar]
- de Vaucouleurs, G., de Vaucouleurs, A., Corwin, Jr., H. G., et al. 1991, Third Reference Catalogue of Bright Galaxies (New York: Springer) [Google Scholar]
- Dopita, M. A., Evans, R., Cohen, M., & Schwartz, R. D. 1984, ApJ, 287, L69 [NASA ADS] [CrossRef] [Google Scholar]
- Dopita, M. A., Kewley, L. J., Sutherland, R. S., & Nicholls, D. C. 2016, Ap&SS, 361, 61 [NASA ADS] [CrossRef] [Google Scholar]
- Dressler, A., Bigelow, B., Hare, T., et al. 2011, PASP, 123, 288 [NASA ADS] [CrossRef] [Google Scholar]
- Dwek, E., A’Hearn, M. F., Becklin, E. E., et al. 1983, ApJ, 274, 168 [NASA ADS] [CrossRef] [Google Scholar]
- Eastman, R. G., Schmidt, B. P., & Kirshner, R. 1996, ApJ, 466, 911 [NASA ADS] [CrossRef] [Google Scholar]
- Ekström, S., Georgy, C., Eggenberger, P., et al. 2012, A&A, 537, A146 [NASA ADS] [CrossRef] [EDP Sciences] [Google Scholar]
- Eldridge, J. J., Langer, N., & Tout, C. A. 2011, MNRAS, 414, 3501 [NASA ADS] [CrossRef] [Google Scholar]
- Eldridge, J. J., Fraser, M., Smartt, S. J., Maund, J. R., & Crockett, R. M. 2013, MNRAS, 436, 774 [NASA ADS] [CrossRef] [Google Scholar]
- Eldridge, J. J., Stanway, E. R., Xiao, L., et al. 2017, PASA, 34, e058 [NASA ADS] [CrossRef] [Google Scholar]
- Elmegreen, B. G., Elmegreen, D. M., Tompkins, B., & Jenks, L. G. 2017, ApJ, 847, 14 [NASA ADS] [CrossRef] [Google Scholar]
- Elmhamdi, A., Danziger, I. J., Chugai, N., et al. 2003, MNRAS, 338, 939 [NASA ADS] [CrossRef] [Google Scholar]
- Fabricant, D., Cheimets, P., Caldwell, N., & Geary, J. 1998, PASP, 110, 79 [NASA ADS] [CrossRef] [Google Scholar]
- Faran, T., Poznanski, D., Filippenko, A. V., et al. 2014, MNRAS, 442, 844 [NASA ADS] [CrossRef] [Google Scholar]
- Fazio, G. G., Hora, J. L., Allen, L. E., et al. 2004, ApJS, 154, 10 [NASA ADS] [CrossRef] [Google Scholar]
- Filippenko, A. V. 1988, AJ, 96, 1941 [NASA ADS] [CrossRef] [Google Scholar]
- Filippenko, A. V. 1997, ARA&A, 35, 309 [NASA ADS] [CrossRef] [Google Scholar]
- Filippenko, A. V., Matheson, T., & Ho, L. C. 1993, ApJ, 415, L103 [NASA ADS] [CrossRef] [Google Scholar]
- Folatelli, G., Bersten, M. C., Kuncarayakti, H., et al. 2015, ApJ, 811, 147 [NASA ADS] [CrossRef] [Google Scholar]
- Folatelli, G., Van Dyk, S. D., Kuncarayakti, H., et al. 2016, ApJ, 825, L22 [NASA ADS] [CrossRef] [Google Scholar]
- Fransson, C., & Chevalier, R. A. 1989, ApJ, 343, 323 [NASA ADS] [CrossRef] [Google Scholar]
- Fraser, M., Inserra, C., Jerkstrand, A., et al. 2013, MNRAS, 433, 1312 [NASA ADS] [CrossRef] [Google Scholar]
- Galbany, L., Stanishev, V., Mourão, A. M., et al. 2014, A&A, 572, A38 [NASA ADS] [CrossRef] [EDP Sciences] [Google Scholar]
- Galbany, L., Hamuy, M., Phillips, M. M., et al. 2016a, AJ, 151, 33 [NASA ADS] [CrossRef] [Google Scholar]
- Galbany, L., Anderson, J. P., Rosales-Ortega, F. F., et al. 2016b, MNRAS, 455, 4087 [NASA ADS] [CrossRef] [Google Scholar]
- Galbany, L., Stanishev, V., Mourão, A. M., et al. 2016c, A&A, 591, A48 [NASA ADS] [CrossRef] [EDP Sciences] [Google Scholar]
- Galbany, L., Anderson, J. P., Sánchez, S. F., et al. 2018, ApJ, 855, 107 [NASA ADS] [CrossRef] [Google Scholar]
- Gall, E. E. E., Polshaw, J., Kotak, R., et al. 2015, A&A, 582, A3 [NASA ADS] [CrossRef] [EDP Sciences] [Google Scholar]
- Gezari, S., Rest, A., Huber, M. E., et al. 2010, ApJ, 720, L77 [NASA ADS] [CrossRef] [Google Scholar]
- González-Gaitán, S., Tominaga, N., Molina, J., et al. 2015, MNRAS, 451, 2212 [NASA ADS] [CrossRef] [Google Scholar]
- Gualandris, A., & Portegies Zwart, S. 2007, MNRAS, 376, L29 [NASA ADS] [CrossRef] [Google Scholar]
- Gutiérrez, C. P., Anderson, J. P., Hamuy, M., et al. 2014, ApJ, 786, L15 [NASA ADS] [CrossRef] [Google Scholar]
- Gutiérrez, C. P., Anderson, J. P., Hamuy, M., et al. 2017a, ApJ, 850, 89 [NASA ADS] [CrossRef] [Google Scholar]
- Gutiérrez, C. P., Anderson, J. P., Hamuy, M., et al. 2017b, ApJ, 850, 90 [NASA ADS] [CrossRef] [Google Scholar]
- Gutiérrez, C. P., Anderson, J. P., Sullivan, M., et al. 2018, MNRAS, 479, 3232 [NASA ADS] [CrossRef] [Google Scholar]
- Green, A. W., Glazebrook, K., McGregor, P. J., et al. 2014, MNRAS, 437, 1070 [NASA ADS] [CrossRef] [Google Scholar]
- Gvaramadze, V. V., Gualandris, A., & Portegies Zwart, S. 2009, MNRAS, 396, 570 [NASA ADS] [CrossRef] [Google Scholar]
- Hakobyan, A. A., Petrosian, A. R., McLean, B., et al. 2008, A&A, 488, 523 [NASA ADS] [CrossRef] [EDP Sciences] [Google Scholar]
- Hakobyan, A. A., Mamon, G. A., Petrosian, A. R., Kunth, D., & Turatto, M. 2009, A&A, 508, 1259 [NASA ADS] [CrossRef] [EDP Sciences] [Google Scholar]
- Hakobyan, A. A., Barkhudaryan, L. V., Karapetyan, A. G., et al. 2017, MNRAS, 471, 1390 [NASA ADS] [CrossRef] [Google Scholar]
- Hamuy, M. 2003, ApJ, 582, 905 [NASA ADS] [CrossRef] [Google Scholar]
- Hamuy, M., & Pinto, P. A. 2002, ApJ, 566, L63 [NASA ADS] [CrossRef] [Google Scholar]
- Hamuy, M., Pinto, P. A., Maza, J., et al. 2001, ApJ, 558, 615 [NASA ADS] [CrossRef] [Google Scholar]
- Hansen, B. M. S., & Milosavljević, M. 2003, ApJ, 593, L77 [NASA ADS] [CrossRef] [Google Scholar]
- Heger, A., Fryer, C. L., Woosley, S. E., Langer, N., & Hartmann, D. H. 2003, ApJ, 591, 288 [NASA ADS] [CrossRef] [Google Scholar]
- Henden, A. A., Levine, S. E., Terrell, D., Smith, T. C., & Welch, D. 2012, JAAVSO, 40, 430 [Google Scholar]
- Henry, R. B. C., & Worthey, G. 1999, PASP, 111, 919 [NASA ADS] [CrossRef] [Google Scholar]
- Hillebrandt, W., & Niemeyer, J. C. 2000, ARA&A, 38, 191 [NASA ADS] [CrossRef] [Google Scholar]
- Holoien, T. W.-S., Stanek, K. Z., Kochanek, C. S., et al. 2017a, MNRAS, 464, 2672 [NASA ADS] [CrossRef] [Google Scholar]
- Holoien, T. W.-S., Brown, J. S., Stanek, K. Z., et al. 2017b, MNRAS, 467, 1098 [NASA ADS] [Google Scholar]
- Holoien, T. W.-S., Brown, J. S., Stanek, K. Z., et al. 2017c, MNRAS, 471, 4966 [NASA ADS] [CrossRef] [Google Scholar]
- Holoien, T. W.-S., Brown, J. S., Vallely, P. J., et al. 2019, MNRAS, 484, 1899 [NASA ADS] [CrossRef] [Google Scholar]
- Hoogerwerf, R., de Bruijne, J. H. J., & de Zeeuw, P. T. 2001, A&A, 365, 49 [NASA ADS] [CrossRef] [EDP Sciences] [Google Scholar]
- Howk, J. C., Rueff, K. M., Lehner, N., et al. 2018a, ApJ, 856, 167 [NASA ADS] [CrossRef] [Google Scholar]
- Howk, J. C., Rueff, K. M., Lehner, N., et al. 2018b, ApJ, 856, 166 [NASA ADS] [CrossRef] [Google Scholar]
- Huang, F., Wang, X., Zampieri, L., et al. 2016, ApJ, 832, 139 [NASA ADS] [CrossRef] [Google Scholar]
- Huang, F., Wang, X.-F., Hosseinzadeh, G., et al. 2018, MNRAS, 475, 3959 [NASA ADS] [CrossRef] [Google Scholar]
- Inserra, C., Pastorello, A., Turatto, M., et al. 2013, A&A, 555, A142 [NASA ADS] [CrossRef] [EDP Sciences] [Google Scholar]
- Jerkstrand, A. 2017, Handbook of Supernovae (Springer International Publishing AG), 795 [CrossRef] [Google Scholar]
- Jerkstrand, A., Fransson, C., Maguire, K., et al. 2012, A&A, 546, A28 [NASA ADS] [CrossRef] [EDP Sciences] [Google Scholar]
- Jerkstrand, A., Smartt, S. J., Fraser, M., et al. 2014, MNRAS, 439, 3694 [NASA ADS] [CrossRef] [Google Scholar]
- Jerkstrand, A., Ertl, T., Janka, H. T., et al. 2018, MNRAS, 475, 277 (J18) [NASA ADS] [CrossRef] [Google Scholar]
- José, J. 2016, Stellar Explosions: Hydrodynamics and Nucleosynthesis (CRC/Taylor and Francis) [CrossRef] [Google Scholar]
- Kangas, T., Portinari, L., Mattila, S., et al. 2017, A&A, 597, A92 [NASA ADS] [CrossRef] [EDP Sciences] [Google Scholar]
- Kasen, D., & Woosley, S. E. 2009, ApJ, 703, 2205 [NASA ADS] [CrossRef] [Google Scholar]
- Kennicutt, Jr., R. C. 1998, ARA&A, 36, 189 [Google Scholar]
- Kewley, L. J., Dopita, M. A., Sutherland, R. S., Heisler, C. A., & Trevena, J. 2001, ApJ, 556, 121 [Google Scholar]
- Khazov, D., Yaron, O., Gal-Yam, A., et al. 2016, ApJ, 818, 3 [NASA ADS] [CrossRef] [Google Scholar]
- Kirshner, R. P., & Kwan, J. 1974, ApJ, 193, 27 [NASA ADS] [CrossRef] [Google Scholar]
- Kriek, M., van Dokkum, P. G., Labbé, I., et al. 2009, ApJ, 700, 221 [NASA ADS] [CrossRef] [Google Scholar]
- Krühler, T., Kuncarayakti, H., Schady, P., et al. 2017, A&A, 602, A85 [NASA ADS] [CrossRef] [EDP Sciences] [Google Scholar]
- Kuncarayakti, H., Doi, M., Aldering, G., et al. 2013, AJ, 146, 31 [NASA ADS] [CrossRef] [Google Scholar]
- Kuncarayakti, H., Maeda, K., Bersten, M. C., et al. 2015, A&A, 579, A95 [NASA ADS] [CrossRef] [EDP Sciences] [Google Scholar]
- Kuncarayakti, H., Anderson, J. P., Galbany, L., et al. 2018, A&A, 613, A35 [NASA ADS] [CrossRef] [EDP Sciences] [Google Scholar]
- Kumari, N., James, B. L., Irwin, M. J., Amorín, R., & Pérez-Montero, E. 2018, MNRAS, 476, 3793 [NASA ADS] [CrossRef] [Google Scholar]
- Lang, D., Hogg, D. W., Mierle, K., Blanton, M., & Roweis, S. 2010, AJ, 139, 1782 [Google Scholar]
- Leonard, D. C., Filippenko, A. V., Gates, E. L., et al. 2002a, PASP, 114, 35 [NASA ADS] [CrossRef] [Google Scholar]
- Leonard, D. C., Filippenko, A. V., Li, W., et al. 2002b, AJ, 124, 2490 [NASA ADS] [CrossRef] [Google Scholar]
- Litvinova, I. Y., & Nadezhin, D. K. 1985, Astron. Lett., 11, 145 [Google Scholar]
- Maguire, K., Jerkstrand, A., Smartt, S. J., et al. 2012, MNRAS, 420, 3451 [NASA ADS] [CrossRef] [Google Scholar]
- Majewski, S. R., Schiavon, R. P., Frinchaboy, P. M., et al. 2017, AJ, 154, 94 [NASA ADS] [CrossRef] [Google Scholar]
- Marino, R. A., Rosales-Ortega, F. F., Sánchez, S. F., et al. 2013, A&A, 559, A114 [NASA ADS] [CrossRef] [EDP Sciences] [Google Scholar]
- Mauerhan, J. C., Smith, N., Filippenko, A. V., et al. 2013, MNRAS, 430, 1801 [NASA ADS] [CrossRef] [Google Scholar]
- McEvoy, C. M., Dufton, P. L., Smoker, J. V., et al. 2017, ApJ, 842, 32 [NASA ADS] [CrossRef] [Google Scholar]
- McMillan, R. J., & Ciardullo, R. 1996, ApJ, 473, 707 [NASA ADS] [CrossRef] [Google Scholar]
- McSwain, M. V., Boyajian, T. S., Grundstrom, E. D., & Gies, D. R. 2007, ApJ, 655, 473 [NASA ADS] [CrossRef] [Google Scholar]
- Mikhailova, G. A., Bartunov, O. S., & Tsvetkov, D. Y. 2007, Astron. Lett., 33, 715 [NASA ADS] [CrossRef] [Google Scholar]
- Minkowski, R. 1941, PASP, 53, 224 [NASA ADS] [CrossRef] [Google Scholar]
- Modjaz, M., Kewley, L., Kirshner, R. P., et al. 2008, AJ, 135, 1136 [NASA ADS] [CrossRef] [Google Scholar]
- Moriya, T. J., Pruzhinskaya, M. V., Ergon, M., & Blinnikov, S. I. 2016, MNRAS, 455, 423 [NASA ADS] [CrossRef] [Google Scholar]
- Morrissey, P., Conrow, T., Barlow, T. A., et al. 2007, ApJS, 173, 682 [NASA ADS] [CrossRef] [Google Scholar]
- Mould, J. R., Huchra, J. P., Freedman, W. L., et al. 2000, ApJ, 529, 786 [NASA ADS] [CrossRef] [Google Scholar]
- Müller, T., Prieto, J. L., Pejcha, O., & Clocchiatti, A. 2017, ApJ, 841, 127 [NASA ADS] [CrossRef] [Google Scholar]
- Nakar, E., & Sari, R. 2010, ApJ, 725, 904 [NASA ADS] [CrossRef] [Google Scholar]
- Nomoto, K., Suzuki, T., Shigeyama, T., et al. 1993, Nature, 364, 507 [NASA ADS] [CrossRef] [Google Scholar]
- Nordgren, T. E., Chengalur, J. N., Salpeter, E. E., & Terzian, Y. 1997, AJ, 114, 913 [NASA ADS] [CrossRef] [Google Scholar]
- Olivares, F., Hamuy, M., Pignata, G., et al. 2010, ApJ, 715, 833 [NASA ADS] [CrossRef] [Google Scholar]
- Pastorello, A., Valenti, S., Zampieri, L., et al. 2009, MNRAS, 394, 2266 [NASA ADS] [CrossRef] [Google Scholar]
- Pastorello, A., Cappellaro, E., Inserra, C., et al. 2013, ApJ, 767, 1 [NASA ADS] [CrossRef] [Google Scholar]
- Peeples, M. S., & Shankar, F. 2011, MNRAS, 417, 2962 [NASA ADS] [CrossRef] [Google Scholar]
- Pejcha, O., & Prieto, J. L. 2015a, ApJ, 799, 215 [NASA ADS] [CrossRef] [Google Scholar]
- Pejcha, O., & Prieto, J. L. 2015b, ApJ, 806, 225 [NASA ADS] [CrossRef] [Google Scholar]
- Pérez-Montero, E. 2014, MNRAS, 441, 2663 [NASA ADS] [CrossRef] [Google Scholar]
- Petrosian, A., Navasardyan, H., Cappellaro, E., et al. 2005, AJ, 129, 1369 [NASA ADS] [CrossRef] [Google Scholar]
- Phillips, M. M., Simon, J. D., Morrell, N., et al. 2013, ApJ, 779, 38 [NASA ADS] [CrossRef] [Google Scholar]
- Pilyugin, L. S., Grebel, E. K., & Kniazev, A. Y. 2014, AJ, 147, 131 [NASA ADS] [CrossRef] [Google Scholar]
- Pols, O. R., Schröder, K.-P., Hurley, J. R., Tout, C. A., & Eggleton, P. P. 1998, MNRAS, 298, 525 [NASA ADS] [CrossRef] [Google Scholar]
- Polshaw, J., Kotak, R., Dessart, L., et al. 2016, A&A, 588, A1 [NASA ADS] [CrossRef] [EDP Sciences] [Google Scholar]
- Popov, D. V. 1993, ApJ, 414, 712 [Google Scholar]
- Potashov, M., Blinnikov, S., Baklanov, P., & Dolgov, A. 2013, MNRAS, 431, L98 [NASA ADS] [CrossRef] [Google Scholar]
- Prieto, J. L., Stanek, K. Z., & Beacom, J. F. 2008, ApJ, 673, 999 [NASA ADS] [CrossRef] [Google Scholar]
- Prieto, J. L., Sellgren, K., Thompson, T. A., & Kochanek, C. S. 2009, ApJ, 705, 1425 [NASA ADS] [CrossRef] [Google Scholar]
- Prieto, J. L., Lee, J. C., Drake, A. J., et al. 2012, ApJ, 745, 70 [NASA ADS] [CrossRef] [Google Scholar]
- Prieto, J. L., Brimacombe, J., Drake, A. J., & Howerton, S. 2013, ApJ, 763, L27 [NASA ADS] [CrossRef] [Google Scholar]
- Prieto, J. L., Krühler, T., Anderson, J. P., et al. 2016, ApJ, 830, L32 [NASA ADS] [CrossRef] [Google Scholar]
- Rabinak, I., & Waxman, E. 2011, ApJ, 728, 63 [NASA ADS] [CrossRef] [Google Scholar]
- Renzo, M., Zapartas, E., de Mink, S. E., et al. 2019, A&A, 624, A66 [NASA ADS] [CrossRef] [EDP Sciences] [Google Scholar]
- Rodríguez, Ó., Clocchiatti, A., & Hamuy, M. 2014, AJ, 148, 107 [NASA ADS] [CrossRef] [Google Scholar]
- Rodríguez, Ó., Pignata, G., Hamuy, M., et al. 2019, MNRAS, 483, 5459 [NASA ADS] [CrossRef] [Google Scholar]
- Rojas-Arriagada, A., Zoccali, M., Schultheis, M., et al. 2019, A&A, 626, A16 [NASA ADS] [CrossRef] [EDP Sciences] [Google Scholar]
- Rubin, A., Gal-Yam, A., De Cia, A., et al. 2016, ApJ, 820, 33 [NASA ADS] [CrossRef] [Google Scholar]
- Sana, H., de Mink, S. E., de Koter, A., et al. 2012, Science, 337, 444 [Google Scholar]
- Sana, H. 2017, Proc. IAU Symp., 329, 110 [NASA ADS] [Google Scholar]
- Sánchez, S. F., Rosales-Ortega, F. F., Marino, R. A., et al. 2012, A&A, 546, A2 [NASA ADS] [CrossRef] [EDP Sciences] [Google Scholar]
- Sánchez, S. F., Rosales-Ortega, F. F., Iglesias-Páramo, J., et al. 2014, A&A, 563, A49 [NASA ADS] [CrossRef] [EDP Sciences] [Google Scholar]
- Sánchez-Menguiano, L., Sánchez, S. F., Pérez, I., et al. 2016, A&A, 587, A70 [NASA ADS] [CrossRef] [EDP Sciences] [Google Scholar]
- Sanders, N. E., Soderberg, A. M., Gezari, S., et al. 2015, ApJ, 799, 208 [NASA ADS] [CrossRef] [Google Scholar]
- Sapir, N., & Waxman, E. 2017, ApJ, 838, 130 [NASA ADS] [CrossRef] [Google Scholar]
- Sarangi, A., & Cherchneff, I. 2015, A&A, 575, A95 [NASA ADS] [CrossRef] [EDP Sciences] [Google Scholar]
- Schlafly, E. F., & Finkbeiner, D. P. 2011, ApJ, 737, 103 [NASA ADS] [CrossRef] [Google Scholar]
- Schlegel, E. M. 1990, MNRAS, 244, 269 [NASA ADS] [Google Scholar]
- Schmidt, B. P., Kirshner, R. P., & Eastman, R. G. 1992, ApJ, 395, 366 [NASA ADS] [CrossRef] [Google Scholar]
- Schnurr, O., Moffat, A. F. J., St-Louis, N., Morrell, N. I., & Guerrero, M. A. 2008, MNRAS, 389, 806 [NASA ADS] [CrossRef] [Google Scholar]
- Seitenzahl, I. R., Timmes, F. X., & Magkotsios, G. 2014, ApJ, 792, 10 [NASA ADS] [CrossRef] [Google Scholar]
- Shappee, B. J., Prieto, J. L., Grupe, D., et al. 2014, ApJ, 788, 48 [NASA ADS] [CrossRef] [Google Scholar]
- Sheth, K., Regan, M., Hinz, J. L., et al. 2010, PASP, 122, 1397 [NASA ADS] [CrossRef] [Google Scholar]
- Silva, M. D. V., & Napiwotzki, R. 2011, MNRAS, 411, 2596 [NASA ADS] [CrossRef] [Google Scholar]
- Silverman, J. M., Pickett, S., Wheeler, J. C., et al. 2017, MNRAS, 467, 369 [NASA ADS] [Google Scholar]
- Smartt, S. J. 2015, PASA, 32, e016 [NASA ADS] [CrossRef] [Google Scholar]
- Smartt, S. J., Eldridge, J. J., Crockett, R. M., & Maund, J. R. 2009, MNRAS, 395, 1409 [NASA ADS] [CrossRef] [Google Scholar]
- Smartt, S. J., Valenti, S., Fraser, M., et al. 2015, A&A, 579, A40 [NASA ADS] [CrossRef] [EDP Sciences] [Google Scholar]
- Smith, N., Mauerhan, J. C., & Prieto, J. L. 2014, MNRAS, 438, 1191 [NASA ADS] [CrossRef] [Google Scholar]
- Smith, N., Andrews, J. E., & Mauerhan, J. C. 2016, MNRAS, 463, 2904 [NASA ADS] [CrossRef] [Google Scholar]
- Stathakis, R. A., & Sadler, E. M. 1991, MNRAS, 250, 786 [NASA ADS] [Google Scholar]
- Stoll, R., Prieto, J. L., Stanek, K. Z., & Pogge, R. W. 2013, ApJ, 773, 12 [NASA ADS] [CrossRef] [Google Scholar]
- Sukhbold, T., Ertl, T., Woosley, S. E., Brown, J. M., & Janka, H.-T. 2016, ApJ, 821, 38 [Google Scholar]
- Szalai, T., Zsíros, S., Fox, O. D., et al. 2019, ApJS, 241, 38 [NASA ADS] [CrossRef] [Google Scholar]
- Takáts, K., & Vinkó, J. 2012, MNRAS, 419, 2783 [NASA ADS] [CrossRef] [Google Scholar]
- Takáts, K., Pumo, M. L., Elias-Rosa, N., et al. 2014, MNRAS, 438, 368 [NASA ADS] [CrossRef] [Google Scholar]
- Tartaglia, L., Sand, D. J., Valenti, S., et al. 2018, ApJ, 853, 62 [NASA ADS] [CrossRef] [Google Scholar]
- Terreran, G., Jerkstrand, A., Benetti, S., et al. 2016, MNRAS, 462, 137 [NASA ADS] [CrossRef] [Google Scholar]
- Turatto, M., Benetti, S., & Pastorello, A. 2007, Supernova 1987A: 20 Years After: Supernovae and Gamma-Ray Bursters, 937, 187 [NASA ADS] [CrossRef] [Google Scholar]
- Uomoto, A. 1986, ApJ, 310, L35 [NASA ADS] [CrossRef] [Google Scholar]
- Utrobin, V. P., & Chugai, N. N. 2009, A&A, 506, 829 [NASA ADS] [CrossRef] [EDP Sciences] [Google Scholar]
- Valenti, S., Sand, D., Pastorello, A., et al. 2014, MNRAS, 438, L101 [Google Scholar]
- Valenti, S., Sand, D., Stritzinger, M., et al. 2015, MNRAS, 448, 2608 [NASA ADS] [CrossRef] [Google Scholar]
- Valenti, S., Howell, D. A., Stritzinger, M. D., et al. 2016, MNRAS, 459, 3939 [NASA ADS] [CrossRef] [Google Scholar]
- Van Dyk, S. D., Peng, C. Y., Barth, A. J., & Filippenko, A. V. 1999, AJ, 118, 2331 [NASA ADS] [CrossRef] [Google Scholar]
- van Zee, L., & Haynes, M. P. 2006, ApJ, 636, 214 [NASA ADS] [CrossRef] [Google Scholar]
- Weilbacher, P. M., Streicher, O., Urrutia, T., et al. 2014, Astron. Data Anal. Softw. Syst. XXIII, 485, 451 [Google Scholar]
- Xiao, L., Stanway, E. R., & Eldridge, J. J. 2018, MNRAS, 477, 904 [NASA ADS] [CrossRef] [Google Scholar]
- Yaron, O., Perley, D. A., Gal-Yam, A., et al. 2017, Nat. Phys., 13, 510 [NASA ADS] [CrossRef] [Google Scholar]
- Yoachim, P., & Dalcanton, J. J. 2008, ApJ, 683, 707 [NASA ADS] [CrossRef] [Google Scholar]
- Zapartas, E., de Mink, S. E., Izzard, R. G., et al. 2017, A&A, 601, A29 [NASA ADS] [CrossRef] [EDP Sciences] [Google Scholar]
- Zhang, J., & Wang, X. 2014, ATel, 6601 [Google Scholar]
- Zinn, P.-C., Grunden, P., & Bomans, D. J. 2011, A&A, 536, A103 [NASA ADS] [CrossRef] [EDP Sciences] [Google Scholar]
Appendix A: Photometry
Here we describe the photometric pipeline used to derive the magnitudes of ASASSN-14jb in the standard system. For each frame previously reduced we do the following steps to obtain the aperture photometry for the supernova:
-
We run SExtractor (Bertin & Arnouts 1996) to obtain an initial estimate for the FWHM of the stars in the image, using bright stars far from the edges of the frame, and global background level.
-
We re-run SExtractor using the initial estimates and fixing the aperture to 1.6 times the median FWHM of the stars. After cross-matching this catalog with our local standard star catalog we reject the standard objects that have photometric uncertainties
 .
. -
With the zero-point and uncertainty for each local standard star (no color term)
 we calculate the mean zero-point of the image ZP = ⟨Δm⟩ with its final error including both statistical photometric uncertainties and the rms of the zero-point. The typical value of the light curves deviations were ≲0.02 mag.
 (A.1)
(A.1)So with this the final photometry of the supernova and its variance are:
 (A.2)
(A.2) -
Regarding color terms, as it is showed in Valenti et al. (in prep.)11, the only significant color term for LCOGT cameras in observations obtained in the BVgri filters are on the g-band. We applied this correction using the g − r color but with the r-band magnitudes only corrected trough a mean zero-point term. That is, we follow the equations:
 (A.3)
(A.3)with the corresponding error propagation. The g-band color term correction obtained was important only at early times when the SN is bluest.
To verify our results from aperture photometry, we ran PSF fitting photometry through our pipeline using the softwares DOPHOT and DAOPHOT in IRAF for selected frames, and in both cases we obtained consistent results. We chose the SExtractor aperture photometry because it was the most robust method. The PSF photometry of DOPHOT was limited because of the fixed gaussian profile shape and DAOPHOT required too much tuning of the parameters to obtain good results on frames that had significant sky variations or were noiser than average.
Appendix B: P-Cygni profile fitting
Expansion velocities were estimated using the velocity shift at maximum absorption in the, continuum normalized, P-Cygni profiles. For a given supernova we took each individual spectrum Fλ and, after masking the regions for the strong lines Hα and Hβ and Na I λλ5890, 5896 a black body is fit. If the spectra is after 20 days past explosion the range λ < 5100 Å is also removed to avoid the contamination from line blanketing. Also a simple power law is fit and if the residuals in this case are better this fit is adopted as the continuum FC. After estimating the continuum FC the spectra and wavelength is normalized as  , where the 0 subscript refers to the line position (e.g., λ0 = 6563 Å for Hα).
To find a minima of a profile throughout a polinomial fitting, a function written in Python code was created. If no initial guess is given for the maximum absorption velocity v* (or equivalently λ* = λ0 + λ0v0/c) first the data is smoothed with a high degree polinomial to find a guess. Then a new fitting window is defined, centered on the this guess, and a new low degree polinomial (from 2 up to 8) is fit to find a new minima. In this final fit a weighting is applied to the data to avoid problems on the defined edges of the fitting window and the adopted guess. This weighting goes on the residuals as :
 (B.1)
(B.1)
The e-fold scale sx is used to only consider the points more closed to the assumed profile minima. For the sample of this work a systematic error was considered using different values for sx of 10, 50 and 100 Å, at least. This procedure effectively measures how biased is the chosen minima x*. See Fig. B.1 for an example fit.
We estimate a global statistical error, for each sx, using a Jacknife procedure, where each data point is masked before fitting and a mean and standard deviation are obtained from the distribution.
 |
Fig. B.1. Example of a P-Cygni profile fit. The x-axis is in units of 1000 km s−1. The blue dots are the data points for the normalized spectra and the red points are the points actually used for the fitting procedure. The vertical line marks the position of the final velocity adopted and the cyan vertical indicates zero velocity at the line position. |
Appendix C: Distance measurement
The methods for Type II SNe distance measurement can be categorized in theoretically based, such as the expanding photosphere method (EPM, Kirshner & Kwan 1974; Schmidt et al. 1992) or the spectra-fitting expanding atmosphere method (SEAM, Baron et al. 2004), and purely empirical such as the standard candle method (SCM, Hamuy & Pinto 2002), the Photospheric Magnitude Method (PMM Rodríguez et al. 2014, 2019, henceforth R14; R18) or the photometric color method (DJ17 de Jaeger et al. 2017).
We computed distances to ASSASN-14jb using the three empirical ones. We did not applied K-corrections since the low redshift of the source makes them very small (e.g., less than 0.01 mag for the V-band).
Photospheric Magnitude Method
The PMM is a method to measure distances to Type II SNe that relies on a time-variable standardization of the photospheric magnitude evolution. This method can be viewed as a generalization for various epochs of the SCM (Hamuy & Pinto 2002) in the sense that both rely on the physical connection between the expansion velocity (a measure of the explosion energy) and the plateau luminosity, but the PMM has a different approach in the calibration. For a distance to be measured we need a good constraint on the shock-breakout epoch, magnitudes corrected from both host and local extinction and corrected by the K-correction, and expansion velocities inferred from the minima of the P-Cygni profiles (usually from the Fe II lines) in the photospheric phase. Explicitly we have,
 (C.1)
(C.1)
where  is the rest-frame and extinction corrected magnitude at the wavelength λ, ℳλ is the photospheric magnitude, ℛ is the factor that considers the surface area of the photosphere and depends on the photospheric radius, which for homologous expansion is simply the product of photospheric velocity vph and the time since the beginning of the expansion t − t0 (see R14 for details). Although we have named t0 the “explosion epoch”, this reference time is actually associated with the shock breakout. As our constraint on t0 is on the order of the shock propagation time to reach a RSG surface after core-collapse (Arnett 1996) we do not make an explicit distinction. We have measured the velocities of ASASSN-14jb from the Fe II λ5169 line (see Fig. 10) and the extinction corrected magnitudes in the V-band without applying a K-correction. Averaging the distances obtained at the three epochs with Fe II λ5169 velocities, we obtain an average distance modulus of ⟨μ⟩PMM = 31.94 ± 0.06 mag.
To make a direct comparison of the distance measurements of other methods we need consider that the PMM was calibrated using local distance ladder measurements, so the method carries an implicit value of the Hubble constant. As the value used by R14 is H0 = 68 km s−1 Mpc−1 for the V-band calibration, we will take this value as reference in the following analysis. We also use now the CMB frame redshift of zCMB = 0.00505 for the ASASSN-14jb host (Mould et al. 2000).
Standard Candle Method
The most common method to measure Type IIP like distances is the SCM which relies on the tight correlation between brightness and the expansion velocity at a given epoch in the plateau phase. Similar to the Type Ia SNe calibrations, the SCM parameters are fit directly in the Hubble diagram following the model (Hamuy & Pinto 2002),
 (C.2)
(C.2)
where Mλk is the absolute magnitude in the k-band, vph is the photospheric velocity, usually at 50 days, and (α, β) are the parameters to fit using a statistically significant sample. The distance modulus in the DJ17 prescription takes the form,
 (C.3)
(C.3)
We use the parameters obtained in DJ17 for the SDSS i, (r − i) color combination12. With the interpolated velocity in Hβ at 40 days, using a power law model, of v(Hβ) = 4181 ± 146 km s−1 and the color at 45 days (r − i)0 = 0.03 ± 0.13 mag, the distance modulus is μSCM = 32.17 ± 0.20 mag.
Photometric color method
The PCM, presented in de Jaeger et al. (2015), exploits the correlation between the light curve decline rate at the plateau, s2, and the luminosity (Anderson et al. 2014a). In this method the distance modulus is obtained via,
 (C.4)
(C.4)
where the values of the parameters taken from DJ17 are αPCM = 0.39 ± 0.08, βPCM = 0.8 ± 0.48, ℳPCM = − 0.84 ± 0.08. Measuring the slope in the i-band light curve we find s2, i = − 0.365 ± 0.187. With the corresponding color (r − i)0 = 0.027 ± 0.16 we obtain μPCM = 32.4 ± 0.2 mag.
All Tables
ASAS-SN V-band photometry of ASASSN-14jb, including pre-discovery and post-plateau upper limits.
Relevant information of the SN II in the literature used for comparison with ASASSN-14jb.
All Figures
|
Fig. 1. r-band image of the field of ASASSN-14jb from LCOGTN. The circles show the position of ASASSN-14jb, the local photometric standards (numbered 1–10), and the nearby SN 2009ip in NGC 7259. The zoom around the position of ASASSN-14jb and its host galaxy, ESO 467-G051, is a synthetic r-band image obtained from the MUSE datacube. The MUSE image field of view is of 1.5 × 1.0 arcmin. |
| In the text | |
|
Fig. 2. ASAS-SN V, LCOGTN BVgri, and Swift/UVOT w2, m1, w1, ubv, light curves of ASASSN-14jb. Each band has been shifted to the value showed in the label for presentation purposes. The observed time is given in days since the estimated explosion epoch t0 = 56946.1 (MJD) in the bottom x-axis and in MJD in the top axis. The black squares are the non-detection derived from the ASAS-SN V-band images. |
| In the text | |
|
Fig. 3. B and V photometry from Fig. 2, combined with the EFOSC late time photometry. The 56Co → 56Fe decay slope is also showed. |
| In the text | |
|
Fig. 4. Full rest frame spectroscopic time series, on a logarithmic scale, for ASASSN-14jb in the photospheric phase (up to 80 days past explosion). The time next to each spectrum, in days, is measured since the estimated time of explosion t0 = 56946.1 ± 3 (MJD). The vertical lines show the wavelengths of the some of the main features in the spectra of type II SNe. Lines with the ⨁ symbol represent the position of strong telluric absorptions. |
| In the text | |
|
Fig. 5. Absolute V-band magnitude evolution for ASASSN-14jb (black filled stars) and the comparison sample of Type II SNe as a function of days after their estimated time of explosion. See Table 5 for the references for each SNe, including the adopted distance and reddening. |
| In the text | |
|
Fig. 6. Extinction corrected B − V colors for ASASSN-14jb (black filled stars) and the comparison sample of Type II SNe. The reddening values used are given in Table 5. |
| In the text | |
|
Fig. 7. Extinction corrected V − i, g − i, r − i and g − r colors for ASASSN-14jb (black filled stars) and the Type II SNe comparison sample. The reddening values used are given in Table 5. |
| In the text | |
|
Fig. 8. Comparison of rest-frame photospheric phase spectra at ≈60 days after explosion. The spectra are not corrected for extinction. |
| In the text | |
|
Fig. 9. Evolution of the Hβ (left), Fe II λ5169 (middle) and Hα (right) line profiles, in velocity space, as a function of time after explosion t0 = 56946.1 ± 3 (MJD), in the plateau phase for ASASSN-14jb (up to 80 days past explosion). In each panel, a vertical dashed line indicates zero velocity. |
| In the text | |
|
Fig. 10. Expansion velocities of the Hβ (top), Fe II λ5169 (middle), and Hα (bottom) lines as a function of time after explosion in the plateau phase, measured from the P-cygni profile minima of the Balmer lines Hα, Hβ and the Fe II λ5169 line for ASASSN-14jb (black filled stars) and the Type II SNe comparison sample. |
| In the text | |
|
Fig. 11. Comparison of nebular spectra of observed Type II SNe at ≈400 days past explosion. |
| In the text | |
|
Fig. 12. Distance modulus estimates for ASASSN-14jb using PMM, SCM, and PCM methods (green dots). The black triangle is the distance modulus from the host galaxy redshift and a Hubble law with H0 = 68 km s−1 Mpc−1, with a dispersion of 200 km s−1 as a reference error for the CMB frame redshift. The purple diamond is the average from the Tully-Fisher measurements obtained from the NED database, all normalized to H0 = 68 km s−1 Mpc−1. The thick blue line is the adopted distance modulus in this work, μ = 32.00 ± 0.18, obtained as the weighted average of the PMM, SCM and PCM methods and the standard deviation is showed as a blue fill. We also show as a reference the distance measured to SN 2009ip in NGC 7259 as a red square with its corresponding error (Potashov et al. 2013). |
| In the text | |
|
Fig. 13. Black-body temperature (blue dots) and radius evolution (red dots) as inferred from the SED of Swift data. The light blue and red squares show the temperature and radius evolution assuming a blackbody. The SED was corrected by a reddening value of E(B − V) = 0.0154 ± 0.001 mag and with RV = 3.1. The horizontal line indicates the kT = 1 eV level, where recombination is expected to become relevant afterwards. The vertical black solid line indicates the assumed explosion epoch at MJD 56946.1 ± 3 and the vertical dashed lines is at the assumed offset (Δt0 = −1.75) in the explosion epoch, for the optimal cooling model from RW11. The red dashed lines shows a power-law fit to the photospheric radii (only using the data points with kTph > 1eV) while the blues dashed lines shows the same for the Temperatures. The black curved dashed lines are the fits assuming the RW11 model for Tph and Rph. |
| In the text | |
|
Fig. 14. Comparison of bolometric light curves using the bolometric corrections of Pejcha & Prieto (2015b). Each SN was corrected for extinction. See Table 5 for the references of the comparison sample. |
| In the text | |
|
Fig. 15. Bolometric light curves in the radioactive tail derived from the B and V-band photometry from EFOSC imaging, using the bolometric corrections of Pejcha & Prieto (2015a; PP15, blue dots) and Bersten & Hamuy (2009; MH09, green squares). The decay is faster than the expected from full trapping of 56Co decay (showed as a dashed black line). The non-full trapping model from Clocchiatti & Wheeler (1997) gives a 56Ni Mass of 0.0210 ± 0.0025 M⊙ for the Pejcha & Prieto (2015a) bolometric corrections. The time scale for this fit is T0 = 319 ± 33 days, which corresponds to a ejecta mass of 12 M⊙ for an explosion energy of 1 foe. |
| In the text | |
|
Fig. 16. Comparison of the nebular spectra of ASASSN-14jb with the NLTE models of Dessart et al. (2013) at ≈400 days past explosion. The vertical dashed lines shows the rest wavelength of Hα and the [O I] λλ6300, 6364 doublet. |
| In the text | |
|
Fig. 17. Comparison of the nebular spectra of ASASSN-14jb with the NLTE models of Jerkstrand et al. (2014, 2018) at ≈400 days past explosion. The vertical dashed lines shows the rest wavelength of Hα and the [O I] λλ6300, 6364 doublet. |
| In the text | |
|
Fig. 18. Measurements of the pseudo-equivalent width of the Fe II λ5018 line for ASASSN-14jb (black stars), with the correspondent epoch since explosion t0 = 56946.1 ± 3 (MJD). The solid lines show Dessart et al. (2013) models for progenitors with different metallicities and the dashed lines show models with Solar metallicity and different initial radii. |
| In the text | |
|
Fig. 19. Histogram with the distribution of absolute Ks-band magnitudes of the host galaxies of 94 Type II SNe discovered by ASAS-SN in 2013–2017 (Holoien et al. 2017a,b,c, 2019). The dashed vertical line marks the absolute magnitude of the host galaxy of ASASSN-14jb, ESO 467-G051, indicating a relatively low stellar mass for a Type II SN host in this sample. |
| In the text | |
|
Fig. 20. Hα MUSE map of the host galaxy and the supernova explosion site. Black circles marks the position of the H II regions, from the MUSE data of the host galaxy, detected with H II-Explorer. Coordinates are the right ascension and declination offsets from the center of ESO 467-G051, in arcminutes. The 1 kpc scale of the image is marked in the upper left. |
| In the text | |
|
Fig. 21. D16 (top) and O3N2 (bottom) oxygen abundance maps of the host galaxy ESO467-G051 as seen by MUSE, shifting the D16 map by +0.4 dex to provide an easier comparison. Coordinates are the right ascension and declination offsets from the center of ESO 467-G051, in arc-minutes. The 1 kpc scale of the image is marked in the upper left. |
| In the text | |
|
Fig. 22. Distribution of the gas-phase oxygen abundances used for ESO 467-G051 H II regions, based on the D16, O3N2 and N2 calibrations. The dashed lines represent the median for each distribution and the black vertical line indicates the average abundance for Type II SNe hosts from the PISCO compilation using the D16 calibration (Galbany et al. 2018). |
| In the text | |
|
Fig. 23. Oxygen abundances versus N/O ratios obtained with the code developed in Pérez-Montero (2014). Each point has the errorbars delivered by the code and each point is colored according to the ionization parameter U delivered. The solid orange line indicates the relation as assumed in the D16 calibration and the blue dots correspond to the observed values for our H II regions abundances using D16. The dashed lines indicate the asymptotes for orange line, at the very high and very low O/H ratios regimes. |
| In the text | |
|
Fig. 24. Metalicity gradient obtained from the extraplanar H II-regions from Howk et al. (2018a) and from ASASSN-14jb, as a function of the vertical distance to the disk normalized by the isophotal radius R25. The metallicity offset from ASASSN-14jb was obtained from measurements of the Fe II λ5018 line pEW and the calculated mean oxygen abundance of the host, ESO467-G051, from the O3N2 diagnostic. We also estimated the oxygen abundance at the supernova position extrapolating the vertical gradient obtained from our H II-region abundances using the regions at any azimuthal position, dubbed “linear”, and from a two dimensional model, dubbed “planar”, which are marked as a black triangle and square, respectively. |
| In the text | |
|
Fig. B.1. Example of a P-Cygni profile fit. The x-axis is in units of 1000 km s−1. The blue dots are the data points for the normalized spectra and the red points are the points actually used for the fitting procedure. The vertical line marks the position of the final velocity adopted and the cyan vertical indicates zero velocity at the line position. |
| In the text | |
Current usage metrics show cumulative count of Article Views (full-text article views including HTML views, PDF and ePub downloads, according to the available data) and Abstracts Views on Vision4Press platform.
Data correspond to usage on the plateform after 2015. The current usage metrics is available 48-96 hours after online publication and is updated daily on week days.
Initial download of the metrics may take a while.