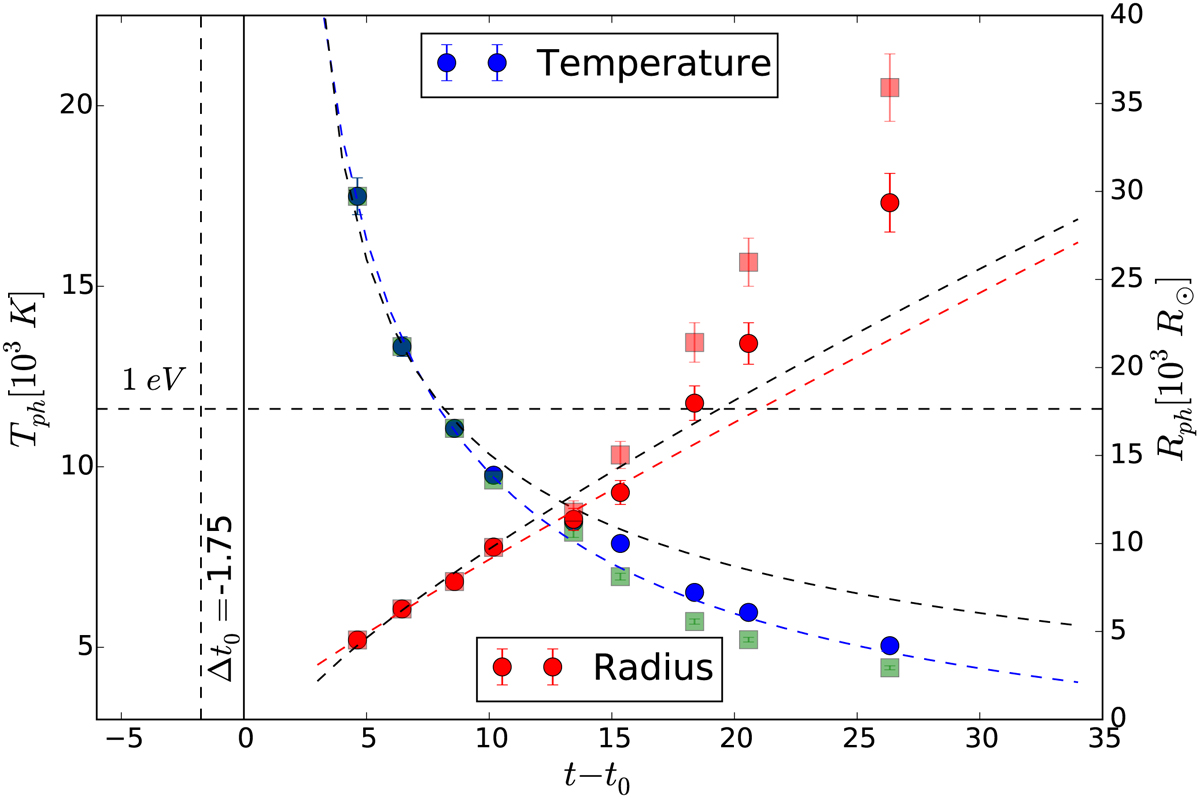
Fig. 13.

Black-body temperature (blue dots) and radius evolution (red dots) as inferred from the SED of Swift data. The light blue and red squares show the temperature and radius evolution assuming a blackbody. The SED was corrected by a reddening value of E(B − V) = 0.0154 ± 0.001 mag and with RV = 3.1. The horizontal line indicates the kT = 1 eV level, where recombination is expected to become relevant afterwards. The vertical black solid line indicates the assumed explosion epoch at MJD 56946.1 ± 3 and the vertical dashed lines is at the assumed offset (Δt0 = −1.75) in the explosion epoch, for the optimal cooling model from RW11. The red dashed lines shows a power-law fit to the photospheric radii (only using the data points with kTph > 1eV) while the blues dashed lines shows the same for the Temperatures. The black curved dashed lines are the fits assuming the RW11 model for Tph and Rph.
Current usage metrics show cumulative count of Article Views (full-text article views including HTML views, PDF and ePub downloads, according to the available data) and Abstracts Views on Vision4Press platform.
Data correspond to usage on the plateform after 2015. The current usage metrics is available 48-96 hours after online publication and is updated daily on week days.
Initial download of the metrics may take a while.


