| Issue |
A&A
Volume 699, July 2025
|
|
|---|---|---|
| Article Number | A169 | |
| Number of page(s) | 26 | |
| Section | Extragalactic astronomy | |
| DOI | https://doi.org/10.1051/0004-6361/202553687 | |
| Published online | 04 July 2025 | |
Expanding the parameter space of 2002es-like type Ia supernovae: On the underluminous ASASSN-20jq/SN 2020qxp
1
Department of Physics and Astronomy, Aarhus University, Ny Munkegade 120, DK-8000
Aarhus C, Denmark
2
Department of Astronomy, The Ohio State University, 140 W. 18th Avenue, Columbus, OH, 43210
USA
3
Center for Cosmology and AstroParticle Physics (CCAPP), The Ohio State University, 191 W. Woodruff Avenue, Columbus, OH, 43210
USA
4
Institute for Astronomy, University of Hawaiì at Manoa, 2680 Woodlawn Drive, Honolulu, HI, 96822
USA
5
Planetary Science Institute, 1700 E Fort Lowell Rd., Ste 106, Tucson, AZ, 85719
USA
6
Hamburger Sternwarte, Gojensbergweg 112, 21029
Hamburg, Germany
7
Department of Physics, Florida State University, 77 Chieftain Way, Tallahassee, FL, 32306
USA
8
Institute of Space Sciences (ICE, CSIC), Campus UAB, Carrer de Can Magrans, s/n, E-08193
Barcelona, Spain
9
Institut d’Estudis Espacials de Catalunya (IEEC), E-08034
Barcelona, Spain
10
Post Astronomy, Lexington, MA, USA
11
INAF – Osservatorio Astronomico di Brera, Via E. Bianchi 46, I-23807
Merate (LC), Italy
12
INAF – Osservatorio Astronomico di Padova, Vicolo dell’Osservatorio 5, I-35122
Padova, Italy
13
Department of Astronomy and The Oskar Klein Centre, AlbaNova University Center, Stockholm University, 106 91
Stockholm, Sweden
14
School of Physics, The University of Melbourne, VIC, 3010
Australia
15
Department of Astronomy and Astrophysics, University of California, Santa Cruz, CA, 95064
USA
16
Pontificia Universidad Católica de Chile, Vicuña Mackenna 4860
Macul, Santiago, Chile
17
Institut für Theoretische Physik, Goethe Universität, Max-von-Laue-Str. 1, 60438
Frankfurt am Main, Germany
18
Institut d’Estudis Espacials de Catalunya (IEEC), Edifici RDIT, Campus UPC, 08860
Castelldefels, (Barcelona), Spain
19
Sorbonne Université, CNRS/IN2P3, LPNHE, F-75005
Paris, France
20
Carnegie Observatories, Las Campanas Observatory, Casilla 601, La Serena, Chile
⋆ Corresponding authors: This email address is being protected from spambots. You need JavaScript enabled to view it.
, This email address is being protected from spambots. You need JavaScript enabled to view it.
Received:
6
January
2025
Accepted:
22
April
2025
Abstract
We present optical photometric and spectroscopic observations of the peculiar Type Ia supernovae (SNe Ia) ASASSN-20jq/SN 2020qxp. It is a low-luminosity object, with a peak absolute magnitude of MB = −17.1 ± 0.5 mag, while its post-peak light-curve decline rate of Δm15(B) = 1.35 ± 0.09 mag and color-stretch parameter of sBV ⪆ 0.82 is similar to that of normal luminosity SNe Ia. That makes it a prevalent outlier in both the SN Ia luminosity-width and the luminosity-color-stretch relations. The analysis of the early light curves indicates a possible “bump” during the first ≈1.4 days of explosion. ASASSN-20jq synthesized a low radioactive 56Ni mass of 0.09 ± 0.01 M⊙. The near-maximum light spectra of the supernova show strong Si II absorption lines, indicating a cooler photosphere than normal SNe Ia; however, it lacks Ti II absorption lines. Additionally, it shows unusually strong absorption features of O Iλ7773 and the Ca II near-infrared triplet. The nebular spectra of ASASSN-20jq show a remarkably strong but narrow forbidden [Ca II] λλ7291, 7324 doublet emission that has not been seen in SNe Ia except for a handful of Type Iax events. There is also a marginal detection of the [O I] λλ6300, 6364 doublet emission in nebular spectra, which is extremely rare. Both the [Ca II] and [O I] lines are redshifted by roughly 2000 km s−1. ASASSN-20jq also exhibits a strong [Fe II] λ7155 emission line with a tilted-top line profile, which is identical to the [Fe II] λ16433 line profile. The asymmetric [Fe II] line profiles, along with the redshifted [Ca II] and emission lines, suggest a high central density white dwarf progenitor that underwent an off-center delayed-detonation explosion mechanism, synthesizing roughly equal amounts of 56Ni during the deflagration and detonation burning phases. The equal production of 56Ni in both burning phases distinguishes ASASSN-20jq from normal bright and subluminous SNe Ia. Assuming this scenario, we simultaneously modeled the optical and near-infrared nebular spectra, achieving a good agreement with the observations. The light curve and spectroscopic features of ASASSN-20jq do not align with any single sub-class of SNe Ia. However, the significant deviation from the luminosity versus light-curve shape relations (along with several light-curve and spectroscopic features) exhibits similarities to some 2002es-like objects. Therefore, we have identified ASASSN-20jq as an extreme candidate within the broad and heterogeneous parameter space of 2002es-like SNe Ia.
Key words: supernovae: general / white dwarfs / supernovae: individual: ASASSN-20jq / supernovae: individual: SN2020qxp / galaxies: individual: NGC 5002
© The Authors 2025
 Open Access article, published by EDP Sciences, under the terms of the Creative Commons Attribution License (https://creativecommons.org/licenses/by/4.0), which permits unrestricted use, distribution, and reproduction in any medium, provided the original work is properly cited.
This article is published in open access under the Subscribe to Open model. This email address is being protected from spambots. You need JavaScript enabled to view it. to support open access publication.
1. Introduction
Type Ia supernovae (SNe Ia) are quintessential distance indicators used to map the expansion history of the Universe (Hubble 1926). These objects arise from the thermonuclear disruption of one or more carbon-oxygen white dwarf (WD) stars in a binary system (for contemporary reviews, see Maoz et al. 2014; Liu et al. 2023, and references therein). As the WD approaches the Chandrasekhar limit, a thermonuclear runaway ensues, leading to the disruption of the WD. In the process, significant amounts of radioactive 56Ni are synthesized, feeding the emission of the bright optical transients, which typically reach peak absolute B-band magnitudes of MB ≳ −19 ± 1 (e.g., Hamuy et al. 1996a). Given their high intrinsic peak brightness and apparent uniformity, SNe Ia were considered to be an ideal luminosity-distance indicator. However, with the discovery of the subluminous SNe 1991bg (Filippenko et al. 1992a; Leibundgut et al. 1993) and the overluminous SN 1991T (Filippenko et al. 1992a; Phillips et al. 1992), it became clear SNe Ia exhibit a considerable diversity among the key observational parameters, including both the peak luminosities and colors (e.g., Hamuy et al. 1994).
Fortunately, along with expanded samples of SNe Ia (e.g., Hamuy et al. 1996b; Riess et al. 1999), empirical relations were teased out of the data (Pskovskii 1977; Phillips 1993; Tripp 1998)1. When leveraged properly, this allowed for a reduction in the scatter of the SNe Ia’s peak luminosities, down to only ∼0.1 mag (e.g. Hamuy et al. 1996a; Phillips et al. 1999; Goldhaber et al. 2001). Since the mid-1990s, samples of SN Ia have been expanded (e.g., Jha et al. 2006; Hicken et al. 2009; Ganeshalingam et al. 2010; Stritzinger et al. 2011; Krisciunas et al. 2017; Sako et al. 2018; Tucker et al. 2022a; Do et al. 2025) and calibration techniques have improved (e.g. Guy et al. 2007; Jha et al. 2007; Mandel et al. 2011, 2017; Burns et al. 2014, 2018). This means that SNe Ia now form the bedrock of modern cosmological investigations aimed at precisely measuring the Hubble constant (e.g., Hamuy et al. 1995; Freedman et al. 2001, 2009; Riess et al. 2016) and quantifying the accelerated expansion of the Universe (e.g., Riess et al. 1998, 2021; Schmidt et al. 1998; Ganeshalingam et al. 2013; Betoule et al. 2014; Scolnic et al. 2018; Burns et al. 2018; Perlmutter et al. 1999).
In recent years, a growing number of additional SN Ia subtypes and subclasses have been identified in the literature, populated by objects that deviate from the established luminosity-width and color relations (see reviews by Taubenberger 2017; Jha et al. 2019, and references therein). Mapping the full diversity of peculiar SNe Ia is needed to ensure that cosmological parameter estimates based on current and future SNe Ia samples are not biased by objects departing from the luminosity decline-rate and luminosity-color relations. This provides interesting new avenues to elucidate the origins of SNe Ia progenitor systems and insights into how they explode.
In this paper, we present detailed optical observations of the type Ia SN ASASSN-20jq (IAU designation SN 2020qxp) discovered soon after the explosion (see Sect. 2) by the All-Sky Automated Survey for SuperNovae (ASAS-SN; Shappee et al. 2014; Kochanek et al. 2017) and initially classified as a transitional SNe Ia (Stritzinger & Ashall 2020). Our analysis shows ASASSN-20jq is an underluminous SN Ia with a broader-than-expected light curve shape and prevalent spectral features associated with intermediate mass elements. It also exhibits an early excess of emission within the first days of explosion. These attributes are reminiscent of objects linked to the loosely defined 2002es-like SNe Ia subclass (Ganeshalingam et al. 2012). We also built upon the work of Hoeflich et al. (2021), who modeled the late-phase near-infrared spectrum of ASASSN-20jq using a Chandrasekhar-mass (MCh) carbon-oxygen (C + O) white dwarf (WD) with a relatively high-central density, which is disrupted following an off-center deflagration-to-detonation transition (DDT). In this study, we extended their model to include optical wavelengths as well. After including the effects of macroscopic mixing, the model was found to be in good agreement with both the optical and near-infrared (NIR) nebular spectra.
In Sect. 2, we discuss the discovery, first detection, and last nondetection of ASASSN-20jq as well as the distance to the host galaxy. Section 3 offers a description of data collection. The analysis of the photometric and spectroscopic data is presented in Sects. 4 and 5, respectively. In Sect. 6, we discuss the properties of the host galaxy, while Sect. 7 presents the results, compares them with those of other supernovae, and analyzes the nebular spectra using the off-center DDT model. Finally, we summarize our findings in Sect. 8.
2. Discovery and distance to ASASSN-20jq
ASAS-SN discovered ASASSN-20jq on UT 2020-08-08.13 using the “Cecilia Payne-Gaposchkin” telescope in South Africa (Bock et al. 2016; Holoien et al. 2017) with an apparent g-band magnitude of mg = 16.79 ± 0.08. Upon reporting to the transient network server (TNS), it received an international astronomical union (IAU) designation of SN 2020qxp. In Sect. 4.2 below, we combine the ASAS-SN discovery information with recovered z-band photometry obtained with Pan-STARRS (PS) a day prior, as well as the last nondetection limits inferred from ASAS-SN and ATLAS images to obtain a robust constraint of ASASSN-20jq’s time of first light (hereafter, tfirst).
With J2000 coordinates of  ,
,  , ASASSN-20jq was located in the SBm type galaxy NGC 5002 (see Fig. 1) at a heliocentric redshift z = 0.00368 ± 0.00001 (SDSS Collaboration 2017). The most recent Tully-Fisher measurement to this galaxy implies a distance of 19.41 ± 3.84 Mpc (Cosmicflows-4; Kourkchi et al. 2020a), which we adopt to set the absolute luminosity scale. The Tully-Fisher distance is consistent with the estimate from the Cosmicflows-3 Distance-Velocity calculator (Kourkchi et al. 2020b) adopting a smoothed velocity field model (Shaya et al. 2017). The key parameters of ASASSN-20jq are listed in Table 1.
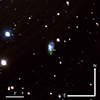 |
Fig. 1. Composite Bgr-band (11′×11′) image of ASASSN-20jq (green marker) located within NGC 5002 and observed from the Post observatory 15 days prior to B-band maximum. |
3. Observations and data reductions
We initiated a multi-band photometric and spectroscopic campaign shortly after the initial discovery. Our follow-up spanned over a year and in addition to combined resources of ASAS-SN, and the 2.6 m Nordic Optical Telescope (NOT) on La Palma, Spain, through the NOT Un-biased Transient Survey (NUTS2; Holmbo et al. 2019)2, optical photometric data were obtained with the 2.0 m Las Cumbres Observatory Global Telescope network (LCOGT; Brown et al. 2013), the 0.6 and 0.8 m telescopes at Post Observatory SRO (CA, USA) and Post Observatory Mayhill (NM, USA), and the 0.9 m Schmidt telescope at Asiago, Italy. Our photometry is also complemented by photometry from the ZTF survey. All of the broadband imaging data were reduced following standard procedures.
Prior to computing photometry, host-galaxy subtraction was performed on all science images. To do so, a common set of BgVriz-band images containing the field of the host galaxy were obtained two years after discovery by the Aarhus-Barcelona cosmic FLOWS project3 using the LCOGT 2 m telescope. The template images were subtracted from the science images using the SUBPHOT package, which is an extension of the differential photometry pipeline DIFFPHOT4. The SUBPHOT pipeline first analyzes image quality, optimizes the images as a pre-requisite for template subtraction and aligns the science images with templates, following which it employs the HOTPANTS software (Becker 2015) to perform the optimal image subtraction.
Differential PSF photometry of ASASSN-20jq was computed using DIFFPHOT pipeline on the sequence of template subtracted science images. Photometry was calibrated using common field stars from PS photometric catalog (Flewelling et al. 2020). Prior to computing zeropoints for calibration, the PS catalog photometry is converted to the Johnson BV and Sloan griz photometric system using the color relations of Tonry et al. (2012). The BgVriz-band light-curves of ASASSN-20jq extending between −15 days to +339 days relative to the epoch of B-band maximum are plotted in Fig. 2. In this paper, unless otherwise stated, the time of B-band maximum brightness (tB, max in Table. 1 and Sect. 4.1) is used as the reference epoch. The photometry is listed in Table. A.1, along with ZTF photometry, which leads to more densely sampled g- and r-band light curves.
Key parameters of ASASSN-20jq.
Thirteen low-resolution optical spectra of ASASSN-20jq were obtained using multiple facilities including the NOT (+ALFOSC), the 8.4 m Large Binocular Telescope (LBT, +MODS; Pogge et al. 2010), the 2.2 m Hawai’i telescope (+SNIFS; Aldering et al. 2002, through SCAT survey Tucker et al. 2022a), the 1.8 m Copernico telescope (+AFOSC), the 3.6 m Telescopio Nazionale Galileo (TNG, +LRS), and the 10.4 m Grand Telescopio Canarias (GTC, +OSIRIS). The journal of spectroscopic observations is provided in Table 2. The spectroscopic data were reduced and calibrated following standard procedures.
Journal of spectroscopic observations.
The spectroscopic evolution of ASASSN-20jq is shown in Fig. 3 with the key features labeled5. The first three spectra were obtained on −9 days, −2 days, and +2 days cover the so-called photospheric phase of the SN evolution, while the remaining spectra extending between +85 days and +337 days provide a nebular phase window into the inner ejecta of the progenitor star (see Hoeflich et al. 2021, and below).
4. Broadband photometry
4.1. Photospheric phase optical light curves
The multi-band photometry in Fig. 2 shows the bell-shaped light curves ubiquitous to thermonuclear SNe. Our coverage nicely samples in most bands the rise to maximum and the post-maximum declining phases. At some time between +30 days to +60 days when ASASSN-20jq was located behind the Sun, the transition occurred to the linear declining phase powered by 56Co to 56Fe radioactive decay energy deposition, which is followed for several hundred days.
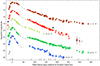 |
Fig. 2. Optical BgVriz-band light curves of ASASSN-20jq along with “max_model” template light curve fits (black dashed lines) computed by SNooPy (Burns et al. 2011). The indicated offsets have been added to the light curves for clarity. Epochs of spectral observations are marked by vertical bars at the bottom, the epoch of the B-band maximum is indicated with a black vertical line, and the explosion epoch is marked by a blue vertical dashed line. |
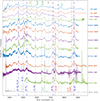 |
Fig. 3. Optical spectroscopic time-series of ASASSN-20jq. Positions for telluric oxygen absorption are marked by ⊕ symbol and light-grey bands. The vertical dashed lines are at rest-wavelengths for corresponding lines as labeled. Thick dashed lines represent Fe multiplets. An archival SDSS host galaxy spectrum, centered 3 |

Generic SNe Ia and overluminous 1991T-like objects exhibit double-peaked i-band light curves. ASASSN-20jq does not show a distinct secondary maximum; rather, its i-band light curve exhibits a flatter profile over ∼20 days near the maximum. This morphology is typical of many “peculiar” subtypes including 1991bg-like (Krisciunas et al. 2009), 2002cx-like (Foley et al. 2013), 2003fg-like (Ashall et al. 2020), and 2002es-like (e.g., Burke et al. 2021, see their Fig. 4) SNe Ia.
In Fig. 2, we also overplot (along with each observed light curve) their corresponding best-fit template light curves computed using the SNOOPY [SuperNovae in object-oriented Python; Burns et al. 2011] code. As ASASSN-20jq is a peculiar supernova, we made use of the so-called “max_model” function to compute these template fits (see Stritzinger et al. 2010, Eq. 5). Inspection of the template fits indicates a reasonable agreement in all but the i-band, which is due to ASASSN-20jq lacking of a distinct secondary maximum.
In addition to template light curve fits, the early light curves were fit with Gaussian process (GP) spline function to obtain estimates of the peak magnitude and the epoch of maximum. These results along with those obtained from template fitting are summarized in Table 3. The spline fits provide mB, max = 14.76 ± 0.03 mag, a time of peak  days, and a light-curve decline-rate parameter of Δm15(B) = 1.35 ± 0.09 mag. The corresponding peak absolute magnitude (corrected for reddening, see below) is MB, max = −17.09 ± 0.50 mag, which is ∼2 mag fainter than normal SNe Ia with a similar decline rate.
Peak time, apparent, and absolute magnitudes for each filter.
4.2. Estimating the epoch of first light and the rise time
The first detection of ASASSN-20jq was made from a PS survey z-band image taken on UT 2020-08-05.25, which corresponds to −19 days prior to the epoch of B-band maximum. Previous (and rather shallow) nondetection limiting g-band and o-band apparent magnitudes of 16.9 and 18.46 were estimated from ASAS-SN and ATLAS survey images taken on UT 2020-08-04.14 and UT 2020-08-04.29, respectively (see Table A.1). Comparing the nondetection and discovery epoch to the epoch of B-band maximum indicates a minimum rise-time for ASASSN-20jq of ∼19.4 ± 0.7 days. This value is typical for normal SNe Ia (e.g., Taubenberger 2017).
To more accurately estimate the rise time, we fit the rising light curve with a power law function to estimate tfirst, the time of first light (Fig. 4). As a first step, the PS z-band natural system recovered detection photometry was S-corrected (Stritzinger et al. 2002) to the SDSS r band so that it can be fit with our later r-band light curve. This was accomplished by computing synthetic photometry convolving the respective broadband filter response functions with an appropriate spectral energy distribution (SED) of ASASSN-20jq. Due to the lack of observed spectra of ASASSN-20jq at −19 days, we assumed a range of possible SEDs and assign the results as limits of the uncertainty associated with the transformed photometric fluxes. To estimate the upper limit, we used the earliest publicly available SN Ia spectrum, namely, SN 2017cbv at −18.3 days (Hosseinzadeh et al. 2017); whereas to estimate a lower limit we use the −9 days spectrum of ASASSN-20jq. A black-body SED was also considered, adopting a temperature of ∼1.0 × 10⁴, K at approximately +1.5 days after tfirst of SN 2011fe (Zheng et al. 2018). However, this value falls within the range assumed based on the spectra of ASASSN-20jq and SN 2017cbv.
With the transformed z- to r-band PS photometry, a power-law function was fitted to the early rising r-band light curve of ASASSN-20jq using the Markov chain Monte Carlo (MCMC) package MCMCSTAT (Haario et al. 2006), which employs adaptive Metropolis samplers (Haario et al. 2001). The MCMC fit was performed using all early r-band data points extending up to −7 days (Conley et al. 2006; Ganeshalingam et al. 2011). A preliminary least-squares fit was first conducted to obtain an initial power-law model, which was then used as the starting parameter for the MCMC fitting process.
The top panel of Fig. 4 shows the early rising r-band light curve of ASASSN-20jq along with the last ATLAS o-band nondetection limit and the best-fit MCMC model. The bottom panel presents the 2D probability density of the MCMC sample for the power-law index parameter α and tfirst. The best fit corresponds to an  and tfirst of
  (UT 2020-08-03.8), which is 1.5 days before the epoch (UT 2020-08-05.3) of the recovered PS z-band detection and
  days relative to tB, max. The inferred value of α is fully consistent with the expanding “fireball” model characterized by α = 2.
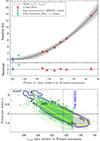 |
Fig. 4. Top panel: Early-time r-band light curve of ASASSN-20jq. This also includes the first photometric detection of ASASSN-20jq made by PS in the z band, which has been S-corrected to the SDSS r-band system. Also plotted is the ATLAS o-band nondetection limit reported previously. Overplotted the r-band light curve is the best MCMC-fit of a single power-law function (solid curve) with inferred probability limits (shaded region). Bottom panel: 2D probability density of MCMC sample between the fit parameters – time of first light tfirst and power-law index α. Having a confirmed detection at −19 days (vertical blue dashed line), only the region in green is valid parameter space. The contours correspond to 68% and 95% confidence intervals. The solid black lines indicate the mean of the MCMC sample for parameters tfirst = −20.4 days (vertical) and α = 1.99 (horizontal). |
However, a close inspection of the PS z-band discovery photometry that had been transformed to the SDSS r band obtained on −19 days indicates that it is a 3-σ outlier relative to the power-law fit. This suggests an excess of flux by 2.3 ± 1.3 mag relative to the expanding fireball model, at least during the first 1.4 days of the estimated tfirst. It is worth emphasizing that, although the early bump is statistically significant, there is inherent uncertainty in the S-corrected photometric data point due to the assumed SED at −19 days. The range of SEDs considered includes those of SNe 2011fe and 2017cbv, which are not representative of 2002es-like SNe and may differ from that of ASASSN-20jq at such an early phase. Additionally, SN 2017cbv exhibited an early flux excess, which could further influence the photometric transformation.
4.3. Late-phase light curve
The high-cadence photometry of ASASSN-20jq extending beyond +50 days enables a robust measurement of the post maximum 56Co → 56Fe powered light curve decline rate. Normal SNe Ia typically exhibit B- and V- linear decline rates of ≈1.4 mag per 100 days (e.g., Lair et al. 2006; Stritzinger & Sollerman 2007; Leloudas et al. 2009).
A best-fit linear function to the B-band light curve of ASASSN-20jq between +75 days to +230 days reveals a decline rate of 2.3 ± 0.1 mag per hundred days, while similar fits to the r- and i-band data give decline rates of 2.8 ± 0.1 and 2.2 ± 0.1 mags per hundred days, respectively. We also note that the post +250 days i-band light curve exhibits a slower decline relative to the continued linear decline exhibited by the g and r bands (see Fig. 2), indicating a shift in the percentage of total flux towards infrared bands. Similar late-time flattening in I-band was also seen in SN 2011fe (Munari et al. 2013).
4.4. Photometric classification
For SNe Ia sub-types exhibiting double-peaked light curves (i.e., normal and 1991T-like SNe Ia), the i-band light curve reaches peak luminosity typically 3–5 days prior to epoch of B-band maximum. On the other hand, for subtypes without prominent double-peaked light curves (i.e., 1991bg-like, SNe Iax, and 2003fg-like), the epoch of the i-band maximum occurs after that of the B band (Krisciunas et al. 2009; Stritzinger et al. 2015; Ashall et al. 2021). Ashall et al. (2021) recently leveraged these empirical findings to provide a photometric-based means to subtype SNe Ia. By comparing the difference between the epochs of peak i- and B-bands ( ), and the light curve color-stretch parameter (sBV)6 they find clear groupings of known SNe Ia subtypes. We recreate the results of Ashall et al. (2021) in Fig. 5. Our spline fits to the photometry of ASASSN-20jq indicate
  days. This places ASASSN-20jq within a sparsely populated region of the figure, with no overlap between the major SN Ia subclasses.
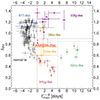 |
Fig. 5. Subtyping of SNe Ia based on light curve properties as per Ashall et al. (2021). Specifically, the color-stretch parameter sBV, is plotted vs. |

4.5. Colors and the reddening estimation
Figure 6 shows the apparent B−V color evolution of ASASSN-20jq extending from the time observations were commenced through +100 d. Also plotted for comparison are the intrinsic (B − V)0 color-curves associated with the normal type Ia SN 2011fe and the subluminous SN 1991bg. An inspection of the color evolution of ASASSN-20jq reveals a dearth of coverage and, as a result, the peak of the B−V color was not captured. We therefore obtain a lower limit on the color-stretch parameter of sBV > 0.82. This value is consistent with sBV = 0.76 ± 0.08, as determined by the SNOOPY template light curve fits shown in Fig. 2.
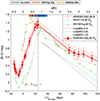 |
Fig. 6. Apparent (B − V) and intrinsic (B − V)0 color evolution of ASASSN-20jq. The intrinsic color evolution of the normal SN 2011fe (Richmond & Smith 2012), the low-luminosity SN 1991bg (Turatto et al. 1996), and the Lira relation for different sBV values (Burns et al. 2014) are also plotted. To construct the color-curve of ASASSN-20jq, the B- and V-band light curves were interpolated with low-order splines which were then evaluated at the same epochs. The vertical dashed line marks the lower limit of the time of B−V maximum of ASASSN-20jq as the data only captures the rising part of the color curve. The vertical bars at the top of the figure indicate the range of sBV values for the SNe Ia-normal, 1991bg-like, and 2002es-like samples populating the luminosity versus sBV diagram presented in Fig. 8. |
An inspection of Fig. 6 reveals the apparent B−V colors of ASASSN-20jq are redder than those of SN 2011fe by ≈0.1 mag at maximum, and typically between ∼0.1 − 0.3 mag over the entire photospheric phase. The peak color difference between ASASSN-20jq and SN 2011fe is fully consistent with those of other 2002es-like SNe Ia (see, e.g., Burke et al. 2021). As the coverage of ASASSN-20jq between +30 days to +90 days is nearly nonexistent, we were unable to estimate the host reddening via the Lira relation; although we note that the limited observations in hand do imply that ASASSN-20jq experiences minimal host reddening.
Next, we turn to the Na I D absorption lines detected in spectra obtained at −2 days and +85 days to ascertain the host-reddening of ASASSN-20jq. Using the −2 day spectrum, with its higher signal-to-noise ratio (S/N), we measured the pseudo-equivalent width (pEW) of the Na I D feature as  Å (see Fig. 7). Adopting the empirical-based relation prescribed by Poznanski et al. (2012), this translates to E(B−V)host = 0.091 ± 0.020 mag. Similarly, we measured the Na I D profile in +85 days spectrum and obtain a E(B−V)host of 0.064 ± 0.037 mag. However, we discarded the later measurement due to its low signal-to-noise (S/N) spectrum. Phillips et al. (2013) further studied the relation between
  and reddening using an expanded data sample of high-resolution spectroscopy of SNe Ia, as well as using measurements in the Milky Way. They found a dispersion in the Milky Way correlation of ∼68% instead of ∼20%, as suggested by Poznanski et al. (2012). Therefore, with the addition of an ∼68% uncertainty to the reddening estimated above, we arrived at our final adopted reddening value of E(B−V)host = 0.091 ± 0.062 mag. This value is similar to the value inferred from the Na I D versus reddening relation calibrated based on the broad-band colors of stripped-envelope SNe (Stritzinger et al. 2018; Rodríguez et al. 2023), which implies a somewhat higher E(B − V)host ≈ 0.17 mag.
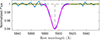 |
Fig. 7. Na I D lines at the rest wavelength of the host galaxy. The −2.4 days spectrum is normalized by the local continuum. The D1 and D2 lines are unresolved in this low-resolution spectrum. The estimated EW for the Na I D profile is 0.69 ± 0.04 Å and the corresponding E(B − V)host is 0.091 ± 0.020 mag. |
Combining our adopted host reddening with the Milky Way reddening measured along the line of sight to ASASSN-20jq, corresponding to E(B−V)MW = 0.0096 mag (Schlafly & Finkbeiner 2011), yields a total E(B − V)tot = 0.10 ± 0.06 mag. Upon adopting the standard total-to-selective absorption value of RV = 3.1, it provides a V-band extinction value of  mag.
mag.
4.6. ASASSN-20jq is a significant outlier in luminosity-width relation
The left panel of Fig. 8 shows the SNe Ia luminosity-width relation (or the Phillips 1993 relation) populated with normal SNe Ia from the Carnegie Supernova Project (Hamuy et al. 2003; Phillips et al. 2019), along with members of known SN Ia subtypes. The bright end of the distribution is populated by bright normals, overluminous 1991T-like (Filippenko et al. 1992b; Phillips et al. 1992, 2022), 2002ic-like (Hamuy et al. 2003), and 2003fg-like (Howell et al. 2006; Ashall et al. 2021) subtypes. The faint end of the distribution is populated by the so-called transitional SNe Ia (e.g., iPTF 13ebh; Hsiao et al. 2015), the low-luminosity 1986G-like (Phillips et al. 1987) subtype, and the subluminous 1991bg-like subtype. Additional peculiar subtypes including 2000cx-like (Li et al. 2001), 2002cx-like (Iax, Li et al. 2003), and 2002es-like objects are also included. Specific 2002es-like objects (Ganeshalingam et al. 2012) are PTF10ops (Maguire et al. 2011), iPTF14atg (Cao et al. 2015), and SN 2016ije (Li et al. 2023). These are further complemented by other objects with commonalities to 2002es-like SNe including SN 2006bt (Foley et al. 2010; Stritzinger et al. 2011), SN 2006ot (Stritzinger et al. 2011), SN 2019yvq (Burke et al. 2021), SN 2022vqz (Xi et al. 2024), and SN 2016hnk (Galbany et al. 2019; Jacobson-Galán et al. 2020).
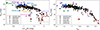 |
Fig. 8. Absolute magnitude vs. light curve shape diagrams populated with the Carnegie Supernova Project SN Ia sample (Contreras et al. 2010; Stritzinger et al. 2011; Krisciunas et al. 2017; Ashall et al. 2021; Phillips et al. 2022), along with members of known SN-Ia subtypes, a handful of 2002es-like objects, and ASASSN-20jq. References for the expanded comparison sample are provided in Sect. 4.6. The left panel relates the peak absolute B-band magnitude (MB) to the light curve shape parameter Δm15(B) (Phillips 1993), while MB is plotted in the right panel vs. the color-stretch parameter, sBV (Burns et al. 2014). |
In the left panel of Fig. 8, we can see ASASSN-20jq is located ≈2.5 mag below the Phillips relation, sandwiched between a handful of 2002es-like and 2002cx-like SNe being more luminous, and SN 2016hnk being less. The Δm15(B) parameterization is known to be degenerate for low-luminosity, fast-declining SNe Ia (e.g., 1991bg-like SNe). Turning to the right panel, which instead relies on the more robust color-stretch parameter, sBV (Burns et al. 2014), we see that sBV parameter does a good job in significantly reducing the scatter along the Phillips relation, particularly for the fast declining SNe Ia. Among other SNe, the reduced dispersion also brings SN 2016hnk close to the distribution of 1991bg-like SNe Ia. This is also the case of SN 2002es and other similar 2002es-like objects such as SNe 2016ije (Li et al. 2023), 2019yvq (Miller et al. 2020), and 2022vqz (Xi et al. 2024). Remarkably, ASASSN-20jq appears immune to the sBV standardization as well, since it remains 2.5 mag below the luminosity-color-stretch relation, and it is the only significant outlier in the comparison sample.
4.7. Absolute magnitude and bolometric light curves
Figure 9 compares the absolute B-band magnitude light curves of ASASSN-20jq with a comparison sample consisting of the normal SN 2011fe (Richmond & Smith 2012), as well as the low-luminosity SNe 1991bg (Turatto et al. 1996), 2002es (Ganeshalingam et al. 2012) and 2016hnk (Galbany et al. 2019). The top panel demonstrates the peak magnitude of ASASSN-20jq is sandwiched between SNe 2002es and 2016hnk, and that its post maximum phase follows a standard decline rate.
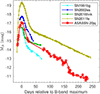 |
Fig. 9. Absolute B-band magnitude light curves of ASASSN-20jq compared with the normal SN 2011fe, the subluminous SN 1991bg, as well as the peculiar SNe 2002es and 2016hnk. The adopted distance, ABtot extinction, and references of the comparison sample are as follows: SN 2011fe – 6.79 Mpc, 0.93 mag (Richmond & Smith 2012; Patat et al. 2013), SN 1991bg – 17.0 Mpc, 0.0 mag (Leibundgut et al. 1993), SN 2016hnk – 68.35 Mpc, 1.48 mag, (Galbany et al. 2019), and SN 2002es – 73.2 Mpc, 0.00 mag (Ganeshalingam et al. 2012). |
To estimate the quantity of 56Ni synthesized during ASASSN-20jq’s disruption, we constructed and modeled a UVOIR bolometric light curve. First, the broad-band optical light curves were interpolated using Gaussian Process spline functions. A reddening correction was applied adopting E(B − V)tot = 0.10 mag. Next, using the bolometric function contained within SNooPy, 1991bg-like spectral templates from Nugent et al. (2002) were color-matched to the reddening-corrected broad-band colors of ASASSN-20jq7. To account for flux beyond the spectral range of the spectral templates we (i) extended the SED bluewards of the atmospheric cutoff by linearly extrapolating to zero flux at 2000 Å and, (ii) extended the SED redwards of the i-band spectral range using a Rayleigh-Jeans tail extending to 20 000 Å. Upon integration of the color-corrected spectral templates, the integrated flux values were converted to luminosity adopting the distance quoted in Table 1. The resultant UVOIR light curve is plotted in the top panel of Fig. 10.
We now describe the method used to estimate the 56Ni mass from the UVOIR light curve of ASASSN-20jq. In short, the UVOIR light curve was fit with an energy deposition function associated with the radioactive 56Ni→56Co→56Fe decay chain. The best-fit model is over-plotted to the UVOIR light curve in the top panel of Fig. 10. The model fit consists of two free parameters corresponding to the 56Ni mass (MNi) and the γ-ray trapping parameter t0γ. While all the positron kinetic energy from 56Co decay is allowed to be deposited, only [1 − e( − t0γ2/t2)] fraction of γ-ray energy is trapped in the envelope. At late times, (> 200 days) when positron energy becomes comparable to the fraction of γ-ray deposition energy, the model luminosity tends to become degenerate between MNi and t0γ. Therefore, in the middle panel of Fig. 10, we fit the time-weighted integral of the luminosity, which indicates that at all times during the evolution of ASASSN-20jq its energy budget can be explained solely by the 56Ni decay chain (Katz et al. 2013). In other words, there is no evidence from the model fit for any additional sources of energy deposition. Furthermore, plotted in the bottom panel is the ratio t2L/(∫Ltdt) which breaks the late-time degeneracy between MNi and t0γ, as it is independent of MNi (Katz et al. 2013). This ratio is used to independently and accurately tune the t0γ parameter, while the model in the top two panels are used to determine the MNi. The best-fit model corresponds to t0γ = 58 ± 5 days and a low MNi = 0.088 ± 0.008 M⊙. Such a low MNi has been seen only for a few underluminous 1991bg-like SNe (Scalzo et al. 2019; Sharon & Kushnir 2020), thereby indicating that ASASSN-20jq exhibits one of the lowest MNi estimates known for SNe Ia to date.
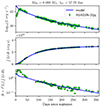 |
Fig. 10. Modeling the UVOIR bolometric light curve with a radioactive 56Ni decay model (solid lines). The UVOIR light curve of ASASSN-20jq (top panel), its time-weighted integrated luminosity (middle panel), and the ratio t2L/(∫Ltdt) (bottom panel) which is defined independent of the 56Ni mass are shown. Phase is in days since the adopted time of first light, which is 20.4 days before the epoch of the B-band maximum (see Sect. 4.2). |
5. Spectroscopic analysis
Here, we present our analysis of the spectroscopic time-series of ASASSN-20jq. First, the photospheric phase spectra are examined and compared to other similar epoch SNe Ia covering a range of subtypes. Finally, the late-phase spectra are considered.
5.1. Photospheric phase
Figure 11 provides a comparison between the −9 days and −2 days spectra of ASASSN-20jq to similar phase SNe Ia representative of a variety of SN Ia subtypes. This includes pre-maximum spectra of the 1991bg-like SN 1999by (Matheson et al. 2008), SN 1986G (Phillips et al. 1987), SN 1991T (Mazzali et al. 1995), SN 2006bt (Stritzinger et al. 2011), and maximum or post-maximum spectra of SN 2011fe (Pereira et al. 2013), the type Iax SN 2008A (McCully et al. 2014), SN 1991bg (Filippenko et al. 1992a), SN 2010lp (Mazzali et al. 2022), SN 2016hnk (Galbany et al. 2019), SN 2002es (Ganeshalingam et al. 2012), and SN 2019yvq (Miller et al. 2020).
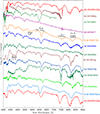 |
Fig. 11. Photospheric spectra of ASASSN-20jq compared with similar epoch spectra of other SN Ia types with key spectral features marked and labeled. The comparison sample includes subluminous SNe 1991bg, 1999by, and 2016hnk, the normal SN 2011fe, the overluminous SN 1991T, the Type Iax SN 2008A, and SN 2002es, along with several commonly referenced objects in our overall comparison, namely SNe 2006bt, 2010lp, and 2019yvq. See text for references. |
At a quick glance the most prominent spectral line features of ASASSN-20jq are consistent with those present in normal SNe Ia such as SN 2011fe. However, a more detailed inspection reveals that ASASSN-20jq is spectroscopically peculiar, sharing some commonalities with 2002es-like SN Ia, but also exhibits a number key differences.
The photospheric phase spectra of ASASSN-20jq have a number of conspicuous features which are labeled in Fig 11. These include the S II W-shaped doublet, the Si IIλλ5972, 6355 doublet, O Iλ7773, and the Ca IIλλ8498, 8542, 8662 near-infrared triplet features. These features are all common to normal SNe Ia, but typically do not appear as prevalent as they do in ASASSN-20jq. Indeed, similar prevalent absorption profiles are a characteristic of subluminous 1991bg-like and other underluminous 2002es-like objects within the comparison sample. From the −2 days and +2 days spectra of ASASSN-20jq, the O Iλ7773 pEW values are measured to be 220 ± 5 Å, and 222 ± 7 Å. These values are approximately twice as high as those inferred from maximum light spectra of the subluminous SNe 1991bg (pEW ≈ 130 Å) and 2016hnk (pEW ≈ 112 ± 4 Å), as measured using the Python package spextractor (Burrow et al. 2020)8.
Interestingly, unlike most underluminous SNe Ia like SNe 1986G, SNe 1991bg and SN 2002es, ASASSN-20jq lacks a conspicuous ∼4150 Å Ti II absorption feature (see Fig. 11) at maximum light. However, only the pre-maximum spectrum at −9 days is possibly showing a weak Ti II absorption line.
We go on to place ASASSN-20jq into context with known SNe Ia spectroscopic relations based on a number of decline-rate and spectroscopic indicators. These include Si IIλ5972 and λ6355 pEW measurements and the Si IIλ6355 Doppler line velocity as measured from the position of maximum absorption (vabs) measured from spectra obtained within three days of the epoch B-band maximum.
The Branch diagram provides a spectroscopic sequence among the SNe Ia population that reflects the degree of ionization above the photosphere (Nugent et al. 1995; Branch et al. 2006). Our Branch diagram comparing the pEW values of Si IIλ5972 and Si IIλ6355 is plotted in Fig. 12. We measure Si IIλ5972 and λ6355 pEW values from the −2 days of ASASSN-20jq of 54 ± 4 Å and 145 ± 4 Å respectively, and from the +2 days spectrum 63 ± 4 Å and 152 ± 4 Å. As per the Branch classification scheme, ASASSN-20jq falls on the extreme end of ‘CooL’ (CL) type populated by low-luminosity, fast-declining SNe Ia as well as the so-called transitional SNe Ia subtype (see, e.g., Hsiao et al. 2015). ASASSN-20jq is an extreme CL type, and with Si IIλ6355 pEW values of ≈150 Å, also rivals the values exhibited by some of the “broadest” broad line (BL) SNe Ia in the comparison sample.
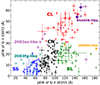 |
Fig. 12. Branch diagram comparing the pEW values of the Si IIλ5972 and λ6355 spectral features measured at maximum light. The diagram is populated by the Carnegie Supernova Project sample of SNe Ia (Folatelli et al. 2013; Morrell et al. 2024). Our measurements from two near-maximum light spectra of ASASSN-20jq are plotted in purple, as well as those inferred of nearly a dozen peculiar SNe Ia with commonalities with SN 2002es (see text). In addition, we plot the sample of 2003fg-like objects (Ashall et al. 2021). The Branch diagram subtypes labeled are CN: core normal, BL: broad line, CL: cool, and SS: shallow silicon. |
Next, we investigated other spectroscopic based relations that have similar groupings to the Branch diagram, while including information on the velocity of the Si IIλ6355 feature. In Fig. 13 the near maximum Si IIλ5972 pEW (top) and Si IIλ6355 pEW (bottom) measurements of ASASSN-20jq are plotted versus the Si IIλ6355 Doppler velocity as inferred from the position of maximum absorption (hereafter, v(Si II)abs). The comparison SNe Ia sample consists of Carnegie Supernova Project (CSP) objects presented recently by Morrell et al. (2024), and augmented with the CSP 2003fg-like sample (Ashall et al. 2021), SN 2002es (Ganeshalingam et al. 2012), and the 2002es-like objects: iPTF14atg (Cao et al. 2015), SN 2006bt (Foley et al. 2010), SN 2006ot (Silverman et al. 2012), SN 2010lp (Mazzali et al. 2022), SN 2016ije (Li et al. 2023), SN 2016jhr (Jiang et al. 2017), SN 2019yvq (Miller et al. 2020), SN 2022vqz (Xi et al. 2024), and SN 2022ywc (Srivastav et al. 2023).
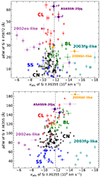 |
Fig. 13. Wang et al. (2009) diagrams comparing the Si IIλλ5972, 6355 pEW and Doppler velocity (v(Si II)abs) measurements from near maximum spectra of the Carnegie Supernova Project sample (Morrell et al. 2024; Ashall et al. 2021). Measurements made from the two nearest to maximum light spectra of ASASSN-20jq are plotted as purple points, as well as those inferred from nearly a dozen peculiar SNe Ia with commonalities with SN 2002es. Branch types are same as in Fig. 12. The vertical line separates normal and high-velocity SNe Ia as defined by Wang et al. (2009). |
Between −2 and +2 days, ASASSN-20jq exhibits Si IIvabs value between −12 500 ± 600 km s−1 to −11 700 ± 550 km s−1. These values place ASASSN-20jq near the boundary between the normal and high-velocity SNe Ia groups, as defined by Wang et al. (2009) at −11 800 km s−1.
5.2. Nebular phase spectroscopy
Figure 14 contains our nebular phase spectra of ASASSN-20jq compared with similar epoch spectra of a comparison sample. Similar to the comparison sample, the blue end of ASASSN-20jq’s spectrum exhibits several broad feature complexes at the same spectral ranges as the known blends of multiple forbidden [Fe III] and [Fe II] line transitions observed in SNe Ia. However, similarly to the 2002es-like SN 2010lp, these features in the ASASSN-20jq spectra are more subdued as compared with the normal, 1991T-like, and even SN 1991bg in terms of line widths and strengths. In addition, as in the case of normal SNe Ia, the +229 day spectrum of ASASSN-20jq exhibits forbidden [Co III] λ5888; whereas at the red end of the spectrum, we can identify a conspicuous emission complex extending roughly between ∼7000 − 7600 Å. In normal SNe Ia, this feature is thought to be a blend of [Fe II] λ7155 and [Ni II], while for ASASSN-20jq we also see two narrow, partially resolved peaks. Each component is characterized by a FWHM velocity of ∼1200 km s−1 and are formed by forbidden [Ca II] λλ7291, 7324 emission.
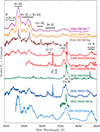 |
Fig. 14. Nebular spectra comparison. Spectra of ASASSN-20jq obtained at +229 days and +337 days compared with nebular spectra of SN 1991T (Gómez & López 1998), SN 2011fe (Zhang et al. 2016), the low-luminosity SN 1991bg (Turatto et al. 1996), the SN Iax 2008A (McCully et al. 2014), the peculiar SN 2016hnk (Galbany et al. 2019), as well as the 2002es-like SN 2010lp (Taubenberger et al. 2013), and SN 2019yvq (Tucker et al. 2021). Prominent spectral features are labeled with associated ion following Wilk et al. (2020). |
Strong [Ca II] features are rarely observed at similar epochs in normal SNe Ia, and when documented typically appear after ∼ + 400 days with broad and unresolved doublet components (e.g., Tucker et al. 2022b; Kumar et al. 2023). However, the [Ca II] doublet has been documented to appear in members of the low-luminosity 2002cx-like and 2002es-like subclasses, as well as a handful of 2003fg-like SNe Ia. As demonstrated by the Fig. 14, the [Ca II] doublet appear resolved in SN 2016hnk, the 2002es-like SN 2010lp, and the Type Iax SN 2008A.
Recently, Siebert et al. (2023) reported the presence of a resolved [Ca II] doublet with FWHM velocities of 180 km s−1 appearing after +240 days in the 2003fg-like SN 2020hvf. However, close inspection of Fig. 14 does reveal an inkling of [Ca II] in the +258 days spectrum of SN 1991T (see Phillips et al. 2024, for a discussion), while it also appears to contribute to this complex feature in the +264 days spectrum of SN 2010lp (Taubenberger et al. 2013). Finally, with respect to Ca, ASASSN-20jq exhibits a rather broad emission feature between 8500–9000 Å formed by the Ca II near-IR triplet. A similar prevalent feature is also present in the comparison spectra of SNe 2010lp and 2019yvq.
Figure 15 presents a multi-panel plot of discrete spectral sections in the velocity domain with respect to the rest wavelengths of [Co III] λ5888, [O I] λλ6300, 6363, and [Ca II] λλ7291, 7324. In the left panel, the [Co III] feature is centered at its rest position. This is juxtaposed with the [Ca II] doublet (right panel) that exhibits a significant redshift of ∼1700 km s−1 with respect to its rest wavelength, and this offset remains constant throughout the evolution captured by the time-series showing in Fig. 3. In fact, inspection of the time-series also reveals the [Ca II] features emerge already by +85 days. Over time the strength of the [Ca II] emission increases relative to the continuum flux, with each component exhibiting an FWHM velocity of ∼1200 km s−1. This is reminiscent of some SNe Iax’s, for example, SNe 2005hk, 2008A and 2010ae (Sahu et al. 2008; McCully et al. 2014; Stritzinger et al. 2014).
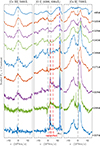 |
Fig. 15. Post-maximum (+85 to +337 days) spectra of ASASSN-20jq plotted in velocity domain with respect to the rest wavelengths, as indicated on top of figure panels, of [Co III] (left), [O I] (middle) and [Ca II] (right) lines. The pair of the black dashed lines in the middle panel represents the rest-positions of the [O I] doublet components. The pair of red-dashed lines represent the position of the [O I] doublet redshifted by 2200 km s−1 to best match the observed feature beyond +229 d. The [Ca II] doublet in right panel shows a systematic redshift of ≈1700 km s−1 throughout the evolution. |
In the middle panel of Fig. 15, we can see a prominent and narrow emission line with an extended feature on its red side (between 2000 to 6000 km s−1) starting from +229 d. The peak of the feature is close to the 6364 Å, which is the red component of the [O I] doublet. However, the lack of any such emission at 6300 Å poses a problem because at the late nebular phase, in the partially optically thin limit, the 6300 Å component of the doublet is expected to be equal or stronger in strength compared to the 6364 Å line (ranges within 1 < L6300/L6364 < 3 from optically thick to thin limit; e.g., Li & McCray 1992; Jerkstrand et al. 2014). Therefore, we suggest this structure is associated with an [O I] doublet (λλ6300, 6364) redshifted by ≈2200 km s−1, which would imply the prevalent emission peak is the redshifted 6300 Å component. The top panel of Fig. 16 shows the zoomed region of the tentative [O I] doublet for the last three nebular spectra. In the plot, a pair of vertical solid red lines are included that correspond to the redshifted positions of the [O I] doublet. This nicely coincides with the peak and the structure of the emission features. The identification of the redshifted [O I] doublet is further corroborated by the similar redshift observed in the [Ca II] emission doublet. To further validate the [O I] line identification, in the bottom panel of Fig. 16 we fit the doublet components and estimate a flux ratio of L6300/L6364 ≈ 1.67, which is well within the expected range of the line transitioning from optically thick to thin limit. We also considered other possibilities for the origin of this emission feature. The peak of the emission line coincides with Si IIλ6355, but such narrow emission associated with Si II is not expected at such late phases. We also considered the possibility of Hα emission blue-shifted by ∼10 000 km s−1, though eventually rejected this scenario due to a lack of any similar narrow Hβ emission feature.
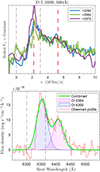 |
Fig. 16. Top panel: [O I] λλ6300, 6364 doublet region for the last three nebular spectra of ASASSN-20jq are plotted in velocity domain with respect to 6300 Å. The pair of black dashed lines represent the rest position of the [O I] doublet lines λλ6300, 6364, while the dashed red lines represent the [O I] doublet redshifted by ≈2200 km s−1. Bottom panel: Pseudo-continuum subtracted [O I] λλ6300, 6364 doublet region of the +229 d spectrum. A two-component Gaussian profile is fitted with FWHM constrained to be the same. The flux ratio of the doublet components L6300/L6364 is estimated to be ≈1.67 and the FWHM for each component is ≈1900 km s−1. |
Beginning by at least +122 days, ASASSN-20jq exhibits a highly asymmetric tilted-top [Fe II] λ7155 emission line profile that remains throughout the nebular phase. This is identical to the [Fe II] 1.644 micron line profile of ASASSN-20jq as illustrated by Fig. 17. The blue and red wings of both [Fe II] emission lines are almost symmetrically positioned about the rest wavelengths. However, the asymmetric tilted top of the line profiles makes the peak appear to be shifted red-ward by ≈1400 km s−1. As discussed in Sect. 7.2, the nebular line profiles provide clues to the explosion physics and viewing angle.
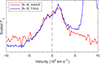 |
Fig. 17. Comparison of optical [Fe II] λ7155 and NIR [Fe II] λ16 433 nebular emission lines plotted in velocity scale. Both lines have identical profiles, being highly asymmetric with a tilted top and peaks redshifted by ≈1400 km s−1. |
6. Host-galaxy properties
The host galaxy of ASASSN-20jq is classified as a lenticular, irregular barred spiral (SBm) galaxy, which is the same designation for the Large Magellanic Cloud (LMC). Such galaxies have a disk but lack spiral arms, are of low gas content, and as a result, typically have low star formation rates (SFRs).
An optical spectrum of the host-galaxy NGC 5002 was obtained by the Sloan Digital Sky Survey (SDSS-II; Abazajian et al. 2009). Fortuitously, the location of the instrument fiber was also placed only 3″ away from the location of ASASSN-20jq. The extracted 1D spectrum is plotted in Fig. 18. The spectrum was fit using the stellar population package STARLIGHT (Cid Fernandes et al. 2005), providing a best-fit combination of simple stellar population (SSP) models. The resulting fit was removed from the observed spectrum and the resulting pure gas-emission phase spectrum of NGC 5002 is also shown in Fig. 18.
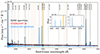 |
Fig. 18. 1D spectrum extracted (black line) from an SDSS-II spectral observations of NGC 5002, obtained from a position in proximity to ASASSN-20jq and with prominent nebular emission features from the host marked and labeled. The underlying stellar population is modeled using STARLIGHT (red line) and subtracted from the observed spectrum. The resulting gas-phase spectrum is shown in blue. The most prominent [O III] λ5007 is saturated and therefore masked by a yellow band. A single Gaussian function was fit to the nebular lines plotted within the insets. Flux ratios of these lines combined with the calibrations of Pettini & Pagel (2004) and Dopita et al. (2016) indicate a sub-solar gas-phase metallicity. |
The extinction-corrected line flux measurements were used to estimate both the gas-phase metallicity (12 + log(O/H)) and SFR density (ΣSFR). Unfortunately, the [O III] λ5007 feature is saturated and has been removed from the public spectrum. We therefore turned to the OH_N2 calibration from Pettini & Pagel (2004) and OH_S2 from Dopita et al. (2016), providing metallicity values of 8.263 ± 0.003 dex and 8.021 ± 0.009 dex, respectively. These oxygen abundance values correspond to 0.37 and 0.21 times the solar metallicity value (i.e., ∼8.69 dex, Asplund et al. 2009), thereby bracketing the oxygen abundance of the Small Magellanic Cloud (SMC), which is approximately 0.25 times the solar value, or equivalently ∼8.03 dex (e.g., Russell & Dopita 1992). This value would predict a significant [O III] λ5007 emission, which is consistent with the feature being completely saturated in the observed SDSS spectrum; see region in Fig. 18 highlighted in yellow. In comparison, this value falls within the bottom 5th percentile of the PISCO sample (Galbany et al. 2018; updated as of September 2024), which represents the largest collection of SN host galaxies observed using integral field spectroscopy. The most metal-poor SN Ia host galaxy in this sample has a metallicity of 7.98 dex and is associated with SN 2003du.
We next estimate the SFR which in turn provides an estimate of the SFR density (ΣSFR) and the specific SFR (hereafter sSFR) of NGC 5002. We measure an Hα flux value of (2.47 ± 0.12) × 10−15 erg s−1 from the gas-phase stellar-subtracted SDSS-II spectrum. Based on the Kennicutt (1998) calibration between Hα flux and SFR suggests NGC 5002 has a SFR of (5.85 ± 0.02)×10−4 M⊙ yr−1. Dividing the SFR by the area covered by the SDSS-II fiber in Kpc gives a gas phase SFR density of ΣSFR = (1.27 ± 0.03)×10−5 M⊙ yr−1 kpc−2. This value corresponds to the 50th percentile compared to all PISCO SNe Ia host galaxies, in other words it has an average sSFR value in relation to the PISCO sample. To estimate the sSFR we simply divide the SFR estimate above by the stellar mass covered by the fiber, which from the STARLIGHT fit shown in Fig. 18 indicates (7.20 ± 0.23)×105 M⊙. This implies a sSFR of (8.12 ± 0.02)×10−10 yr−1. This corresponds to the 50th percentile compared to all PISCO SNe Ia host galaxies.
Next, from the Hα feature in the subtracted SDSS-II spectrum, we measure a high pEW value of 168 ± 0.5 Å. Using the SSP models from Starburst99 (Leitherer et al. 1999), the pEW value is consistent with ionization of the gas driven primarily by a very young stellar population of only a few million years old. Indeed, the average luminosity weighted age of log10 = 7.25 ± 1.51, or roughly 10–15 Myr, is inferred by our STARLIGHT SSP fitting. Comparing to the PISCO sample, these two values are in the 1st percentile of the PISCO sample.
7. Discussion
7.1. Comparison of ASASSN-20jq with 2002es-like and other similar underluminous SNe Ia
ASASSN-20jq exhibits many photometric and spectroscopic characteristics that deviate from normal SNe Ia, but are more consistent with SN 2002es and some of the other members of the 2002es-like subclass. We now highlight some of the similarities among the 2002es-like population, and when appropriate explore the growing observational diversity within the sample.
7.1.1. Light curve evolution
As shown in Fig. 2, the i-band light curve of ASASSN-20jq does not display two distinct peaks; instead, it exhibits a single peak, a characteristic commonly observed among most subluminous 1991bg-like, 2002es-like, and even Iax SNe. Measurement of the peak times for the B- and i-band light curves yields  values close to zero. As illustrated in Fig. 5, this positioning places ASASSN-20jq within a relatively sparsely populated area of the parameter space. The figure further shows that, while the expanding sample of 2002es-like and 2006bt-like supernovae tend to have
  values confined to a narrow range between 0 and +3 days, their sBV values span a broader range that includes both subluminous 1991bg-like objects and, occasionally, 2003fg-like SN Ia subclasses.
The intrinsic B − V colors of ASASSN-20jq at peak and along the Lira relation are redder than those of normal SNe Ia, although they are not as red as SN 1991bg (see Fig. 6). This trait is typical among 2002es-like objects (Xi et al. 2024). Additionally, as illustrated in Fig. 8, ASASSN-20jq reaches a peak MB that is significantly underluminous relative to its inferred light-curve decline-rate parameter, Δm15(B), a pattern consistent with the extended 2002es-like comparison sample. Notably, as demonstrated in the right panel of Fig. 8, even after correcting for light curve shape using the sBV parameter, ASASSN-20jq remains a considerable outlier relative to the 2002es-like comparison sample and SN 2016hnk.
In examining the early light curve evolution presented in Sect. 4.2, the flux of ASASSN-20jq during the first 1.4 days of explosion is approximately 2 magnitudes brighter than predicted by the expanding fireball model with a single power-law fit (see Fig. 4). A two-day gap between the initial and subsequent photometric epochs limits detailed analysis, yet the presence of early excess emission in the rising light curve of ASASSN-20jq agrees with other 2002es-like SNe Ia discovered and followed up shortly after explosion, including iPTF14atg (Cao et al. 2015), iPTF14dpk (Cao et al. 2016), SNe 2016jhr (Jiang et al. 2017), 2019yvq (Miller et al. 2020; Burke et al. 2021; Tucker et al. 2021), 2022vqz (Xi et al. 2024), and 2022ywc (Srivastav et al. 2023).
In the days following tfirst, each of these SNe Ia displayed an early flux excess, about two magnitudes or more above what would be anticipated from the expanding fireball model. This initial phase includes a rapid brightening, creating a distinct “bump” of varying intensities. For instance, ASASSN-20jq and iPTF14atg reached initial absolute magnitudes around −14.5 to −15 in the optical, while SNe 2016jhr, 2019yvq, and 2020vqz were brighter, around −16 to −16.5. In the case of the extraordinary SN 2022ywc, the early absolute magnitude reached as high as −19. Furthermore, the rise times to maximum brightness across the 2002es-like sample show diversity. iPTF14atg reached peak in approximately 22 days (Cao et al. 2016), iPTF14dpk in about 16 days, SN 2016jhr in 18.9 days, SN 2019yvq in 17.5 days (Burke et al. 2021), ASASSN-20jq in roughly 20.4 days, SN 2022vqz in approximately 18.6 days (Xi et al. 2024), and SN 2022wyc in 20.9 days (Srivastav et al. 2023).
We note that the initial outburst radiation field for these SNe are ultraviolet (UV) prevalent, as revealed by Swift in iPTF14atg (Cao et al. 2015) and SN 2019yvq (Miller et al. 2020; Burke et al. 2021; Tucker et al. 2021). However, for ASASSN-20jq we lack UV observations to identify such UV excess. Similar UV excesses and blue UV colors have been identified in 2003fg-like SNe Ia (Hoogendam et al. 2024). In these cases, early UV emission could be a signature of interaction between the expanding SN ejecta and circumstellar material (CSM) (e.g., Levanon & Soker 2017; Moriya et al. 2023; Maeda et al. 2023; Hoogendam et al. 2024). However, it should also be noted that deep radio observations of several SNe Ia could never detect early radio emissions to infer any CSM interaction (see e.g., Chomiuk et al. 2016; Lundqvist et al. 2020). Other scenarios that may explain the rising light curves are (i.) the interaction between the expanding SN ejecta and a nondegenerate companion (Kasen 2010; Maeda et al. 2014), (ii.) significant mixing of 56Ni to the outer layers of the ejecta (Piro & Morozova 2016; Magee et al. 2018) or (iii.) 56Ni synthesized in the outer ejecta following a surface ignited double detonation (Nomoto 1982; Woosley & Weaver 1994; Livne & Arnett 1995; Hoeflich & Khokhlov 1996; Shen et al. 2018), and finally, (iv.) the violent merger of two WDs (Iben & Tutukov 1984; Webbink 1984; Pakmor et al. 2010, 2012).
7.1.2. Spectroscopy
The comparison of optical spectra taken around maximum light in Fig. 11 reveals a number of commonalities among ASASSN-20jq and 2002es-like SNe Ia. These SNe Ia exhibit prominent intermediate mass element features of Si IIλλ5972, 6355, O Iλ7773, and Ca II near-infrared (NIR) triplet absorption. The strength of these features in the 2002es-like objects are generally stronger than seen in normal SNe Ia, suggestive of a lower ionization state of the underlying emission region (Nugent et al. 1995). We go on to explore the diversity among key spectral indicators associated with Si II and O I features. We briefly touch on the presence or lack thereof of features associated with Ti II at ≈4150 Å and C IIλ6580 lines.
Referring to the Branch diagram in Fig. 12, since 2002es-like objects tend to reach lower peak luminosities than normal SNe Ia, their underlying ionization state leads to them exhibiting substantial overlap with the CL SN Ia parameter space, which is primarily occupied by transitional and subluminous SNe Ia.
The comparison sample of 2002es-like objects also extends beyond this region, moving towards the 2003fg-like subclass and reaching pEW values of Si IIλ5972 as low as approximately 20 Å. The 2002es-like sample shows minimal, if any, overlap with the SS and CN subclasses of SNe Ia. Lastly, two objects, SNe 2006bt and 2019yvq, which are not necessarily bona fide members of the 2002es-like group, have broader Si II features, placing them among the BL subtype.
Examining the energetics of 2002es-like SNe, as traced by v(Si II)abs (see the Wang diagram in Fig. 15), we find that most of the comparison sample exhibits velocities between −6000 and −10 000 km s−1. However, SN 2006ot and ASASSN-20jq reach velocities near the threshold that separates normal from high-velocity SNe Ia (i.e., v(Si II)abs ≈ −11500 km s−1), while SNe 2006bt and 2019yvr show even higher values, exceeding −14 000 km s−1.
Focusing on the O I λ7773 feature, ASASSN-20jq shows a pEW of 220 Å, which is nearly twice as strong as in subluminous SNe Ia and almost four times higher than in CN SNe Ia (Zhao et al. 2016). This value ranks as the highest within the 2002es-like comparison sample, whose measurements include: SN 2002es (pEW ≈ 93 ± 3 Å), SN 2006bt (pEW ≈ 97 ± 2 Å), SN 2006ot (pEW ≈ 98 ± 1 Å), SN 2010lp (pEW ≈ 133 ± 3 Å), iPTF14atg (pEW ≈ 87 ± 1 Å), SN 2016ije (pEW ≈ 114 ± 2 Å), SN 2019yvq (pEW ≈ 62 ± 5 Å), SN 2022vqz (pEW ≈ 70 ± 2 Å), and SN 2022ywc (pEW ≈ 57 ± 2 Å).
Referring to the +3 days spectrum of SN 2002es in Fig. 11, a flux suppression can be seen between 4000–5000 Å. A more pronounced absorption trough is visible in SN 1991bg (peak MB = −16.9 mag), while a weaker dip is noted in the transitional SN 1986G (peak MB = −17.8 mag). The presence and strength of this trough are temperature-dependent, leading to the formation of Ti II (Filippenko et al. 1992a), with additional contributions from Fe II and Mg II lines (e.g., Mazzali et al. 1997; Doull & Baron 2011). Brighter SNe Ia generally have higher photospheric temperatures at peak where Fe II transitions dominate the blue part of the optical spectrum. In even hotter SNe Ia, like 1991T-like and 2003fg-like events, Fe III features become more prominent due to the higher ionization state.
As seen in Fig. 11, SN 2002es (peak MB = −17.8 mag) and SN 2010lp (peak unknown) display a Ti II feature that has been considered characteristic of the 2002es-like subclass. However, in the maximum light spectra of SN 2006bt (peak MB = −18.8 mag), SN 2019yvq (peak MB = −18.4 mag), and ASASSN-20jq (MB = −17.1 mag), this trough is absent or very weak. The relationship between the feature and luminosity is not straightforward. For instance, SN 2022ywc (peak MB ∼ −19 mag) also shows significant suppression in the 4000–5500 Å range, similar to SN 2016hnk (peak MB = −16.7 mag). While the presence of weak Ti II features has been suggested in other 2002es-like SNe, such as PTF10ops (peak MB = −17.7 mag), iPTF14atg (peak MB = −17.9 mag), SN 2016ije (peak MB = −17.7 mag), and SN 2022vqz (peak MB = −18.1 mag), we consider the evidence in these cases to be rather inconclusive.
We conclude our discussion of the photospheric phase spectra by focusing on carbon, which as carbon burning produces oxygen, likely indicates unburned material from the C + O WD progenitor. However, only a handful of C II lines appear in the optical range, and these are generally quite weak compared to the more prominent spectra features. C II features typically emerge in the days following the explosion, with C IIλ6580 being the most prominent, often appearing as a notch redward of the Si IIλ6533 line. The C IIλ6580 feature is observed in the pre-maximum spectra of about 30% of normal SNe Ia (Parrent et al. 2011; Thomas et al. 2011; Folatelli et al. 2012; Silverman et al. 2012). It is also prevalent in the pre-maximum spectra of SN 2006gz (Hicken et al. 2007) and in some other 2003fg-like SNe Ia, such as SN 2009dc (Yamanaka et al. 2009), SN 2007if (Scalzo et al. 2010), SN 2012dn (Taubenberger et al. 2019), LSQ14fmg (Hsiao et al. 2020), PSN J0910+5003 and ASASSN-16ex (Tiwari et al. 2023).
A persistent and relatively prevalent C IIλ6580 feature has been identified in the 2002es-like iPTF14atg with a v(C II)abs ≈ −6000 km s−1 (Cao et al. 2015) and in SN 2016ije with a v(C II)abs ≈ −4500 km s−1 (Li et al. 2023). Foley et al. (2010) reported evidence of C IIλ6580 in the −4 and −3 days spectra of SN 2006bt with v(C II)abs ≈ −5200 km s−1, and by reaching maximum light the feature no longer appeared in its spectrum. Since this velocity is lower than what is typically observed in normal SNe Ia, Foley et al. (2010) suggested that the carbon might result from circumstellar interaction with carbon-rich material. However, as with normal SNe Ia, carbon is not universally present in 2002es-like objects, with no evidence of C II in the pre-maximum spectra of PTF11ops (Cao et al. 2015), SN 2019yvq (Miller et al. 2020), or SN 2022vqz (Xi et al. 2024). The −9 days spectrum of ASASSN-20jq shows a notch just redward of the Si IIλ6533 emission component, which, if caused by C II, would imply an unusually low velocity of v(C II)abs ∼ −2300 km s−1.
We shift our focus to the nebular optical spectra of ASASSN-20jq and other 2002es-like objects. Over time, these sources offer an increasingly deeper view into the inner regions of the ejecta. The nebular spectra of ASASSN-20jq resemble those of SN 1991bg, but with even weaker Fe-group complexes due to an absence of [Fe III] lines, as shown and labeled in Fig. 14. ASASSN-20jq closely resembles the 2002es-like SN 2010lp, sharing similarly weak Fe-group element complexes and a prominent double-peaked [Ca II] feature. Additionally, the nebular spectrum of SN 2010lp displays a complex double-peaked [O I] λλ6300,6363 emission doublet on top of a broad base. The emission features of SN 2010lp exhibit a full width at half maximum (FWHM) velocity of approximately 1700 km s−1. Interestingly, these features are blueshifted and redshifted by 2000 km s−1 and 1800 km s−1, respectively, relative to the [O I] λ6300 rest wavelength, suggesting the presence of an asymmetric oxygen emission region in SN 2010lp (Taubenberger et al. 2013). A similar feature, attributed to [O I] λλ6300,6363, was observed in the nebular spectrum of iPTF14atg (Kromer et al. 2016), although the low S/N of the data prevented precise measurements of these features.
As discussed in Sect. 5.2 and shown in Fig. 16, the three nebular spectra of ASASSN-20jq, taken between +229 and +357 days, reveal a feature that likely corresponds to a double-peaked [O I] λλ6300,6363 doublet, redshifted by ≈2200 km s−1, with an FWHM of ≈1900 km s−1 for each component. Unlike core-collapse SNe, [O I] emission is extremely rare to be detected in SNe Ia. Based on the analysis of the nebular spectrum of ASASSN-20jq, the redshifted [Ca II] and the tentative [O I] features may be explained by a viewing angle effect combined with an asymmetric explosion (see Section 7.2).
We also considered the possibility of the origin of the redshifted [O I] and [Ca II] lines from the leftover material stripped off from a nondegenerate He-rich companion (see Liu et al. 2013; Lundqvist et al. 2015). Liu et al. (2013) models suggest that depending on the viewing angle to the axis of SN and companion, these emission lines are shifted by ∼500 − 2000 km s−1. Lundqvist et al. (2015) suggested in such a scenario [O I] and [Ca II] emission lines of widths of ∼1000 km s−1 would be formed. Although such a scenario might explain the redshifted [O I] and [Ca II] lines that we observe in ASASSN-20jq, it is expected that the strength of those lines from stripped-off materials will be much weaker than that we see in ASASSN-20jq. For ASASSN-20jq the peak intensities are ∼1.5 − 9.0 × 10⁻¹⁷ erg s−1 cm−2 Å−1 for [O I] and [Ca II] lines at +229 days. Lundqvist et al. (2015) modeled such stripped off emission lines for SNe 2011fe and 2014J, which at the distance of ASASSN-20jq are two orders of magnitude weaker than the [O I] and [Ca II] line intensities of ASASSN-20jq. Additionally, Botyánszki et al. (2017) predicted from their non-local thermodyamic equilibrium (NLTE) nebular spectral modeling that lines originating from materials stripped from hydrogen-rich or helium-rich companion would also show He I lines stronger than [O I] and [Ca II] lines, and in case of ASASSN-20jq no He I lines are detected. Therefore, we disfavor the origin of these lines from stripped-off materials.
We conclude this section by mentioning the host properties of ASASSN-20jq in the context of the known characteristics of 2002es-like SN hosts. White et al. (2015) previously noted (based on a limited sample of 2002es-like SNe identified by PTF/iPTF) that these events typically occur in massive early-type, luminous galaxies with minimal star formation. However, as the sample of 2002es-like SNe has grown, exceptions to this trend have emerged. For instance, SN 2016ije was found in a bluer, low-mass star-forming galaxy (Liu et al. 2023), which is more comparable to the host of ASASSN-20jq.
7.2. Extending the Hoeflich et al. (2021) model comparison to optical wavelengths
Hoeflich et al. (2021) presented a NIR spectrum of ASASSN-20jq obtained at +192 days past the epoch of B-band maximum with the W. M. Keck Observatory equipped with the Near Infrared Echellette Spectrograph (NIRES), along with a model spectrum computed with the HYDRA (HYDro RAdiation) transport code (Hoeflich 1990; Hoeflich et al. 1995, 2017; Höflich 2003, 2009). In the following, the synthetic spectrum at optical wavelengths is compared with the late-phase observed spectrum of ASASSN-20jq. Before doing so, we first present a concise summary of the model details. For a comprehensive description of the numerical methods and model setup, the reader is referred to Hoeflich et al., (2021, see their Sect. 4 and references therein).
Hoeflich et al. successfully modeled the NIR spectrum of ASASSN-20jq with a high-central density WD near accretion-induced collapse, that underwent an off-center DDT, producing (similar to transitional SNe Ia, e.g., Gall et al. 2018) comparable amounts of 56Ni during the deflagration and detonation phases. In this scenario, large-scale asymmetries associated with the deflagration phase burning products are absent. However, the off-center DDT triggers a detonation burning phase that produces a 56Ni bulge. This asymmetry in the ejecta gives rise to tilted-top Fe line profiles and prominent [Ca II] emission features (see below). These unique conditions explain the observed spectral asymmetries and light-curve peculiarities, distinguishing ASASSN-20jq as a rare SNe Ia event (see Hoeflich et al. 2021, for details). The production of comparable amounts of 56Ni in the deflagration and detonation phases is in contrast to Branch-normal (56Ni production is dominant in the detonation phase) and subluminous SNe Ia, where 56Ni production is dominant in the deflagration phase. Furthermore, the absence of low-velocity 56Ni in ASASSN-20jq reduces radioactive energy storage in the inner regions, resulting in enhanced energy emission around maximum brightness compared to predictions from Arnett’s law (Arnett 1982). This mechanism in combination with the opacity is linked to the brightness-decline relation for typical SNe Ia. Consequently, the light curve of ASASSN-20jq approaches the radioactive decay curve with a slower post-maximum decline, further distinguishing it from typical SNe Ia (e.g., Hoeflich et al. 1993, 2017; Kasen et al. 2006).
The synthetic spectrum presented in Hoeflich et al. (2021) is the result of a 3D NLTE radiative and particle transport calculations based on density and abundance profiles generated from a 2-D hydrodynamic simulations for the high-density WD disrupted following an off-center DDT. The explosion model is one of a grid of models spanning normal-bright to subluminous SNe Ia (Hoeflich et al. 2017). As detailed in Hoeflich et al. (2021), model 5p02822d40.16 is most aligned with key photospheric phase observables of ASASSN-20jq, including its peak brightness and light-curve decline rate. The model consists of a relatively high central density (ρc = 4 × 10⁹ g cm−3) C + O MCh-mas WD evolved from a 5 M⊙ main sequence star with solar metallicity. This high central density is a requirement to produce the flatter profile with a tilted top of [Fe II] lines, as seen in Fig. 17. While the environment around ASASSN-20jq indicates low metallicities (similar to those of the SMC), the models presented here did not account for this. The metallicity effect on the nuclear burning should be small, since the density dominates the electron capture rates. However, the low metallicity would affect the cooling and hence the accretion rate in single progenitor and secular merger scenarios. The high densities we find require low accretion rates, which are compatible with lower metallicity; however, this was not directly accounted for in our modeling.
Figure 19 provides a schematic of the adopted explosion model. Initially, a thermonuclear runaway occurs within the central region of the WD with nuclear burning occurring within a subsonically propagating deflagration flame front. As the central region of the WD is consumed, the WD’s core expands with a velocity of ∼2000 − 3000 km s−1, leaving within its ashes an inner region consisting mostly of stable electron capture (EC) elements (e.g., 54Fe, 54Co and 58Ni), surrounded by a spherical shell of mostly radioactive 56Ni. Upon burning MDDT = 0.3 M⊙ of the WD and the leading edge of the deflagration flame front reaches the transition density of ρtr = 1.6 × 10⁷ g cm−3, an off-center detonation is launched at a single point located along the north pole extending from the center of the WD. As the off-center DDT occurs on an already expanding background, it takes time for the detonation burning front to propagate to the opposite side of the WD. When the burning front does reaches the opposite side of the WD, burning occurs under lower densities (as density decreases cubically over time) and hence at lower temperatures. Consequently, an asymmetric distribution of all burning products including Ca and 56Ni is produced during the detonation burning phase. As indicated in Fig. 19, the asymmetric distribution of 56Ni leads to a banana shape ring distributed between ∼0° to 180° azimuthally around the outer deflagration ash. The ring becomes thicker with increasing brightness and decreasing central density of the WD. In addition to 56Ni, the distribution of 40Ca produced during the detonation phase is also asymmetric, and is distributed following a similar banana-shape with a ring distribution as the 56Ni. This naturally leads to the viewing angle effects on the line profiles as demonstrated in Hoeflich et al. (2021, as shown in their Fig. 3).
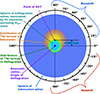 |
Fig. 19. Schematic outlining the Hoeflich et al. (2021) off-center DDT explosion model of a MCh-mass C + O WD. Initially, centrally located C + O burning initiates a deflagration flame front, which due to the high central density of the WD, produces an inner, spherical region of electron capture (EC) elements (depicted by filled cyan circle) consisting mostly of stable Fe-group elements. The EC region lays within a spherical shell of remaining deflagration ash consisting mainly of radioactive 56Ni (green ring). After consuming 0.3 M⊙ of the WD and the leading edge of the deflagration flame front reaches ρtr, a ∼2000 km s−1 off-center DDT is triggered (black point). As the DDT occurs on a moving background, the detonation burning front requires time to reach and fully consume the remaining C + O ejecta. As a result, the detonation burning products are distributed asymmetrically, and as depicted in the schematic by the intensity of yellow which reflects the abundance mass fraction of 56Ni, the majority of the 56Ni produced during the detonation burning phase is distributed in a banana shape region with a ring surrounding the deflagration burning ash and along a positive viewing angle relative to the equator. Depending on the viewing angle, nebular emission lines will appear blue- or red-shifted. |
Figure 20 offers a comparison of the optical/NIR nebular spectrum of ASASSN-20jq with the synthetic spectrum of model 5p02822d40.1. With an ≈40 day difference in phase, the optical/NIR nebular spectra are not exactly matched in phase; however, as the spectral features evolve slowly (see Fig. 14) and the synthetic spectrum corresponds to ∼+205 days, the comparison can be considered robust. The model generally matches well with the optical spectral range, particularly with the prominent [Ca II] feature and most of the major line complexes. The prevalent [Ca II] feature in the synthetic spectrum is produced by 40Ca created during the detonation burning phase. The [Ca II] emission is a consequence of the significant overlap between the abundance profiles of 40Ca and 56Ni (see Fig. B.1). Furthermore, the [Ca II] feature is double peaked and redshifted as natural consequence of a −90o viewing angle (see also Hoeflich et al. 2021, their Fig. 4 inset).
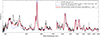 |
Fig. 20. Spectral synthesis model of the optical and NIR nebular spectrum. The optical spectrum was obtained on +229 days and the NIR spectrum on +192 days (Hoeflich et al. 2021). Over-plotted in blue is the synthetic spectrum computed from a MCh C + O WD disrupted following an off-centered delayed detonation explosion. This model is computed with a viewing angle of −90° as defined by the schematic in Fig. 19. At the blue end of the optical spectrum the model underestimates the flux of several Fe II+ Fe III complexes. After recomputing the explosion model with the addition of a 2000 km s−1 macroscopic mixing scale of the 56Ni-Fe into the lower density Ca-layer (see Fig. B.1), we obtain the synthetic spectrum shown in red. The mixing model better reproduces the [Fe II], [Fe III], [Co II], and [Co III] line complexes between ∼4000 − 6000 Å and ∼8500 − 9000 Å. The observed spectra have been scaled arbitrarily to match the model results. |
Turning our attention to bluer wavelengths, the synthetic spectrum does show flux deficiencies relative to the observed spectrum at the positions of several key Fe-group element complexes. This includes line complexes associated with higher ionization lines such as: [Co II] λ4154, [Co II] λ4624, [Fe III] λ4659, [Co III] λ5890, [Fe III] λ5272, [Co III] λλ6129,6197, [Co II] λ8123, and [Fe II] λ8619.
We exclude both changes in the inclination angle towards a more equatorial directions, and the 56Ni abundance as the culprit of the discrepancy given the inherent degradation to the line profiles including both the conspicuous optical [Ca II] λλ7291,7324 and NIR [Fe II] λ1.644 μm features. Other possibilities could be related to physical 3-D effects not included in the model. This could take the form of either microscopic and/or macroscopic mixing driven by velocity fields produced during the deflagration burning phase. Microscopic mixing is known to enhance the Si and S lines in the NIR for both normal-bright and subluminous SNe Ia, but does not boost the optical Fe-group complexes (see Höflich et al. 2002; Diamond et al. 2018). On the other hand, macroscopic mixing of the 56Ni to lower-density layers effectively reduces recombination, which in turn produces a higher-ionization state and thus increased emission from high ionization lines such as those associated with [Fe III] and [Co III], and the permitted Ca II NIR triplet.
To this end, macroscopic, radial mixing was implemented into the benchmark model which alters the final abundance profiles. This was accomplished by including a velocity scale growing from 20% of the local expansion velocity to a maximum value of 2000 km s−1, which is the expected typical value of Rayleigh-Taylor instability driven large plumes of burnt material and corresponding downdrafts of unburnt material ubiquitous to deflagration models (Khokhlov 2001; Gamezo et al. 2003). The outcome of the inclusion of macroscopic mixing is revealed by Fig. B.1 which contains the original model and the mixed model abundance profiles. The inclusion of macroscopic mixing effectively leads to an increased overlap (in velocity space) between the 56Ni-rich region and the Ca region. As can be seen in Fig. 20, the mixed model shows much better agreement with the previously noted Fe-group element complexes and the Ca II NIR triplet. Further comparison between the observed and synthetic spectrum reveals the model underestimates the flux of the purported [O I] feature as well as another small feature around 8000 Å likely formed by Si IIλλ8044, 8243 and straddled between the [Ca II] and Ca II NIR triplet. The [O I] could possibly be strengthened by additional mixing of oxygen into deeper layers.
Turning to the nebular Fe-group line profiles associated with the forbidden lines of [Co III] λ5888, [Fe II] λ7155 and [Fe II] 1.644 μm, and the intermediate-mass elements (IMEs) of forbidden [O I] λλ6300,6364, and [Ca II] λλ7291,7324, inspection of Figs. 15 and 17 reveals that the Fe-group lines show no velocity shifts relative to their rest wavelengths, while the IMEs lines of [O I] and [Ca II] show red-shifts on the order of 2200 km s−1 and 1700 km s−1, respectively. The [O I] lines are narrow, the FWHM of the Gaussian fit of Fig. 16 is only ∼1900 km s−1, implying that the excited oxygen is confined to a relatively narrow region of velocity space. In relation to the off-center DDT model, as ∼50% of the synthesized 56Ni is produced during the deflagration burning phase, it is distributed centrally in a roughly spherical configuration. On the other hand, the O and Ca features come from elements synthesized during the detonation burning phase and hence are located in the inner edge of the material above the point of the DDT as defined in Fig. 19. The narrow velocity extent is due to the fact that only excited oxygen emits and there can be more oxygen in the ejecta than just that seen in the optical spectrum.
8. Summary
In this work, we present a detailed analysis and comparison of optical photometry and spectroscopy of the SN Ia ASASSN-20jq located in a metal poor galaxy with a very young stellar population, and average star formation rates. ASASSN-20jq is a low-luminosity object peaking at an absolute B-band magnitude MB = −17.1 mag. The light-curve shape parameters of Δm15(B) = 1.35 ± 0.09 mag and sBV ⪆0.82 are well within the range of normal SNe Ia. Combined with the inferred peak absolute magnitude, we find ASASSN-20jq to be a prominent outlier in both the luminosity-width and luminosity-color-stretch relations. It appears ∼2.5 mag fainter than implied by these calibration relations, which has not been seen for any other SNe Ia. The i-band post-maximum light curve of ASASSN-20jq does not show a secondary maximum, but a flatter evolution instead. This is characteristic of 1991bg-like SNe Ia, as opposed to normal SNe Ia exhibiting distinct double peaks.
We estimated the explosion epoch of ASASSN-20jq to be −20.4 days before the B-band maximum by assuming a power-law early-time rising light-curve while taking into account the first detection and nondetection limits. This rise-time to maximum is within the observed diversity of 2002es-like SNe. ASASSN-20jq is estimated to have a 56Ni mass of 0.088 ± 0.008 M⊙, making it one of the lowest 56Ni mass estimate for SNe Ia. We note that only a few underluminous 1991bg-like SNe are known to have a comparable 56Ni mass.
The photospheric phase spectra of ASASSN-20jq are mostly similar to 1991bg-like and under-luminous 2002es-like objects. However, it lacks a strong ∼4150 Å Ti II feature at maximum light, which is characteristic of most under-luminous objects. ASASSN-20jq shows unusually strong Si IIλλ5972, 6355 absorption lines and, as evident from the Branch diagram, the Si II line pEWs are stronger than most normal or under-luminous objects. In addition, ASASSN-20jq also shows unusually strong O Iλ7773 and Ca II NIR triplet lines which are much stronger (pEW ≳2 times) than those seen in normal or under-luminous objects.
Nebular phase optical spectra of ASASSN-20jq are dominated by [Fe II], [Fe III] and [Co III] lines. While they are much weaker than those seen for normal-luminosity SNe Ia, they do resemble underluminous SNe. However, the [Fe II] λ7155 line is an exception in that it is unusually stronger than that seen in normal, luminous, or underluminous SNe (except the 2002es-like SN 2010lp). We also identify identical tilted-top line profiles for both optical and NIR [Fe II] λ7155 and λ16433 lines, which can be attributed to the viewing angle effect of off-center DDT explosion in the SN. Due to the tilted top of the [Fe II] lines, there is an apparent redshift of the peak position by ≈1400 km s−1. However, the overall structure including the red- and blue-wings is symmetrically positioned around the rest wavelength, indicating no shift in the bulk of the [Fe II] emission. Another striking feature in the nebular phase spectra is the strong and partially resolved [Ca II] λλ7291, 7324 doublet, which can be identified from +122 d onward. Except for a few SN-Iax, such strong and resolved [Ca II] doublet lines are never seen in SNe Ia. In rare cases, strong [Ca II] has been identified in normal SNe Ia only at much later phases (∼400 days), but those are always broad with unresolved doublet components. Additionally, this entire [Ca II] doublet profile is redshifted by ≈1700 km s−1. At ∼6350 Å, all three nebular spectra of ASASSN-20jq show an emission feature with extended red wing. Although our investigation is limited by the low S/N of our spectra, we identified these features as being most likely the [O I] λλ6300, 6364 doublet redshifted by ≈2200 km s−1. The 6300 Å component of the doublet corresponds to the prominent peak of the emission complex, while the pEW of the 6364 Å component is weaker by a factor of 1.67 and dominated by the spectral noise. Detections of [O I] doublet in thermonuclear SNe are extremely rare, having only been conclusively detected in SN 2010lp (Taubenberger et al. 2013) and SN 2022pul (Kwok et al. 2024).
Interestingly, the forbidden emission lines from intermediate mass elements, with respect to [Ca II] and [O I] produced during the detonation burning phase, show a redshift of roughly 2000 km s−1. This is consistent with the off-center DDT scenario for ASASSN-20jq, where the point of detonation is shifted by a few times 103 km s−1 in velocity space with respect to the kinematic center of the explosion. On the other hand, the iron group emission lines of [Fe II], [Fe III], and [Co III] show no discernible shift, as around half of 56Ni is produced during the initial deflagration phase and is centrally distributed. Using theoff-center DDT model, we synthesized the optical and NIR nebular spectra simultaneously. We also introduced macroscopic mixing of the 56Ni-rich region with the low-density Ca-rich layers, which is in good agreement with the observed spectra. Within MCh explosion models, objects similar to ASASSN-20jq are expected to be rare compared to the population of Branch-normal and subluminous SNe Ia. This rarity arises from the specific requirements: a high central-density WD that undergoes an off-center DDT explosion, producing nearly equal amounts of 56Ni during both the deflagration and detonation burning phases.
ASASSN-20jq shows several commonalities with 2002es-like objects, beyond just a faint peak absolute magnitude, normal SNe Ia like Δm15(B) decline rate, and lack of secondary i-band maximum. Spectroscopically, ASASSN-20jq also shows a number of similarities with 2002es-like objects, including the early appearance of detectable [Ca II] at +122 days and strong Si IIλ6355 and O I absorption features. However, 2002es-like objects are a very diverse group of SNe Ia that do not have a well-defined parameter space and ASASSN-20jq further contributes to the diversity of this class. ASASSN-20jq also lacks a number of features that are seen in some (but not all) 2002es-like SNe, including the lack of a Ti II ∼4150 Å feature around maximum light, peak-magnitudes fainter than most well-defined 2002es-like objects and a lack of unburnt carbon in the spectra. However, other spectral characteristics, including the Si III line velocities, are aligned with normal or overluminous 1991T-like SNe Ia.
Expanding upon earlier work of Pskovskii (1977), Phillips (1993) introduced the luminosity decline-rate parameter Δm15(B). This parameter quantifies the change in the brightness of an SN Ia as measured from the B-band light curve between the peak and 15 days later. Phillips demonstrated that Δm15(B) is correlated with the peak luminosity in the sense that bright SNe Ia exhibit light curves that decline more slowly.
The spectra are electronically available at the Weizmann Interactive Supernova Data Repository (https://www.wiserep.org//object/; Yaron & Gal-Yam 2012).
The color-stretch parameter, sBV, is the number of days for the B−V color to reach its maximum value normalized by 30 days (Burns et al. 2014). This epoch marks a transition in the ionization state of the photosphere as Fe III recombines to Fe II (Burns et al. 2014; Wygoda et al. 2019).
The Nugent templates are electronically available at https://c3.lbl.gov/nugent/nugent_templates.html
Acknowledgments
S.B. and M.D.S. are funded by the Independent Research Fund Denmark (IRFD) via Project 2 grant 10.46540/2032-00022B. M.D.S. and E.J. are supported by the Aarhus University Nova grant# AUFF-E-2023-9-28. L.G. acknowledges financial support from AGAUR, CSIC, MCIN and AEI 10.13039/501100011033 under projects PID2023-151307NB-I00, PIE 20215AT016, CEX2020-001058-M, ILINK23001, COOPB2304, and 2021-SGR-01270. NUTS use of the NOT is funded in part by the Instrument center for Danish Astrophysics (IDA). This paper make use of observations from LBT, which is an international collaboration among institutions in the United States, Italy and Germany. LBT Corporation partners are: The University of Arizona on behalf of the Arizona Board of Regents; Istituto Nazionale di Astrofisica, Italy; LBT Beteiligungsgesellschaft, Germany, representing the Max-Planck Society, The Leibniz Institute for Astrophysics Potsdam, and Heidelberg University; The Ohio State University, representing OSU, University of Notre Dame, University of Minnesota and University of Virginia. E.B., C.A., and P.H. acknowledge support from NASA grants JWST-GO-02114, JWST-GO-02122, JWST-GO-04522, JWST-GO-04217, JWST-GO-04436, JWST-GO-03626, JWST-GO-05057, JWST-GO-05290, JWST-GO-06023, JWST-GO-06677, JWST-GO-06213, JWST-GO-06583. Support for programs #2114, #2122, #3626, #4217, #4436, #4522, #5057, #6023, #6213, #6583, and #6677 were provided by NASA through a grant from the Space Telescope Science Institute, which is operated by the Association of Universities for Research in Astronomy, Inc., under NASA contract NAS 5-03127. P.H. acknowledge support for the simulations by the NSF-grants AST-1715133, and AST-2306395. This material is based upon work supported by the National Science Foundation Graduate Research Fellowship Program under Grant Nos. 1842402 and 2236415. Any opinions, findings, conclusions, or recommendations expressed in this material are those of the author(s) and do not necessarily reflect the views of the National Science Foundation. A. F. acknowledges the support by the State of Hesse within the Research Cluster ELEMENTS (Project ID 500/10.006) AR acknowledges financial support from the GRAWITA Large Program Grant (PI P. D’Avanzo). AR, NER and AP acknowledge support from the PRIN-INAF 2022 “Shedding light on the nature of gap transients: from the observations to the models”. JTH is supported by NASA grant 80NSSC23K1431. This work is based on observations made with the Gran Telescopio Canarias (GTC), installed in the Spanish Observatorio del Roque de los Muchachos of the Instituto de Astrofísica de Canarias, in the island of La Palma. A.C. has been supported by ANID Millennium Institute of Astrophysics (MAS) under grant ICN12_009. CPG acknowledges financial support from the Secretary of Universities and Research (Government of Catalonia) and by the Horizon 2020 Research and Innovation Programme of the European Union under the Marie Skłodowska-Curie and the Beatriu de Pinós 2021 BP 00168 programme, from the Spanish Ministerio de Ciencia e Innovación (MCIN) and the Agencia Estatal de Investigación (AEI) 10.13039/501100011033 under the PID2023-151307NB-I00 SNNEXT project, from Centro Superior de Investigaciones Científicas (CSIC) under the PIE project 20215AT016 and the program Unidad de Excelencia María de Maeztu CEX2020-001058-M, and from the Departament de Recerca i Universitats de la Generalitat de Catalunya through the 2021-SGR-01270 grant.
References
- Abazajian, K. N., Adelman-McCarthy, J. K., Agüeros, M. A., et al. 2009, ApJS, 182, 543 [Google Scholar]
- Aldering, G., Adam, G., Antilogus, P., et al. 2002, in Survey and Other Telescope Technologies and Discoveries, eds. J. A. Tyson, & S. Wolff, SPIE Conf. Ser., 4836, 61 [NASA ADS] [CrossRef] [Google Scholar]
- Arnett, W. D. 1982, ApJ, 253, 785 [Google Scholar]
- Ashall, C., Lu, J., Burns, C., et al. 2020, ApJ, 895, L3 [NASA ADS] [CrossRef] [Google Scholar]
- Ashall, C., Lu, J., Hsiao, E. Y., et al. 2021, ApJ, 922, 205 [NASA ADS] [CrossRef] [Google Scholar]
- Asplund, M., Grevesse, N., Sauval, A. J., & Scott, P. 2009, ARA&A, 47, 481 [NASA ADS] [CrossRef] [Google Scholar]
- Becker, A. 2015, Astrophysics Source Code Library [record ascl:1504.004] [Google Scholar]
- Betoule, M., Kessler, R., Guy, J., et al. 2014, A&A, 568, A22 [NASA ADS] [CrossRef] [EDP Sciences] [Google Scholar]
- Bock, G., Shappee, B. J., Stanek, K. Z., et al. 2016, ATel, 8566, 1 [NASA ADS] [Google Scholar]
- Botyánszki, J., Kasen, D., & Plewa, T. 2017, ApJ, 852, L6 [Google Scholar]
- Branch, D., Dang, L. C., Hall, N., et al. 2006, PASP, 118, 560 [NASA ADS] [CrossRef] [Google Scholar]
- Brown, T. M., Baliber, N., Bianco, F. B., et al. 2013, PASP, 125, 1031 [Google Scholar]
- Burke, J., Howell, D. A., Sarbadhicary, S. K., et al. 2021, ApJ, 919, 142 [NASA ADS] [CrossRef] [Google Scholar]
- Burns, C. R., Stritzinger, M., Phillips, M. M., et al. 2011, AJ, 141, 19 [Google Scholar]
- Burns, C. R., Stritzinger, M., Phillips, M. M., et al. 2014, ApJ, 789, 32 [Google Scholar]
- Burns, C. R., Parent, E., Phillips, M. M., et al. 2018, ApJ, 869, 56 [Google Scholar]
- Burrow, A., Baron, E., Ashall, C., et al. 2020, ApJ, 901, 154 [NASA ADS] [CrossRef] [Google Scholar]
- Cao, Y., Kulkarni, S. R., Howell, D. A., et al. 2015, Nature, 521, 328 [CrossRef] [Google Scholar]
- Cao, Y., Kulkarni, S. R., Gal-Yam, A., et al. 2016, ApJ, 832, 86 [Google Scholar]
- Chomiuk, L., Soderberg, A. M., Chevalier, R. A., et al. 2016, ApJ, 821, 119 [NASA ADS] [CrossRef] [Google Scholar]
- Cid Fernandes, R., Mateus, A., Sodré, L., Stasińska, G., & Gomes, J. M. 2005, MNRAS, 358, 363 [Google Scholar]
- Conley, A., Howell, D. A., Howes, A., et al. 2006, AJ, 132, 1707 [NASA ADS] [CrossRef] [Google Scholar]
- Contreras, C., Hamuy, M., Phillips, M. M., et al. 2010, AJ, 139, 519 [Google Scholar]
- Diamond, T. R., Hoeflich, P., Hsiao, E. Y., et al. 2018, ApJ, 861, 119 [Google Scholar]
- Do, A., Shappee, B. J., Tonry, J. L., et al. 2025, MNRAS, 536, 624 [Google Scholar]
- Dopita, M. A., Kewley, L. J., Sutherland, R. S., & Nicholls, D. C. 2016, Ap&SS, 361, 61 [NASA ADS] [CrossRef] [Google Scholar]
- Doull, B. A., & Baron, E. 2011, PASP, 123, 765 [CrossRef] [Google Scholar]
- Filippenko, A. V., Richmond, M. W., Branch, D., et al. 1992a, AJ, 104, 1543 [NASA ADS] [CrossRef] [Google Scholar]
- Filippenko, A. V., Richmond, M. W., Matheson, T., et al. 1992b, ApJ, 384, L15 [CrossRef] [Google Scholar]
- Flewelling, H. A., Magnier, E. A., Chambers, K. C., et al. 2020, ApJS, 251, 7 [NASA ADS] [CrossRef] [Google Scholar]
- Folatelli, G., Phillips, M. M., Morrell, N., et al. 2012, ApJ, 745, 74 [Google Scholar]
- Folatelli, G., Morrell, N., Phillips, M. M., et al. 2013, ApJ, 773, 53 [Google Scholar]
- Foley, R. J., Narayan, G., Challis, P. J., et al. 2010, ApJ, 708, 1748 [NASA ADS] [CrossRef] [Google Scholar]
- Foley, R. J., Challis, P. J., Chornock, R., et al. 2013, ApJ, 767, 57 [Google Scholar]
- Freedman, W. L., Madore, B. F., Gibson, B. K., et al. 2001, ApJ, 553, 47 [Google Scholar]
- Freedman, W. L., Burns, C. R., Phillips, M. M., et al. 2009, ApJ, 704, 1036 [Google Scholar]
- Galbany, L., Anderson, J. P., Sánchez, S. F., et al. 2018, ApJ, 855, 107 [Google Scholar]
- Galbany, L., Ashall, C., Höflich, P., et al. 2019, A&A, 630, A76 [NASA ADS] [CrossRef] [EDP Sciences] [Google Scholar]
- Gall, C., Stritzinger, M. D., Ashall, C., et al. 2018, A&A, 611, A58 [NASA ADS] [CrossRef] [EDP Sciences] [Google Scholar]
- Gamezo, V. N., Khokhlov, A. M., Oran, E. S., Chtchelkanova, A. Y., & Rosenberg, R. O. 2003, Science, 299, 77 [NASA ADS] [CrossRef] [Google Scholar]
- Ganeshalingam, M., Li, W., Filippenko, A. V., et al. 2010, ApJS, 190, 418 [NASA ADS] [CrossRef] [Google Scholar]
- Ganeshalingam, M., Li, W., & Filippenko, A. V. 2011, MNRAS, 416, 2607 [NASA ADS] [CrossRef] [Google Scholar]
- Ganeshalingam, M., Li, W., Filippenko, A. V., et al. 2012, ApJ, 751, 142 [NASA ADS] [CrossRef] [Google Scholar]
- Ganeshalingam, M., Li, W., & Filippenko, A. V. 2013, MNRAS, 433, 2240 [NASA ADS] [CrossRef] [Google Scholar]
- Goldhaber, G., Groom, D. E., Kim, A., et al. 2001, ApJ, 558, 359 [Google Scholar]
- Gómez, G., & López, R. 1998, AJ, 115, 1096 [CrossRef] [Google Scholar]
- Guy, J., Astier, P., Baumont, S., et al. 2007, A&A, 466, 11 [NASA ADS] [CrossRef] [EDP Sciences] [Google Scholar]
- Haario, H., Saksman, E., & Tamminen, J. 2001, Bernoulli, 7, 223 [CrossRef] [Google Scholar]
- Haario, H., Laine, M., Mira, A., & Saksman, E. 2006, Stat. Comput., 16, 339 [Google Scholar]
- Hamuy, M., Phillips, M. M., Maza, J., et al. 1994, AJ, 108, 2226 [Google Scholar]
- Hamuy, M., Phillips, M. M., Maza, J., et al. 1995, AJ, 109, 1 [NASA ADS] [CrossRef] [Google Scholar]
- Hamuy, M., Phillips, M. M., Suntzeff, N. B., et al. 1996a, AJ, 112, 2391 [Google Scholar]
- Hamuy, M., Phillips, M. M., Suntzeff, N. B., et al. 1996b, AJ, 112, 2408 [Google Scholar]
- Hamuy, M., Phillips, M. M., Suntzeff, N. B., et al. 2003, Nature, 424, 651 [NASA ADS] [CrossRef] [Google Scholar]
- Hicken, M., Garnavich, P. M., Prieto, J. L., et al. 2007, ApJ, 669, L17 [NASA ADS] [CrossRef] [Google Scholar]
- Hicken, M., Challis, P., Jha, S., et al. 2009, ApJ, 700, 331 [Google Scholar]
- Hoeflich, P. 1990, A&A, 229, 191 [Google Scholar]
- Hoeflich, P., & Khokhlov, A. 1996, ApJ, 457, 500 [CrossRef] [Google Scholar]
- Hoeflich, P., Mueller, E., & Khokhlov, A. 1993, A&A, 268, 570 [Google Scholar]
- Hoeflich, P., Khokhlov, A. M., & Wheeler, J. C. 1995, ApJ, 444, 831 [CrossRef] [Google Scholar]
- Hoeflich, P., Hsiao, E. Y., Ashall, C., et al. 2017, ApJ, 846, 58 [Google Scholar]
- Hoeflich, P., Ashall, C., Bose, S., et al. 2021, ApJ, 922, 186 [NASA ADS] [CrossRef] [Google Scholar]
- Höflich, P. 2003, in Stellar Atmosphere Modeling, eds. I. Hubeny, D. Mihalas, & K. Werner, ASP Conf. Ser., 288, 371 [Google Scholar]
- Höflich, P. 2009, in Recent Directions in Astrophysical Quantitative Spectroscopy and Radiation Hydrodynamics, eds. I. Hubeny, J. M. Stone, K. MacGregor, & K. Werner (AIP), AIP Conf. Ser., 1171, 161 [Google Scholar]
- Höflich, P., Gerardy, C. L., Fesen, R. A., & Sakai, S. 2002, ApJ, 568, 791 [NASA ADS] [CrossRef] [Google Scholar]
- Holmbo, S., Stritzinger, M., Nowack, G., et al. 2019, ATel, 12661, 1 [NASA ADS] [Google Scholar]
- Holoien, T. W.-S., Brown, J. S., Stanek, K. Z., et al. 2017, MNRAS, 471, 4966 [NASA ADS] [CrossRef] [Google Scholar]
- Hoogendam, W. B., Shappee, B. J., Brown, P. J., et al. 2024, ApJ, 966, 139 [NASA ADS] [CrossRef] [Google Scholar]
- Hosseinzadeh, G., Sand, D. J., Valenti, S., et al. 2017, ApJ, 845, L11 [NASA ADS] [CrossRef] [Google Scholar]
- Howell, D. A., Sullivan, M., Nugent, P. E., et al. 2006, Nature, 443, 308 [Google Scholar]
- Hsiao, E. Y., Burns, C. R., Contreras, C., et al. 2015, A&A, 578, A9 [NASA ADS] [CrossRef] [EDP Sciences] [Google Scholar]
- Hsiao, E. Y., Hoeflich, P., Ashall, C., et al. 2020, ApJ, 900, 140 [NASA ADS] [CrossRef] [Google Scholar]
- Hubble, E. P. 1926, ApJ, 64, 321 [Google Scholar]
- Iben, I. Jr., & Tutukov, A. V. 1984, ApJS, 54, 335 [NASA ADS] [CrossRef] [Google Scholar]
- Jacobson-Galán, W. V., Polin, A., Foley, R. J., et al. 2020, ApJ, 896, 165 [Google Scholar]
- Jerkstrand, A., Smartt, S. J., Fraser, M., et al. 2014, MNRAS, 439, 3694 [Google Scholar]
- Jha, S., Kirshner, R. P., Challis, P., et al. 2006, AJ, 131, 527 [Google Scholar]
- Jha, S., Riess, A. G., & Kirshner, R. P. 2007, ApJ, 659, 122 [NASA ADS] [CrossRef] [Google Scholar]
- Jha, S. W., Maguire, K., & Sullivan, M. 2019, Nat. Astron., 3, 706 [NASA ADS] [CrossRef] [Google Scholar]
- Jiang, J.-A., Doi, M., Maeda, K., et al. 2017, Nature, 550, 80 [CrossRef] [Google Scholar]
- Kasen, D. 2010, ApJ, 708, 1025 [Google Scholar]
- Kasen, D., Thomas, R. C., & Nugent, P. 2006, ApJ, 651, 366 [NASA ADS] [CrossRef] [Google Scholar]
- Katz, B., Kushnir, D., & Dong, S. 2013, ArXiv e-prints [arXiv:1301.6766] [Google Scholar]
- Kennicutt, R. C., Jr. 1998, ApJ, 498, 541 [Google Scholar]
- Khokhlov, A. 2001, APS Meet. Abstr., 46, C3.003 [Google Scholar]
- Kochanek, C. S., Shappee, B. J., Stanek, K. Z., et al. 2017, PASP, 129, 104502 [Google Scholar]
- Kourkchi, E., Tully, R. B., Eftekharzadeh, S., et al. 2020a, ApJ, 902, 145 [NASA ADS] [CrossRef] [Google Scholar]
- Kourkchi, E., Courtois, H. M., Graziani, R., et al. 2020b, AJ, 159, 67 [NASA ADS] [CrossRef] [Google Scholar]
- Krisciunas, K., Marion, G. H., Suntzeff, N. B., et al. 2009, AJ, 138, 1584 [Google Scholar]
- Krisciunas, K., Contreras, C., Burns, C. R., et al. 2017, AJ, 154, 211 [NASA ADS] [CrossRef] [Google Scholar]
- Kromer, M., Fremling, C., Pakmor, R., et al. 2016, MNRAS, 459, 4428 [NASA ADS] [CrossRef] [Google Scholar]
- Kumar, S., Hsiao, E. Y., Ashall, C., et al. 2023, ApJ, 945, 27 [Google Scholar]
- Kwok, L. A., Siebert, M. R., Johansson, J., et al. 2024, ApJ, 966, 135 [NASA ADS] [CrossRef] [Google Scholar]
- Lair, J. C., Leising, M. D., Milne, P. A., & Williams, G. G. 2006, AJ, 132, 2024 [NASA ADS] [CrossRef] [Google Scholar]
- Leibundgut, B., Kirshner, R. P., Phillips, M. M., et al. 1993, AJ, 105, 301 [NASA ADS] [CrossRef] [Google Scholar]
- Leitherer, C., Schaerer, D., Goldader, J. D., et al. 1999, ApJS, 123, 3 [Google Scholar]
- Leloudas, G., Stritzinger, M. D., Sollerman, J., et al. 2009, A&A, 505, 265 [NASA ADS] [CrossRef] [EDP Sciences] [Google Scholar]
- Levanon, N., & Soker, N. 2017, MNRAS, 470, 2510 [Google Scholar]
- Li, H., & McCray, R. 1992, ApJ, 387, 309 [CrossRef] [Google Scholar]
- Li, W., Filippenko, A. V., Gates, E., et al. 2001, PASP, 113, 1178 [Google Scholar]
- Li, W., Filippenko, A. V., Chornock, R., et al. 2003, PASP, 115, 453 [Google Scholar]
- Li, Z., Zhang, T., Wang, X., et al. 2023, ApJ, 950, 17 [Google Scholar]
- Liu, Z.-W., Pakmor, R., Seitenzahl, I. R., et al. 2013, ApJ, 774, 37 [NASA ADS] [CrossRef] [Google Scholar]
- Liu, Z.-W., Röpke, F. K., & Han, Z. 2023, Res. Astron. Astrophys., 23, 082001 [CrossRef] [Google Scholar]
- Livne, E., & Arnett, D. 1995, ApJ, 452, 62 [Google Scholar]
- Lundqvist, P., Nyholm, A., Taddia, F., et al. 2015, A&A, 577, A39 [NASA ADS] [CrossRef] [EDP Sciences] [Google Scholar]
- Lundqvist, P., Kundu, E., Pérez-Torres, M. A., et al. 2020, ApJ, 890, 159 [Google Scholar]
- Maeda, K., Kutsuna, M., & Shigeyama, T. 2014, ApJ, 794, 37 [Google Scholar]
- Maeda, K., Jiang, J.-A., Doi, M., Kawabata, M., & Shigeyama, T. 2023, MNRAS, 521, 1897 [NASA ADS] [CrossRef] [Google Scholar]
- Magee, M. R., Sim, S. A., Kotak, R., & Kerzendorf, W. E. 2018, A&A, 614, A115 [NASA ADS] [CrossRef] [EDP Sciences] [Google Scholar]
- Maguire, K., Sullivan, M., Thomas, R. C., et al. 2011, MNRAS, 418, 747 [Google Scholar]
- Mandel, K. S., Narayan, G., & Kirshner, R. P. 2011, ApJ, 731, 120 [CrossRef] [Google Scholar]
- Mandel, K. S., Scolnic, D. M., Shariff, H., Foley, R. J., & Kirshner, R. P. 2017, ApJ, 842, 93 [NASA ADS] [CrossRef] [Google Scholar]
- Maoz, D., Mannucci, F., & Nelemans, G. 2014, ARA&A, 52, 107 [Google Scholar]
- Matheson, T., Kirshner, R. P., Challis, P., et al. 2008, AJ, 135, 1598 [CrossRef] [Google Scholar]
- Mazzali, P. A., Danziger, I. J., & Turatto, M. 1995, A&A, 297, 509 [NASA ADS] [Google Scholar]
- Mazzali, P. A., Chugai, N., Turatto, M., et al. 1997, MNRAS, 284, 151 [NASA ADS] [Google Scholar]
- Mazzali, P. A., Benetti, S., Stritzinger, M., & Ashall, C. 2022, MNRAS, 511, 5560 [Google Scholar]
- McCully, C., Jha, S. W., Foley, R. J., et al. 2014, ApJ, 786, 134 [NASA ADS] [CrossRef] [Google Scholar]
- Miller, A. A., Magee, M. R., Polin, A., et al. 2020, ApJ, 898, 56 [NASA ADS] [CrossRef] [Google Scholar]
- Moriya, T. J., Mazzali, P. A., Ashall, C., & Pian, E. 2023, MNRAS, 522, 6035 [Google Scholar]
- Morrell, N., Phillips, M. M., Folatelli, G., et al. 2024, ApJ, 967, 20 [Google Scholar]
- Munari, U., Henden, A., Belligoli, R., et al. 2013, New Astron., 20, 30 [Google Scholar]
- Nomoto, K. 1982, ApJ, 257, 780 [Google Scholar]
- Nugent, P., Phillips, M., Baron, E., Branch, D., & Hauschildt, P. 1995, ApJ, 455, L147 [NASA ADS] [CrossRef] [Google Scholar]
- Nugent, P., Kim, A., & Perlmutter, S. 2002, PASP, 114, 803 [NASA ADS] [CrossRef] [Google Scholar]
- Pakmor, R., Kromer, M., Röpke, F. K., et al. 2010, Nature, 463, 61 [Google Scholar]
- Pakmor, R., Kromer, M., Taubenberger, S., et al. 2012, ApJ, 747, L10 [NASA ADS] [CrossRef] [Google Scholar]
- Parrent, J. T., Thomas, R. C., Fesen, R. A., et al. 2011, ApJ, 732, 30 [Google Scholar]
- Patat, F., Cordiner, M. A., Cox, N. L. J., et al. 2013, A&A, 549, A62 [NASA ADS] [CrossRef] [EDP Sciences] [Google Scholar]
- Pereira, R., Thomas, R. C., Aldering, G., et al. 2013, A&A, 554, A27 [NASA ADS] [CrossRef] [EDP Sciences] [Google Scholar]
- Perlmutter, S., Aldering, G., Goldhaber, G., et al. 1999, ApJ, 517, 565 [Google Scholar]
- Pettini, M., & Pagel, B. E. J. 2004, MNRAS, 348, L59 [NASA ADS] [CrossRef] [Google Scholar]
- Phillips, M. M. 1993, ApJ, 413, L105 [Google Scholar]
- Phillips, M. M., Phillips, A. C., Heathcote, S. R., et al. 1987, PASP, 99, 592 [NASA ADS] [CrossRef] [Google Scholar]
- Phillips, M. M., Wells, L. A., Suntzeff, N. B., et al. 1992, AJ, 103, 1632 [NASA ADS] [CrossRef] [Google Scholar]
- Phillips, M. M., Lira, P., Suntzeff, N. B., et al. 1999, AJ, 118, 1766 [Google Scholar]
- Phillips, M. M., Simon, J. D., Morrell, N., et al. 2013, ApJ, 779, 38 [NASA ADS] [CrossRef] [Google Scholar]
- Phillips, M. M., Contreras, C., Hsiao, E. Y., et al. 2019, PASP, 131, 014001 [Google Scholar]
- Phillips, M. M., Ashall, C., Burns, C. R., et al. 2022, ApJ, 938, 47 [NASA ADS] [CrossRef] [Google Scholar]
- Phillips, M. M., Ashall, C., Brown, P. J., et al. 2024, ApJS, 273, 16 [NASA ADS] [CrossRef] [Google Scholar]
- Piro, A. L., & Morozova, V. S. 2016, ApJ, 826, 96 [NASA ADS] [CrossRef] [Google Scholar]
- Pogge, R. W., Atwood, B., Brewer, D. F., et al. 2010, in Ground-based and Airborne Instrumentation for Astronomy III, eds. I. S. McLean, S. K. Ramsay, & H. Takami, SPIE Conf. Ser., 7735, 77350A [NASA ADS] [Google Scholar]
- Poznanski, D., Prochaska, J. X., & Bloom, J. S. 2012, MNRAS, 426, 1465 [Google Scholar]
- Pskovskii, I. P. 1977, Soviet Astron., 21, 675 [Google Scholar]
- Richmond, M. W., & Smith, H. A. 2012, JAAVSO, 40, 872 [Google Scholar]
- Riess, A. G., Filippenko, A. V., Challis, P., et al. 1998, AJ, 116, 1009 [Google Scholar]
- Riess, A. G., Kirshner, R. P., Schmidt, B. P., et al. 1999, AJ, 117, 707 [Google Scholar]
- Riess, A. G., Macri, L. M., Hoffmann, S. L., et al. 2016, ApJ, 826, 56 [Google Scholar]
- Riess, A. G., Casertano, S., Yuan, W., et al. 2021, ApJ, 908, L6 [NASA ADS] [CrossRef] [Google Scholar]
- Rodríguez, Ó., Maoz, D., & Nakar, E. 2023, ApJ, 955, 71 [CrossRef] [Google Scholar]
- Russell, S. C., & Dopita, M. A. 1992, ApJ, 384, 508 [NASA ADS] [CrossRef] [Google Scholar]
- Sahu, D. K., Tanaka, M., Anupama, G. C., et al. 2008, ApJ, 680, 580 [NASA ADS] [CrossRef] [Google Scholar]
- Sako, M., Bassett, B., Becker, A. C., et al. 2018, PASP, 130, 064002 [NASA ADS] [CrossRef] [Google Scholar]
- Scalzo, R. A., Aldering, G., Antilogus, P., et al. 2010, ApJ, 713, 1073 [NASA ADS] [CrossRef] [Google Scholar]
- Scalzo, R. A., Parent, E., Burns, C., et al. 2019, MNRAS, 483, 628 [Google Scholar]
- Schlafly, E. F., & Finkbeiner, D. P. 2011, ApJ, 737, 103 [Google Scholar]
- Schmidt, B. P., Suntzeff, N. B., Phillips, M. M., et al. 1998, ApJ, 507, 46 [NASA ADS] [CrossRef] [Google Scholar]
- Scolnic, D. M., Jones, D. O., Rest, A., et al. 2018, ApJ, 859, 101 [NASA ADS] [CrossRef] [Google Scholar]
- SDSS Collaboration. 2017, ApJS, 233, 25 [NASA ADS] [CrossRef] [Google Scholar]
- Shappee, B. J., Prieto, J. L., Grupe, D., et al. 2014, ApJ, 788, 48 [Google Scholar]
- Sharon, A., & Kushnir, D. 2020, MNRAS, 496, 4517 [CrossRef] [Google Scholar]
- Shaya, E. J., Tully, R. B., Hoffman, Y., & Pomarède, D. 2017, ApJ, 850, 207 [NASA ADS] [CrossRef] [Google Scholar]
- Shen, K. J., Kasen, D., Miles, B. J., & Townsley, D. M. 2018, ApJ, 854, 52 [Google Scholar]
- Siebert, M. R., Foley, R. J., Zenati, Y., et al. 2023, ApJ, 958, 173 [NASA ADS] [CrossRef] [Google Scholar]
- Silverman, J. M., Foley, R. J., Filippenko, A. V., et al. 2012, MNRAS, 425, 1789 [Google Scholar]
- Srivastav, S., Moore, T., Nicholl, M., et al. 2023, ApJ, 956, L34 [Google Scholar]
- Stritzinger, M., & Ashall, C. 2020, TNS Classif. Rep., 2020, 1 [Google Scholar]
- Stritzinger, M., & Sollerman, J. 2007, A&A, 470, L1 [NASA ADS] [CrossRef] [EDP Sciences] [Google Scholar]
- Stritzinger, M., Hamuy, M., Suntzeff, N. B., et al. 2002, AJ, 124, 2100 [NASA ADS] [CrossRef] [Google Scholar]
- Stritzinger, M., Burns, C. R., Phillips, M. M., et al. 2010, AJ, 140, 2036 [Google Scholar]
- Stritzinger, M. D., Phillips, M. M., Boldt, L. N., et al. 2011, AJ, 142, 156 [Google Scholar]
- Stritzinger, M. D., Hsiao, E., Valenti, S., et al. 2014, A&A, 561, A146 [NASA ADS] [CrossRef] [EDP Sciences] [Google Scholar]
- Stritzinger, M. D., Valenti, S., Hoeflich, P., et al. 2015, A&A, 573, A2 [NASA ADS] [CrossRef] [EDP Sciences] [Google Scholar]
- Stritzinger, M. D., Taddia, F., Burns, C. R., et al. 2018, A&A, 609, A135 [NASA ADS] [CrossRef] [EDP Sciences] [Google Scholar]
- Taubenberger, S. 2017, in Handbook of Supernovae, eds. A. W. Alsabti, & P. Murdin, 317 [CrossRef] [Google Scholar]
- Taubenberger, S., Kromer, M., Pakmor, R., et al. 2013, ApJ, 775, L43 [Google Scholar]
- Taubenberger, S., Floers, A., Vogl, C., et al. 2019, MNRAS, 488, 5473 [NASA ADS] [Google Scholar]
- Thomas, R. C., Aldering, G., Antilogus, P., et al. 2011, ApJ, 743, 27 [Google Scholar]
- Tiwari, S., Chakradhari, N. K., Sahu, D. K., et al. 2023, MNRAS, 521, 5207 [Google Scholar]
- Tonry, J. L., Stubbs, C. W., Lykke, K. R., et al. 2012, ApJ, 750, 99 [Google Scholar]
- Tripp, R. 1998, A&A, 331, 815 [NASA ADS] [Google Scholar]
- Tucker, M. A., Ashall, C., Shappee, B. J., et al. 2021, ApJ, 914, 50 [NASA ADS] [CrossRef] [Google Scholar]
- Tucker, M. A., Shappee, B. J., Huber, M. E., et al. 2022a, PASP, 134, 124502 [NASA ADS] [CrossRef] [Google Scholar]
- Tucker, M. A., Ashall, C., Shappee, B. J., et al. 2022b, ApJ, 926, L25 [NASA ADS] [CrossRef] [Google Scholar]
- Turatto, M., Benetti, S., Cappellaro, E., et al. 1996, MNRAS, 283, 1 [NASA ADS] [CrossRef] [Google Scholar]
- Wang, X., Filippenko, A. V., Ganeshalingam, M., et al. 2009, ApJ, 699, L139 [NASA ADS] [CrossRef] [Google Scholar]
- Webbink, R. F. 1984, ApJ, 277, 355 [NASA ADS] [CrossRef] [Google Scholar]
- White, C. J., Kasliwal, M. M., Nugent, P. E., et al. 2015, ApJ, 799, 52 [NASA ADS] [CrossRef] [Google Scholar]
- Wilk, K. D., Hillier, D. J., & Dessart, L. 2020, MNRAS, 494, 2221 [NASA ADS] [CrossRef] [Google Scholar]
- Woosley, S. E., & Weaver, T. A. 1994, ApJ, 423, 371 [Google Scholar]
- Wygoda, N., Elbaz, Y., & Katz, B. 2019, MNRAS, 484, 3951 [NASA ADS] [CrossRef] [Google Scholar]
- Xi, G., Wang, X., Li, G., et al. 2024, MNRAS, 527, 9957 [Google Scholar]
- Yamanaka, M., Kawabata, K. S., Kinugasa, K., et al. 2009, ApJ, 707, L118 [NASA ADS] [CrossRef] [Google Scholar]
- Yaron, O., & Gal-Yam, A. 2012, PASP, 124, 668 [Google Scholar]
- Zhang, K., Wang, X., Zhang, J., et al. 2016, ApJ, 820, 67 [NASA ADS] [CrossRef] [Google Scholar]
- Zhao, X., Maeda, K., Wang, X., et al. 2016, ApJ, 826, 211 [NASA ADS] [CrossRef] [Google Scholar]
- Zheng, W., Kelly, P. L., & Filippenko, A. V. 2018, ApJ, 858, 104 [Google Scholar]
Appendix A: Optical broadband photometry of ASASSN-20jq
Table A.1 lists the optical broadband photometry of ASASSN-20jq.
Photometry of ASASSN-20jq
Supplementary material of the nebular model
Plotted in Fig. B.1 is the distribution of elements synthesized by the reference model 5p02822d40.16. The left panel displays the angle-averaged composition of the model, while the right panel shows the abundance distribution incorporating macroscopic mixing at 2000 km s−1. This mixing enhances the overlap of the 56Ni distribution with Ca and, to a lesser extent, with other intermediate-mass elements.
 |
Fig. B.1. Angle-averaged composition of the multidimensional reference model 5p02822d40.16 with macroscopic mixing up to 2000 km s−1 (right) and without (left). |
Table B.1 highlights the most significant contributors to the optical synthetic spectrum. It is important to note, however, that these features are heavily influenced by numerous blends.
List of Relevant Optical Forbidden Lines from the Mixed Model.
All Tables
All Figures
|
Fig. 1. Composite Bgr-band (11′×11′) image of ASASSN-20jq (green marker) located within NGC 5002 and observed from the Post observatory 15 days prior to B-band maximum. |
| In the text | |
|
Fig. 2. Optical BgVriz-band light curves of ASASSN-20jq along with “max_model” template light curve fits (black dashed lines) computed by SNooPy (Burns et al. 2011). The indicated offsets have been added to the light curves for clarity. Epochs of spectral observations are marked by vertical bars at the bottom, the epoch of the B-band maximum is indicated with a black vertical line, and the explosion epoch is marked by a blue vertical dashed line. |
| In the text | |
|
Fig. 3. Optical spectroscopic time-series of ASASSN-20jq. Positions for telluric oxygen absorption are marked by ⊕ symbol and light-grey bands. The vertical dashed lines are at rest-wavelengths for corresponding lines as labeled. Thick dashed lines represent Fe multiplets. An archival SDSS host galaxy spectrum, centered 3 |
| In the text | |
|
Fig. 4. Top panel: Early-time r-band light curve of ASASSN-20jq. This also includes the first photometric detection of ASASSN-20jq made by PS in the z band, which has been S-corrected to the SDSS r-band system. Also plotted is the ATLAS o-band nondetection limit reported previously. Overplotted the r-band light curve is the best MCMC-fit of a single power-law function (solid curve) with inferred probability limits (shaded region). Bottom panel: 2D probability density of MCMC sample between the fit parameters – time of first light tfirst and power-law index α. Having a confirmed detection at −19 days (vertical blue dashed line), only the region in green is valid parameter space. The contours correspond to 68% and 95% confidence intervals. The solid black lines indicate the mean of the MCMC sample for parameters tfirst = −20.4 days (vertical) and α = 1.99 (horizontal). |
| In the text | |
|
Fig. 5. Subtyping of SNe Ia based on light curve properties as per Ashall et al. (2021). Specifically, the color-stretch parameter sBV, is plotted vs. |
| In the text | |
|
Fig. 6. Apparent (B − V) and intrinsic (B − V)0 color evolution of ASASSN-20jq. The intrinsic color evolution of the normal SN 2011fe (Richmond & Smith 2012), the low-luminosity SN 1991bg (Turatto et al. 1996), and the Lira relation for different sBV values (Burns et al. 2014) are also plotted. To construct the color-curve of ASASSN-20jq, the B- and V-band light curves were interpolated with low-order splines which were then evaluated at the same epochs. The vertical dashed line marks the lower limit of the time of B−V maximum of ASASSN-20jq as the data only captures the rising part of the color curve. The vertical bars at the top of the figure indicate the range of sBV values for the SNe Ia-normal, 1991bg-like, and 2002es-like samples populating the luminosity versus sBV diagram presented in Fig. 8. |
| In the text | |
|
Fig. 7. Na I D lines at the rest wavelength of the host galaxy. The −2.4 days spectrum is normalized by the local continuum. The D1 and D2 lines are unresolved in this low-resolution spectrum. The estimated EW for the Na I D profile is 0.69 ± 0.04 Å and the corresponding E(B − V)host is 0.091 ± 0.020 mag. |
| In the text | |
|
Fig. 8. Absolute magnitude vs. light curve shape diagrams populated with the Carnegie Supernova Project SN Ia sample (Contreras et al. 2010; Stritzinger et al. 2011; Krisciunas et al. 2017; Ashall et al. 2021; Phillips et al. 2022), along with members of known SN-Ia subtypes, a handful of 2002es-like objects, and ASASSN-20jq. References for the expanded comparison sample are provided in Sect. 4.6. The left panel relates the peak absolute B-band magnitude (MB) to the light curve shape parameter Δm15(B) (Phillips 1993), while MB is plotted in the right panel vs. the color-stretch parameter, sBV (Burns et al. 2014). |
| In the text | |
|
Fig. 9. Absolute B-band magnitude light curves of ASASSN-20jq compared with the normal SN 2011fe, the subluminous SN 1991bg, as well as the peculiar SNe 2002es and 2016hnk. The adopted distance, ABtot extinction, and references of the comparison sample are as follows: SN 2011fe – 6.79 Mpc, 0.93 mag (Richmond & Smith 2012; Patat et al. 2013), SN 1991bg – 17.0 Mpc, 0.0 mag (Leibundgut et al. 1993), SN 2016hnk – 68.35 Mpc, 1.48 mag, (Galbany et al. 2019), and SN 2002es – 73.2 Mpc, 0.00 mag (Ganeshalingam et al. 2012). |
| In the text | |
|
Fig. 10. Modeling the UVOIR bolometric light curve with a radioactive 56Ni decay model (solid lines). The UVOIR light curve of ASASSN-20jq (top panel), its time-weighted integrated luminosity (middle panel), and the ratio t2L/(∫Ltdt) (bottom panel) which is defined independent of the 56Ni mass are shown. Phase is in days since the adopted time of first light, which is 20.4 days before the epoch of the B-band maximum (see Sect. 4.2). |
| In the text | |
|
Fig. 11. Photospheric spectra of ASASSN-20jq compared with similar epoch spectra of other SN Ia types with key spectral features marked and labeled. The comparison sample includes subluminous SNe 1991bg, 1999by, and 2016hnk, the normal SN 2011fe, the overluminous SN 1991T, the Type Iax SN 2008A, and SN 2002es, along with several commonly referenced objects in our overall comparison, namely SNe 2006bt, 2010lp, and 2019yvq. See text for references. |
| In the text | |
|
Fig. 12. Branch diagram comparing the pEW values of the Si IIλ5972 and λ6355 spectral features measured at maximum light. The diagram is populated by the Carnegie Supernova Project sample of SNe Ia (Folatelli et al. 2013; Morrell et al. 2024). Our measurements from two near-maximum light spectra of ASASSN-20jq are plotted in purple, as well as those inferred of nearly a dozen peculiar SNe Ia with commonalities with SN 2002es (see text). In addition, we plot the sample of 2003fg-like objects (Ashall et al. 2021). The Branch diagram subtypes labeled are CN: core normal, BL: broad line, CL: cool, and SS: shallow silicon. |
| In the text | |
|
Fig. 13. Wang et al. (2009) diagrams comparing the Si IIλλ5972, 6355 pEW and Doppler velocity (v(Si II)abs) measurements from near maximum spectra of the Carnegie Supernova Project sample (Morrell et al. 2024; Ashall et al. 2021). Measurements made from the two nearest to maximum light spectra of ASASSN-20jq are plotted as purple points, as well as those inferred from nearly a dozen peculiar SNe Ia with commonalities with SN 2002es. Branch types are same as in Fig. 12. The vertical line separates normal and high-velocity SNe Ia as defined by Wang et al. (2009). |
| In the text | |
|
Fig. 14. Nebular spectra comparison. Spectra of ASASSN-20jq obtained at +229 days and +337 days compared with nebular spectra of SN 1991T (Gómez & López 1998), SN 2011fe (Zhang et al. 2016), the low-luminosity SN 1991bg (Turatto et al. 1996), the SN Iax 2008A (McCully et al. 2014), the peculiar SN 2016hnk (Galbany et al. 2019), as well as the 2002es-like SN 2010lp (Taubenberger et al. 2013), and SN 2019yvq (Tucker et al. 2021). Prominent spectral features are labeled with associated ion following Wilk et al. (2020). |
| In the text | |
|
Fig. 15. Post-maximum (+85 to +337 days) spectra of ASASSN-20jq plotted in velocity domain with respect to the rest wavelengths, as indicated on top of figure panels, of [Co III] (left), [O I] (middle) and [Ca II] (right) lines. The pair of the black dashed lines in the middle panel represents the rest-positions of the [O I] doublet components. The pair of red-dashed lines represent the position of the [O I] doublet redshifted by 2200 km s−1 to best match the observed feature beyond +229 d. The [Ca II] doublet in right panel shows a systematic redshift of ≈1700 km s−1 throughout the evolution. |
| In the text | |
|
Fig. 16. Top panel: [O I] λλ6300, 6364 doublet region for the last three nebular spectra of ASASSN-20jq are plotted in velocity domain with respect to 6300 Å. The pair of black dashed lines represent the rest position of the [O I] doublet lines λλ6300, 6364, while the dashed red lines represent the [O I] doublet redshifted by ≈2200 km s−1. Bottom panel: Pseudo-continuum subtracted [O I] λλ6300, 6364 doublet region of the +229 d spectrum. A two-component Gaussian profile is fitted with FWHM constrained to be the same. The flux ratio of the doublet components L6300/L6364 is estimated to be ≈1.67 and the FWHM for each component is ≈1900 km s−1. |
| In the text | |
|
Fig. 17. Comparison of optical [Fe II] λ7155 and NIR [Fe II] λ16 433 nebular emission lines plotted in velocity scale. Both lines have identical profiles, being highly asymmetric with a tilted top and peaks redshifted by ≈1400 km s−1. |
| In the text | |
|
Fig. 18. 1D spectrum extracted (black line) from an SDSS-II spectral observations of NGC 5002, obtained from a position in proximity to ASASSN-20jq and with prominent nebular emission features from the host marked and labeled. The underlying stellar population is modeled using STARLIGHT (red line) and subtracted from the observed spectrum. The resulting gas-phase spectrum is shown in blue. The most prominent [O III] λ5007 is saturated and therefore masked by a yellow band. A single Gaussian function was fit to the nebular lines plotted within the insets. Flux ratios of these lines combined with the calibrations of Pettini & Pagel (2004) and Dopita et al. (2016) indicate a sub-solar gas-phase metallicity. |
| In the text | |
|
Fig. 19. Schematic outlining the Hoeflich et al. (2021) off-center DDT explosion model of a MCh-mass C + O WD. Initially, centrally located C + O burning initiates a deflagration flame front, which due to the high central density of the WD, produces an inner, spherical region of electron capture (EC) elements (depicted by filled cyan circle) consisting mostly of stable Fe-group elements. The EC region lays within a spherical shell of remaining deflagration ash consisting mainly of radioactive 56Ni (green ring). After consuming 0.3 M⊙ of the WD and the leading edge of the deflagration flame front reaches ρtr, a ∼2000 km s−1 off-center DDT is triggered (black point). As the DDT occurs on a moving background, the detonation burning front requires time to reach and fully consume the remaining C + O ejecta. As a result, the detonation burning products are distributed asymmetrically, and as depicted in the schematic by the intensity of yellow which reflects the abundance mass fraction of 56Ni, the majority of the 56Ni produced during the detonation burning phase is distributed in a banana shape region with a ring surrounding the deflagration burning ash and along a positive viewing angle relative to the equator. Depending on the viewing angle, nebular emission lines will appear blue- or red-shifted. |
| In the text | |
|
Fig. 20. Spectral synthesis model of the optical and NIR nebular spectrum. The optical spectrum was obtained on +229 days and the NIR spectrum on +192 days (Hoeflich et al. 2021). Over-plotted in blue is the synthetic spectrum computed from a MCh C + O WD disrupted following an off-centered delayed detonation explosion. This model is computed with a viewing angle of −90° as defined by the schematic in Fig. 19. At the blue end of the optical spectrum the model underestimates the flux of several Fe II+ Fe III complexes. After recomputing the explosion model with the addition of a 2000 km s−1 macroscopic mixing scale of the 56Ni-Fe into the lower density Ca-layer (see Fig. B.1), we obtain the synthetic spectrum shown in red. The mixing model better reproduces the [Fe II], [Fe III], [Co II], and [Co III] line complexes between ∼4000 − 6000 Å and ∼8500 − 9000 Å. The observed spectra have been scaled arbitrarily to match the model results. |
| In the text | |
|
Fig. B.1. Angle-averaged composition of the multidimensional reference model 5p02822d40.16 with macroscopic mixing up to 2000 km s−1 (right) and without (left). |
| In the text | |
Current usage metrics show cumulative count of Article Views (full-text article views including HTML views, PDF and ePub downloads, according to the available data) and Abstracts Views on Vision4Press platform.
Data correspond to usage on the plateform after 2015. The current usage metrics is available 48-96 hours after online publication and is updated daily on week days.
Initial download of the metrics may take a while.