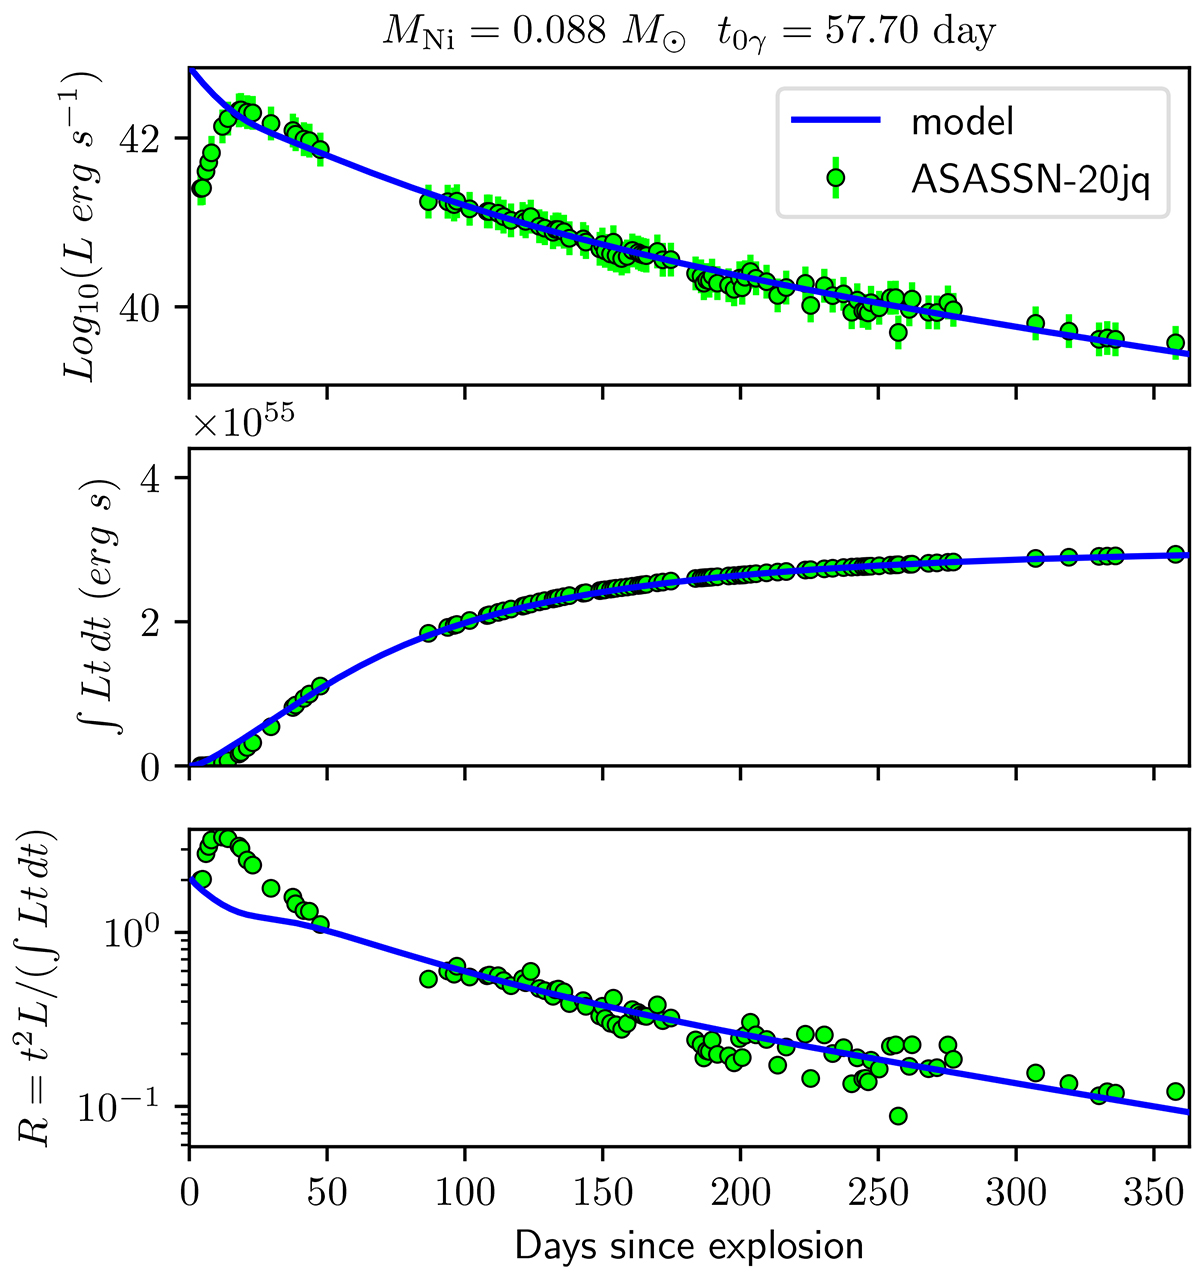
Fig. 10.
Download original image
Modeling the UVOIR bolometric light curve with a radioactive 56Ni decay model (solid lines). The UVOIR light curve of ASASSN-20jq (top panel), its time-weighted integrated luminosity (middle panel), and the ratio t2L/(∫Ltdt) (bottom panel) which is defined independent of the 56Ni mass are shown. Phase is in days since the adopted time of first light, which is 20.4 days before the epoch of the B-band maximum (see Sect. 4.2).
Current usage metrics show cumulative count of Article Views (full-text article views including HTML views, PDF and ePub downloads, according to the available data) and Abstracts Views on Vision4Press platform.
Data correspond to usage on the plateform after 2015. The current usage metrics is available 48-96 hours after online publication and is updated daily on week days.
Initial download of the metrics may take a while.