| Issue |
A&A
Volume 694, February 2025
ZTF SN Ia DR2
|
|
|---|---|---|
| Article Number | A9 | |
| Number of page(s) | 16 | |
| Section | Extragalactic astronomy | |
| DOI | https://doi.org/10.1051/0004-6361/202450386 | |
| Published online | 14 February 2025 | |
ZTF SN Ia DR2: The spectral diversity of Type Ia supernovae in a volume-limited sample
1
School of Physics, Trinity College Dublin, College Green, Dublin 2, Ireland
2
Oskar Klein Centre, Department of Astronomy, Stockholm University, SE-10691 Stockholm, Sweden
3
Institut für Physik, Humboldt-Universität zu Berlin, Newtonstr. 15, 12489 Berlin, Germany
4
Institute of Space Sciences (ICE, CSIC), Campus UAB, Carrer de Can Magrans, s/n, E-08193 Barcelona, Spain
5
Institut d’Estudis Espacials de Catalunya (IEEC), E-08034 Barcelona, Spain
6
Univ Lyon, Univ Claude Bernard Lyon 1, CNRS, IP2I Lyon/IN2P3, UMR 5822, F-69622 Villeurbanne, France
7
Department of Physics, Lancaster University, Lancs LA1 4YB, UK
8
Oskar Klein Centre, Department of Physics, Stockholm University, SE-10691 Stockholm, Sweden
9
Université Clermont Auvergne, CNRS/IN2P3, LPCA, F-63000 Clermont-Ferrand, France
10
National Research Council of Canada, Herzberg Astronomy & Astrophysics Research Centre, 5071 West Saanich Road, Victoria, BC V9E 2E7, Canada
11
Institute of Astronomy and Kavli Institute for Cosmology, University of Cambridge, Madingley Road, Cambridge CB3 0HA, UK
12
Department of Physics and Astronomy, Northwestern University, 2145 Sheridan Rd, Evanston, IL 60208, USA
13
Center for Interdisciplinary Exploration and Research in Astrophysics (CIERA), Northwestern University, 1800 Sherman Ave, Evanston, IL 60201, USA
14
Lawrence Berkeley National Laboratory, 1 Cyclotron Road, MS 50B-4206, Berkeley, CA 94720, USA
15
Department of Astronomy, University of California, Berkeley, 501 Campbell Hall, Berkeley, CA 94720, USA
16
Nordic Optical Telescope, Rambla José Ana Fernández Pérez 7, ES-38711 Breña Baja, Spain
17
Caltech Optical Observatories, California Institute of Technology, Pasadena, CA 91125, USA
18
Cahill Center for Astrophysics, California Institute of Technology, MC 249-17, 1200 E California Boulevard, Pasadena, CA 91125, USA
19
Division of Physics, Mathematics and Astronomy, California Institute of Technology, Pasadena, CA 91125, USA
20
IPAC, California Institute of Technology, 1200 E. California Boulevard, Pasadena CA 91125, USA
⋆ Corresponding author; This email address is being protected from spambots. You need JavaScript enabled to view it.
Received:
15
April
2024
Accepted:
10
October
2024
Abstract
More than 3000 spectroscopically confirmed Type Ia supernovae (SNe Ia) are presented in the second data release (DR2) of the Zwicky Transient Facility survey. In this paper we detail the spectral properties of 482 SNe Ia near maximum light, up to a redshift limit of z ≤ 0.06. We measured the velocities and pseudo-equivalent widths (pEW) of key spectral features (Si IIλ5972 and Si IIλ6355) and investigated the relation between the properties of the spectral features and the photometric properties from the SALT2 light-curve parameters as a function of spectroscopic sub-class. We discuss the non-negligible impact of host galaxy contamination on SN Ia spectral classifications, and we investigate the accuracy of spectral template matching of the DR2 sample. We define a new subclass of underluminous SNe Ia (04gs-like) that lie spectroscopically between normal SNe Ia and transitional 86G-like SNe Ia (stronger Si IIλ5972 than normal SNe Ia, but significantly weaker Ti II features than 86G-like SNe). We model these 04gs-like SN Ia spectra using the radiative-transfer spectral synthesis code TARDIS and show that cooler temperatures alone are unable to explain their spectra; some changes in elemental abundances are also required. However, the broad continuity in spectral properties seen from bright (91T-like) to faint normal SN Ia, including the transitional and 91bg-like SNe Ia, suggests that variations within a single explosion model may be able to explain their behaviour.
Key words: supernovae: general
© The Authors 2025
 Open Access article, published by EDP Sciences, under the terms of the Creative Commons Attribution License (https://creativecommons.org/licenses/by/4.0), which permits unrestricted use, distribution, and reproduction in any medium, provided the original work is properly cited.
This article is published in open access under the Subscribe to Open model. This email address is being protected from spambots. You need JavaScript enabled to view it. to support open access publication.
1. Introduction
Type Ia supernovae (SNe Ia) are commonly accepted to be the thermonuclear explosion of a carbon-oxygen (C/O) white dwarf (WD) in a binary system (Hoyle & Fowler 1960; Maoz et al. 2014). SNe Ia are proven to be reliable distance estimators and are used as ‘standardisable candles’ to measure extragalactic distances, where observations of distant SNe Ia led to the discovery of the accelerating expansion of the Universe (Perlmutter et al. 1997, 1999; Riess et al. 1998, 2016). However, the exact nature and the explosion mechanism of their progenitors still remain in question (e.g. Khokhlov 1991; Maeda & Terada 2016). Even though several progenitor scenarios are proposed for SNe Ia, the most commonly considered progenitor scenarios are the single-degenerate scenario (SD, Whelan & Iben 1973; Nomoto et al. 1997), which consists of a C/O WD and a non-degenerate companion such as a main-sequence star or an evolved star (a helium star or a red giant), and the double-degenerate model (DD, Iben & Tutukov 1984; Webbink 1984), which consists of two WDs that result in the explosion of one or both of the WDs.
The spectra of SNe Ia around maximum light are relatively homogeneous, with absorption lines of intermediate-mass elements dominating, such as Si IIλ6355, Si IIλ5972, Si IIλ4130, Ca II H&K, the Ca II near-infrared triplet, S IIλ5454, and S IIλ5640 (Zhao et al. 2021). While Si IIλ6355 absorption is the most prominent feature in SNe Ia spectra near maximum light, in peculiar cases such as SN 1991T (Filippenko et al. 1992a; Phillips et al. 1992) and SN 1999aa (Filippenko et al. 1999) this feature appears extremely weak. These SNe Ia (91T-like, 99aa-like) exhibit slow decline rates in their light curves and have higher peak absolute magnitudes on average. Strong Ti II absorption around 4300 Å is also present in some subluminous classes of SNe Ia (e.g. SN 1991bg-like; Filippenko et al. 1992b). The estimated brightness of 91bg-like SNe Ia is roughly two magnitudes lower than that of a normal SN Ia. Transitional events also exist that have spectral features and luminosities between normal and faint SNe Ia, such as SN 1986G (Phillips et al. 1987) that displayed weaker Ti II absorption than seen in 91bg-like SNe Ia around maximum light. The variation in spectral features in maximum light SN Ia spectra is most likely due to varying temperatures in the ejecta (Nugent et al. 1995; Hachinger et al. 2008), but the connection between luminosity, temperature, and decline rate is still uncertain.
Several classification schemes have been proposed to investigate the spectroscopic diversity seen in SNe Ia, in particular the velocity evolution with time of the Si IIλ6355 feature, as well as the relative strength of the Si IIλ6355 and Si IIλ5972 features. Based on the velocity evolution of Si IIλ6355, Benetti et al. (2005) divided SNe Ia into three groups: high-velocity gradient (HVG), low-velocity gradient (LVG), and a ‘faint’ group that consisted of subluminous 91bg-like events. Another classification scheme based on the pseudo equivalent width (pEW) of the Si II absorption features of 5972 and 6355 Å was introduced by Branch et al. (2006, 2009). There are four subgroups in this scheme: ‘core normal’, ‘cool’, ‘broad line’, and ‘shallow silicon’. Wang et al. (2009a) proposed a classification scheme purely based on the velocity of the Si IIλ6355 absorption feature near maximum light, where SNe Ia with expansion velocities, vSi, of v0 ≳ 11 800 km s−1 are defined as high-velocity (HV) SNe Ia and those with vSi ≲ 11 800 km s−1 are defined as normal velocity (NV) SNe Ia. Following Wang et al. (2013), we adopt 12 000 km s−1 as the velocity threshold separating HV and NV SNe in this paper. The observed diversity in velocity is thought to be independent of light-curve evolution and may be attributed, at least in part, to a viewing angle effect in explaining the diversity of HV and NV SNe Ia (Maeda et al. 2010). It has been suggested that HV SN Ia exhibit differences in their light-curve evolution (Wang et al. 2008, 2009a; Burgaz et al. 2021), have a shorter explosion to maximum light rise time (Ganeshalingam et al. 2011), have redder intrinsic B − V colour (Pignata et al. 2008), may have different extinction laws (Wang et al. 2009a; Foley & Kasen 2011), and may be more concentrated towards the centres of their host galaxies (Wang et al. 2013).
In this paper we present the analysis of the spectroscopic features of the second Zwicky Transient Facility (ZTF) Data Release (DR2) SNe Ia, obtained as part of the Zwicky Transient Facility survey from 2018 to 2020 (Bellm et al. 2019; Graham et al. 2019; Masci et al. 2019; Dekany et al. 2020), as well as the link to their photometric properties. The ZTF is an optical time-domain survey that has been in operation since 2018. It spectroscopically confirmed nearly 4000 low-redshift SNe Ia between 2018 and 2020, without biases in terms of host-galaxy properties (i.e. massive galaxies were not specifically targeted). In Sect. 2 we present the sample selection, spectroscopic classifications, and the data reduction. Section 3 discusses the measurements of spectral features (velocities and equivalent widths) and the accuracy of spectral template matching SN Ia sub-classes. In Sect. 4 we examine the spectroscopic sub-classes and how photometric properties and spectral features are related. Our conclusions and possible future works are presented in Sect. 5.
2. Sample selection and spectral measurements
In this section we discuss the overall properties of the ZTF SNe Ia in the DR2 and the methods used to analyse their spectra. In Sect. 2.2 we describe the ZTF SN Ia sample, including redshift determination, light-curve parameters, optical spectroscopy, and the methodology for their initial spectral classifications. In Sect. 2.2 we detail the cuts made on the sample to obtain our desired maximum light spectral sample. Finally, in Sect. 2.3 we present the method used to measure properties, such as velocities and equivalent widths, from the spectra.
2.1. ZTF SN Ia data release 2
The ZTF DR2 SN Ia sample contains 3628 spectroscopically confirmed SNe Ia discovered from 2018 to 2020 (see Rigault et al. 2025a and Smith et al. 2025, for further details) that had optical ZTF light curves obtained for them. Thanks to the Bright Transient Survey (BTS) programme, most of them were obtained near or before peak brightness. 61% of the ZTF SN Ia DR2 sample has host spectroscopic redshifts, among which 71% coming from DESI through the MOST Host programme (Soumagnac et al. 2024). 9% comes from identifiable host galaxy lines in the SN spectra and the remaining 30% are derived from template matching using SNID (Blondin & Tonry 2007).
Smith et al. (2025) compared the known redshift values from host catalogues and SNID redshifts for SNe Ia in the sample and found good overall agreement with a redshift dispersion of 3 × 10⁻³, corresponding to a velocity dispersion of ∼500 km s−1.
The majority of optical spectra from ZTF come from the low-resolution integral field spectrograph, SED machine (SEDm, Blagorodnova et al. 2018; Rigault et al. 2019; Kim et al. 2022) on the 60-inch telescope at the Mount Palomar observatory. These spectra are supplemented by spectra from several other telescopes with higher resolution, as discussed in Smith et al. (2025). All the spectra are corrected to the rest-frame using an estimate of its host galaxy redshift and corrected for Milky Way extinction (Schlafly & Finkbeiner 2011) using a total-to-selective extinction ratio, RV of 3.1.
As part of the ZTF DR2 analysis, a spectral typing effort was made to identify the sub-classifications of the DR2 sample into the classes of normal SN Ia (Wang et al. 2009b; Nugent et al. 2011), 91bg-like (Filippenko et al. 1992b), 91T-like (Filippenko et al. 1992a), ‘Ia-peculiar’ or if the sub-classification was unclear, ‘Ia-unclear’. The classifications were accomplished in two steps. Firstly, users were invited to try to a specially designed web tool called the typingapp1 that allowed them to see the best SNID fits of each individual spectra with several sub-types and the phase-redshift distributions. These SNID fits (Blondin & Tonry 2007) using priors based on the light-curve phase estimates from the SALT2 (Guy et al. 2007) light-curve fit and a redshift prior based on host galaxy spectral features, where this was available. Its sole purpose is to classify all SNe with spectral information only (hence, no host information was shown to users). Users could see the light curve but this was only for confirming spectral phases relative to the light-curve phase. Then, each user selected and reported sub-types for the SNe on the typingapp. The spectra of each SN Ia, along with their best fitting SNID matches, were visually inspected by multiple members of the ZTF SN Ia working group to determine the most likely sub-classification for each event. Secondly, a more thorough subclassification, targeted at the events with z ≤ 0.06 (the redshift range studied in this work), was performed (see Sect. 3.1). A detailed methodology for these classifications is also presented in Dimitriadis et al. (2025).
2.2. Sample selection
In this study, we focus on an analysis of maximum light spectra of SNe Ia and therefore, apply a number of cuts on the photometry and spectra to achieve a relatively clean and unbiased sample with well constrained spectral phases. Table 1 shows all the criteria used to define the final sample along with the number of remaining SNe Ia after each cut.
Cuts applied to obtain our final spectral sample.
The ZTF gri-band light curves of the SNe Ia in the sample were fit with version 42 of the SALT2 light-curve fitter (Guy et al. 2007), which gives the light-curve stretch, x1, colour c, and the time of maximum light, t0 (Rigault et al. 2025b). To select a suitable sample for this work with reliable phases and light-curve properties to have enough photometry data, we follow the light-curve coverage constraints of t0 from Smith et al. (2025) that requires each SN to have at least two detections in two filters both pre- and post-maximum light (relative to t0) and a total of at least seven detections across all filters. In order to have a well constrained sample, we further applied the following criteria: x1 of −4 to 4 with an uncertainty < 0.6; c < 0.8 with an uncertainty < 0.35.
Based on survey simulations, the ZTF DR2 sample is expected to be complete for normal SNe Ia up to a redshift (z) of z ≤ 0.06 (Amenouche et al. 2025). After the photometry cuts, we select SNe Ia with z ≤ 0.06 and that have at least one spectrum between −5 to 5 days with respect to the time of maximum light (t0) with an uncertainty of < 1 d, where the velocity evolution within this range has been shown to be small (e.g. Maguire et al. 2014).
We have included the bright 91T-like, bright transitional 99aa-like, normal, transitional (Hsiao et al. 2015; Gall et al. 2018) and 91bg-like objects in our sample. We disregarded all the peculiar sub-types. These sub-types include; 03fg-like SNe Ia (Howell et al. 2006), which are overluminous and show slow evolving light-curve features, 02cx-like SNe Ia (Li et al. 2003) that are underluminous and spectroscopically weird, 02es-like SNe Ia (Ganeshalingam et al. 2012) that look similar to underluminous SNe Ia with a slow light-curve evolution, SN Ia-csm (Benetti et al. 2006) that show strong interaction with circumstellar medium around them (Dilday et al. 2012). These peculiar objects and their properties are explained and studied in detail in Dimitriadis et al. (2025).
The initial spectral typing (Dimitriadis et al. 2025) for our sample of 482 SNe Ia resulted in preliminary identification of 377 normal SNe Ia, 35 91bg-like, 18 91T-like, and 52 SNe Ia (those without sub-classification, which will be referred to as Ia-unclear throughout the text). However, there is a subjective aspect to some of these classifications, such as where no further sub-classifications are taken into account while typing and making a final decision. One of our main aims was to assess the accuracy of this spectral template matching process and assign sub-classes using objective measurements of features present in the spectra, and this is discussed further in Sect. 3.1.
In order to measure the velocities and pseudo-equivalent widths (pEW) from the Si IIλ6355 feature, we only selected the spectra with high signal-to-noise ratio (S/N) higher than 5. The S/N is estimated from the Si IIλ6355 absorption feature, where the estimate is the ratio of the depth of the feature to the standard deviation in the selected continuum region. After all the cuts were applied, the final sample consists of 657 spectra of 482 unique SNe Ia between –5 to 5 days (Table 1). The redshift, phase and light-curve width parameter x1 distributions are presented in Fig. 1, split into the good light-curve coverage ZTF DR2 SN Ia sample (grey), the sample after the redshift cut of z ≤ 0.06 has been applied (blue), and the maximum light (−5 to 5 days) sample (red).
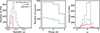 |
Fig. 1. Redshift, phase, and SALT2 x1 distributions of the ZTF SN Ia sample. Left: Redshift distribution of the full ZTF SN Ia sample (grey dashed line, 2959 SNe Ia) with good light-curve coverage; the sample with a redshift limit at z ≤ 0.06 (blue dashed line, 1093 SNe Ia); and SNe Ia passing our other cuts that have a spectrum at −5 to 5 d with respect to maximum light (red solid line, 482 SNe Ia). Middle: Rest-frame phase distribution of all good light-curve coverage ZTF SNe Ia spectra at −5 to 5 d (grey) and with the redshift cut of z ≤ 0.06. Right: SALT2 x1 distribution of the ZTF SN Ia sample. |
2.3. Velocity and width measurements
In order to study the spectroscopic properties of our SN Ia sample, we have performed several measurements on different spectral features. There are several methods to fit SN Ia spectral features seen in the optical spectra. Blondin et al. (2006) used a method based on smoothing the spectra and choosing the minimum value to obtain the line velocities. Childress et al. (2013) used a different method by applying multiple Gaussian fittings since there are triplets such as Ca II NIR that overlap. In this work, we adapt the method of Childress et al. (2013) to obtain the line expansion velocities and pseudo-equivalent widths of Si IIλ5972 and Si IIλ6355.
We start our study of the spectral absorption features by first defining a continuum for each feature. This is done visually for each spectrum by selecting regions on either side of the feature to which a line is fitted to define the continuum. The spectrum is then divided by the continuum to normalise each absorption profile. We apply a double Gaussian fit for the absorption features of Si IIλ6355 line, which is a doublet of Si IIλ6347 and λ6371 features. We force both doublet components to have the same widths, velocities, and strengths since these lines tend to saturate in the assumed optically thick regime (Childress et al. 2013). Another double Gaussian fit is applied to the absorption features of Si IIλ5972 doublet (Si IIλ5958 and λ5979), where we again fix the individual line components to have same widths, velocities and strengths.
We estimate the uncertainties on the fit parameters by varying the positions of the visually picked continuum regions on the other side of the feature and repeating the Gaussian fitting. These uncertainties are combined with the uncertainties on the individual fits to give a total uncertainty for the fit parameters. We do not want to exclude the SNe Ia with template-matched redshifts because this may bias our sample by preferentially removing fainter host galaxies that are are less likely to have a host galaxy spectrum. For 105 SNe Ia in our sample, the redshift comes from SNID template matching, and in order to account for the redshift uncertainty discussed in Sect. 2.1, we add 500 km s−1 in quadrature to the Si II velocity uncertainties.
The pseudo-equivalent width (pEW) of each feature is calculated based on the Gaussian fit parameters. For some SNe Ia in the sample, the Si IIλ5972 feature is quite weak and for these events, we calculated the 3σ upper limit of the Si IIλ5972 feature by forcing a fit at the expected Si IIλ5972 location to find the residuals of the fit and calculate the root mean square of the residuals. We infer the full width at half maximum (FWHM) of the Si IIλ5972 feature based on the relation between the FWHM of Si IIλ6355 and of Si IIλ5972 for SNe Ia where both exist. For that, we first calculated the mean FWHM of Si IIλ5972 (159 ± 25 Å) and Si IIλ6355 (100 ± 28 Å), where both exist, to estimate a scaling factor of ∼1.6 (see the right panel of Fig. 2 for the two fits, each showing similar linear relations that yields a scaling factor of ∼1.6). After correcting for the relation, we use the estimated FWHM of Si IIλ5972 to calculate the 3σ upper limits of its pEW.
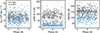 |
Fig. 2. Velocity (left), pEW (middle), and FWHM (right) of Si IIλ5972 (blue diamonds) and Si IIλ6355 (black circles) from the ZTF DR2 SN Ia sample as a function of rest-frame phases with respect to SALT2 maximum light. The black and blue dashed lines in the right panel represent the linear regression fits to the FWHM of Si IIλ6355 and Si IIλ5972, respectively. |
The velocity, pEW and FWHM of the Si IIλ5972 and Si IIλ6355 features are shown as a function of phase in Fig. 2. The results of the fits for each feature and spectrum are given in Table A.1. The distributions of velocity, pEW and FWHM are seen to be relatively flat in the phase range studied here of −5 to +5 d with respect to maximum light. No further correction for evolution within this phase range is applied.
3. Analysis
One of the aims of our study is to assess the accuracy of the sub-classification of the DR2 SN Ia sample that used the method explained above (Sect. 2.1). We also investigate the possible spectral transition from the normal to 91T-like SNe Ia in Sect. 3.1.1 and normal to 91bg-like SNe Ia in Sect. 3.1.2. The impact of host galaxy contamination on SN Ia classifications and the Si II feature is discussed in Sects. 3.2 and 3.3, respectively.
3.1. Spectral (re-)classification of the sample
To determine the accuracy of spectral-template matching, we have inspected in detail the sub-classifications from the ZTF DR2 initial analysis of all 482 SNe Ia in our maximum light sample. As discussed previously, we do not study the Ia peculiar sub-type in this analysis. In order to check the accuracy of the initial DR2 sub-typing, we visually inspected each SN Ia and compared to known examples of each sub-class that we wanted to investigate. We created a comparison sample from the peak spectra of SN 1991T for 91T-like SNe, SN 1999aa for bright transitional/99aa-like SNe, SN 2011fe for normal SNe Ia, SN 2004gs for faint transitional/04gs-like SNe, SN 1986G for 86G-like SNe and SN 1991bg for 91bg-like SNe. All spectra in our sample were visually inspected and over-plotted against different sub-types to identify the closest match for each, taking into account all key features. In Table 2, we show the initial classifications of the DR2, as well as our changes to those initial categories.
The sub-type reclassification of the ZTF DR2 volume limited SN Ia sample.
Classifications of ZTF DR2 sample with different dDLR cuts.
We are particularly interested in constraining the diversity of the events at the two transition boundaries − from normal to overluminous (e.g. 91T-like) and from normal to subluminous (e.g. 91bg-like). Therefore, we are investigating subtle differences in their spectral properties. In Sect. 3.1.1 we discuss the sub-classification criteria for SNe Ia around the normal to overluminous boundary (99aa-like, 91T-like). In Sect. 3.1.2 we discuss the SN Ia sub-classification at the normal to underluminous boundary (04gs-like, 86G-like, and 91bg-like).
There are 52 SNe Ia that were initially classified (prior to our analysis) as Ia-unclear, meaning that a sub-classification had not been made. In this work, we have reclassified 23 of these cases into sub-classifications: 91T-like, 99aa-like, and normal. None of the Ia-unclear were reclassified into the underluminous sub-classes. The initial DR2 classification exercise identified 377 normal SNe Ia. However, we updated these classifications to find a total 295 events with a normal SN Ia classification. (see Table 2 for the reclassification statistics and the second column of Table 3) for the updated numbers in each class (before any host contamination cuts).
We have also identified 59 SNe Ia that the initial DR2 typing did have a sub-classification for but we have overturned to be Ia-unclear. This gives a final total of 88 events with an Ia-unclear classification based on our re-classifications. The main causes of the lack of a sub-classification were either host contamination, where one or more critical features were not covered, or due to low S/N in the spectra. We discuss the impact of host galaxy contamination in further detail in Sect. 3.2. We note that in this analysis, we are only concerned with their spectral classifications and do not consider any of their light-curve properties such as x1, c or any galaxy properties in determining our classification and base our classifications purely on spectroscopic observations around peak.
3.1.1. The normal to 91T-like spectral transition
In the normal to overluminous 91T-like region, updated classifications were done by comparing the spectra in our sample at similar phases with the overluminous prototype SN 1991T, the normal SN 2011fe and a transitional event between these two classes, SN 1999aa (Fig. 3). 91T-like SN Ia spectra around maximum light have weak Si II features (6355 and 5972 Å) compared to normal SN Ia spectra. S II and Ca II H & K features are considerably weaker than in a normal SN Ia, where Phillips et al. (2022) showed the lack of Ca II H & K feature itself is an identifier for true 91T-like events. Objects with spectral properties between 91T-like and normal SNe Ia are classified based on the transitional object SN 1999aa. While the Si IIλ6355 feature of 99aa-like SNe Ia near maximum light are stronger than 91T-like SNe Ia, they are still on the lower side of normal SNe Ia. The classification of these transitional 99aa-like objects follow the closeness of pEW of Si IIλ6355 to those in SN 1999aa. While some of these classifications are subjective, our classifications align closely with the method used to identify 91T-like events from Phillips et al. (2022) since near maximum light the pEW separation of Si IIλ6355 itself is well established between these three sub-classes.
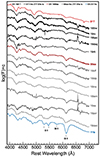 |
Fig. 3. Examples of 91T-like (black) and 99aa-like (grey) maximum light spectra are shown compared to the labelled spectra of SN 1991T, SN 1999aa, and SN 2011fe at similar phases. The key features for identifying these SNe Ia are marked. Each spectrum has been corrected for MW extinction (Schlafly & Finkbeiner 2011). |
We visually inspected the 18 initially classified 91T-like objects and reclassified 9 of them as bright transitional 99aa-like SNe Ia based on the closer similarity of their Si IIλ6355 feature strength to that of SN 1999aa than to SN 1991T or SN 2011fe. We confirm that in total seven of our sample are true 91T-like SN Ia based on best-matching spectral comparisons to 91T-like events. 39 SN are reclassified as 99aa-like, where 9 events where initially classified as 91T-like, 18 events as normal and 12 events as Ia-unclear (see Table 2).
3.1.2. The normal to 91bg-like spectral transition
Similarly to the overluminous spectral transition, we have also visually inspected the sample to identify the diversity of subluminous events, spanning from normal to 91bg-like SNe Ia. 91bg-like events are generally recognised spectroscopically by the strong Ti II lines near 4300 Å around peak brightness. A ‘W’ shaped S II feature is less clearly visible than in a normal SN Ia. Si IIλ5972 and Si IIλ6355 features and the O Iλ7773 feature are especially prominent. Based on their spectroscopic similarities to those of SN 1991bg, 24 SNe in our sample are identified as 91bg-like.
SNe Ia identified as 86G-like are transitional events between normal and 91bg-like SN Ia (Phillips et al. 1987). The spectra of SN 1986G had stronger Si IIλ5972 and Si IIλ6355 features than normal SNe Ia and some absorption due to Ti II in the 4300 Å wavelength region but this was not as strong as seen in 91bg-like events (Ashall et al. 2016), which likely indicates an intermediate state between a normal and 91bg-like SNe Ia. By following the spectroscopic characteristic differences mentioned above, we identified 11 SNe Ia in our sample as 86G-like events, 3 of them were originally classified as normal and 8 as 91bg-like, demonstrating the difficulty in sub-classifying these events without careful comparison of relevant features. The strength of the Ti II feature is the main feature used to separate the 91bg-like events and 86G-like events. Examples of their maximum light spectra compared to other sub-classes are shown in Fig. 4.
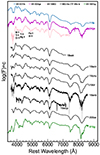 |
Fig. 4. Sub-sample of 86G-like SN Ia spectra (shown in black) around maximum light are compared to those of SN 2004gs, SN 1986G, SN 1991bg, and SN 2011fe at similar phases. The key features identifying these SN Ia are shown. Each spectrum has been corrected for MW extinction. |
In our sample, we have also identified SNe Ia that do not meet the spectroscopic criteria to be classified as 91bg-like or 86G-like but that are spectroscopically most similar to a faint normal SN Ia, SN 2004gs (Park & Li 2004; Morrell et al. 2004; Blondin et al. 2012). SN 2004gs was first discovered by Park & Li (2004) and classified as a SN Ia by Morrell et al. (2004). SN 2004gs is ∼10 kpc away from its S0 type host galaxy, PGC024286. SN 2004gs has been observed as a part of Center for Astrophysics Supernova Program (CfA) and its spectral and light-curve parameters are published by Blondin et al. (2012), where it was classified as a normal SN Ia. However, SN 2004gs appears to be an intermediate state between a normal SN Ia and a transitional 86G-like SN Ia. It shows significantly stronger Si IIλ5972, O Iλ7773, and Ca II NIR features and with weaker Ti II feature near 4300 Å than seen in a normal SN Ia spectrum (see Fig. 5). The Ti II feature in the peak spectra is not as strong as a transitional (86G-like) SN Ia but still present, while the Mg II 4481 feature is more prominent in SN 2004gs. We identify 18 SNe in our sample as similar to 04gs-like (some of which are shown in Fig. 5) based on the existence of stronger abundances of Si IIλ5972, Si IIλ6355, O Iλ7773, and Ca II NIR than normal SNe. These SNe also show considerably weaker abundance of Ti II near 4300 Å than 86G-like and 91bg-like SNe. They were all initially classified in the DR2 typing effort as normal SNe Ia.
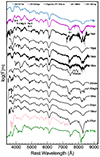 |
Fig. 5. Sub-sample of 04gs-like (shown in black) ZTF DR2 SNe Ia around maximum light plotted with the spectra of SN 2004gs, SN 1986G, SN 1991bg, and SN 2011fe at similar phases for comparison. The key features identifying these SN Ia are shown in the figure. Each spectrum in the figure is corrected for MW extinction. |
3.2. The impact of host galaxy contamination on SN Ia classification
There are 88 SN Ia in our sample without a sub-classification, even after visual inspection. Some of these spectra are visibly contaminated by host galaxy light. Since 91T-like events have weak Si IIλ6355 and Si IIλ5972, that could mean that it is preferentially classified as Ia-unclear if the S/N ratio is slightly lower or it is more contaminated by host galaxy light where it cannot be easily distinguished from a normal SN Ia. We have investigated a number of methods of quantifying the impact of host galaxy contamination on the SN Ia classifications and line measurements (pEW, velocity).
Host galaxy properties of the ZTF DR2 sample is presented in Smith et al. (2025), where the software package Host_Phot3 was applied to Pan-STARRS DR2 (PS1; Chambers et al. 2016) images to obtain the Kron fluxes and the Directional Light Radius (DLR; Sullivan et al. 2006; Smith et al. 2012; Gupta et al. 2016). The DLR is the elliptical radius of a galaxy in the direction of the SN. The measure of the offset of a SN from the centre of its host galaxy that is scaled by the elliptical radius of the galaxy in the direction of the SN is called the dDLR. It is a measure of the SN to host galaxy centre separation corrected for the differing sizes of galaxies. The dDLR distribution of the ZTF DR2 sample ranges from zero to seven but peaks at a value of ∼0.2, with most SNe Ia having dDLR values of less than three.
The local surface brightness of the galaxy at the position of the SN can also be estimated as a measure of the likely host contamination in our spectral measurements. These values were estimated for SNe Ia in the ZTF DR2 using a galaxy image decomposition involving four morphological models, bulge, disk, bulge+disk and bulge+bar+disk (Senzel et al. 2025). The model fits were performed in surface brightness space (mag/arcsec2) and the local surface brightness values used in this paper are sampled from the models at the location of the SN. The galaxy models undergo several quality control steps during the fitting procedure, ensuring that only well-fit and physically accurate models make it into the final sample. From the original 3628 SNe Ia in ZTF DR2, the final sample consists of 724 modelled galaxies. After the applied selection criteria (see Sect. 2.2), 115 out of 482 SN Ia have surface brightness values (∼24 per cent).
The local surface brightness is likely a better measure than the dDLR of the contamination of the SN spectra but unfortunately is only available for 24 per cent of the SNe Ia in our final sample. We have compared our dDLR and local surface brightness values in the g band for the SNe Ia that have both measurements (see Fig. 6, left). We identify a clear trend between both quantities, where the larger the dDLR (larger corrected offset from the host centre), the fainter the underlying local surface brightness. A power law model for dDLR and local surface brightness relation was found to fit the quantities well.
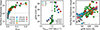 |
Fig. 6. Relationships between local surface brightness, dDLR, and Si IIλ6355 pEW for SN Ia sub-types. Left: Local surface brightness compared with the dDLR of volume limited ZTF DR2 sample. The fit shown with a black solid line on the plot is used to estimate a dDLR value (vertical dashed line) based on the chosen surface brightness magnitude of 20.1 mag (horizontal dotted line). Middle: Si IIλ6355 pEW plotted against velocity for three different sub-types of SNe Ia: 91T-like (represented by squares), 99aa-like (represented by diamonds), and normal (represented by circles). The data points for each SN sub-type are shown with increasing levels of host galaxy light contamination (25, 50, 75, and 100 per cent) from top to bottom. The different colours represent different galaxy types used to simulate the contamination effects. This allows for the comparison of how various galaxy types influence the measured Si IIλ6355 pEW for different SN sub-types and how the pEW is affected by increasing galaxy contamination. Right: Local surface brightness plotted against the pEW of Si IIλ6355 feature. The grey dotted line represents the equivalent value of dDLR where we applied our cut of dDLR = 0.2, based on the corresponding surface brightness magnitude of 20.1 mag. The red and blue dashed line represents the regression line fitted to all the data and the data with the dDLR cut, respectively. The red and blue shaded regions represent the confidence interval around the corresponding regression lines. A strong correlation between the pEW of Si IIλ6355 and local surface brightness and its effect on sub-typing is shown. |
We have colour coded in the SNe Ia in Fig. 6 and find that the Ia-unclear sub-class is much more highly represented at small dDLR/bright local surface brightness compared to normal events or other sub-classes. This suggests that the inability to sub-classify is likely driven significantly by the contamination from host galaxy light. However, since some sub-classes may have host galaxy dependencies (e.g. a general preference for 91T-like events to occur in star-forming host galaxies; Phillips et al. 2022), we want to bias our sample as little as possible. Therefore, we would like to apply a balanced cut on the dDLR/surface brightness values that removes a large percentage of the Ia-unclear that occur in the inner brighter regions of their host galaxies but does not remove too many SNe Ia from our sub-classes with smaller numbers of events.
To do this, we test the impact of removing events with dDLR less than 0.1, 0.2, and 0.3 compared to no cut on the sample on the different sub-types (Table 3). By placing a cut to remove events that have dDLR < 0.1, we would remove ∼25 per cent of the Ia-unclear sample, only ∼5 per cent of the normal SN Ia sample, two 99aa-like event and one 04gs-like event, which is equivalent to 2 per cent of the other sub-types. Increasing this cut to dDLR < 0.2 would remove ∼52 per cent of the Ia-unclear classification, ∼12 per cent of the normal SN Ia sample, and ∼6 per cent from the rarer sub-classes. Increasing the cut to remove objects with dDLR < 0.3 removes ∼70 per cent of the Ia-unclear, ∼20 per cent of the normal SN Ia, and ∼20 per cent from the rarer sub-classes. At all cut levels, a much more significant percentage of events without a sub-classification (Ia-unclear) is removed compared to the other sub-classes. For our final sample, the choice of dDLR is somewhat arbitrary but we choose to exclude all the events with dDLR < 0.2 based on the minimal impact it has on the rarer sub-types while removing nearly half of the Ia-unclear. Some of the remaining Ia-unclear in the sample are likely contaminated by host galaxy features but may also not have the wavelength coverage for identification of features necessary for sub-classification or low S/N at the wavelengths of key features. This dDLR cut of 0.2 is equivalent to a local surface brightness of 20.1 mag based on our power law model fit to the relation (left panel of Fig. 6). It is this final sample of 392 SNe Ia (Table 3) that is considered in the subsequent analysis.
3.3. The impact of host galaxy contamination on Si II feature measurements
We demonstrated the direct impact of host contribution on SN Ia spectral sub-typing in Sect. 3.2 and removed those events that are most heavily contaminated. However, it is likely that host contamination is still present in SNe Ia in our sample and we wish to determine what impact this may have on the measured spectral parameters (velocity, pEW). We tested this by artificially injecting host galaxy contamination into test SN Ia spectra from our sample. We did this by taking spectra that were visually uncontaminated by host light of a normal, a 91T-like, and a 99aa-like SN Ia and combining with template galaxy spectra of two spirals (Sa, Sb) and an elliptical (E) from Kinney et al. (1996). Each SN spectrum was combined with each galaxy template at varying flux ratios of galaxy contamination of 0.25, 0.5, 0.75, and 1 and then the combined spectra were fit with our spectral line analysis code to determine the parameters of the Si IIλ6355 features.
In middle panel of Fig. 6, we show the pEW of the Si IIλ6355 feature against its velocity for the three SN Ia sub-classes with varying host contamination of the three different galaxy templates. We observed a considerable decrease in the measured pEW of each sub-class as the host galaxy contamination was increased, ranging from a 17 per cent change to almost 50 per cent in the normal SN Ia for the most contaminated spectrum. The velocity measurement changes were smaller with an increase of up to 450 km s−1 for the normal SN Ia and decrease in the 99aa-like event of 500 km s−1. A decrease in pEW measurements in SN Ia spectra was also determined by Nordin et al. (2011) due to host galaxy contamination.
In the right panel of Fig. 6, we show the g-band local surface brightness against Si IIλ6355 pEW for SNe Ia in our sample before the dDLR cut of 0.2. A linear regression fit to the data is shown with red dashed line on the right panel of Fig. 6. The events with an Ia-unclear classification cluster below a pEW of ∼70 Å. Based on our dDLR cut that removes values below 0.2, this is equivalent to a value of 20.1 mag for the local surface brightness. We then remove all SNe Ia with brighter local values than 20.1 mag, where the blue dashed line on the right panel of Fig. 6 shows the linear regression fits for before and after the removal of the objects. After removing objects brighter than 20.1 mag, the significance level between the surface brightness and the pEW of Si IIλ6355 seemed to decrease by approximately two sigma. This suggests that the events heavily contaminated by host galaxy light are driving this correlation. However, our tests of spectral contamination indicate that the rest of the sample may also be affected, leading to smaller measured values of the Si IIλ6355 pEW than those that are intrinsically present.
4. Results and discussion
In Sect. 4.1 we present the Branch classification diagram (Branch et al. 2006) of the ZTF SN Ia DR2 sample based on their pEW values. We also discuss the relative rates of SNe Ia in each of the subclasses and their key differences. In Sect. 4.2 we present the pEW and velocity distributions of normal SNe Ia from the Wang classification scheme (based on pEW and velocity of the Si IIλ6355 feature) and investigate the properties of NV and HV SNe Ia. The spectral properties and TARDIS analysis of faint normal SNe Ia are presented in Sect. 4.3. In Sect. 4.4 the connection between the spectral properties of SNe Ia and their SALT2 light-curve properties are presented.
4.1. Branch classification
In Fig. 7, we present the pEW of the Si IIλ5972 feature against the pEW of the Si IIλ6355 feature for spectra in the phase range of –5 to +5 days with respect to the time of maximum light, t0. SNe Ia with a dDLR less than 0.2 have been removed. In cases where multiple spectra are available for a given SN within the phase range, the one nearest to maximum light is chosen.
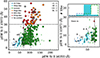 |
Fig. 7. Distribution of Si IIλ5972 and Si IIλ6355 pEW values across SN Ia sub-types. Left: pEW of Si IIλ5972 plotted against pEW of Si IIλ6355 based on sub-types of SNe Ia taken from Branch et al. (2006) for the 392 SNe Ia from the ZTF DR2 sample with dDLR greater than 0.2. Branch sub-type zones are shown with the black dashed lines following the limits from Folatelli et al. (2013), with SS for shallow silicon, CN for core normal, BL for broad line and CL for cool events. The filled circles in the different colours represent the SN Ia types. Upper limits shown in the plots are plotted as downward arrows (see Sect. 2.3). Right: Zoomed-in plot of the SS SN Ia region along with the histogram above the number of events of the 91T-like, 99aa-like, and normal SN Ia sub-types in this region, showing the transition from 91T-like (dark blue) to 99aa-like (cyan) to normal (green) with increasing pEW of Si IIλ6355. |
It is well established that the pEWs of the Si IIλ5972 and Si IIλ6355 features are strongly correlated in the identification of SN Ia sub-types (Branch et al. 2006), where they can be separated into four spectral sub-classes: core normal (CN), shallow silicon (SS), broad line (BL), and cool (CL), based on the strength ratio of these features. We follow the same criteria as Folatelli et al. (2013) to assign the Branch sub-classes. A clustering analysis of the Branch diagram parameters using a Gaussian mixture model suggested that these four broad classes are well-defined statistically (Burrow et al. 2020).
In our sample, we have 35 SS, 122 CN, 51 BL, and 56 CL coming from direct measurements of the features. Using our three-sigma limits on the pEW of Si II 5972 Å feature, we can assign a additional objects to the subclasses of 69 SS, 39 CN, 19 BL, and one CL. Out of 392 SNe Ia, ∼26% have a SS sub-class, ∼41% have a CN sub-class, ∼18% have a BL sub-class, and ∼15% have a CL sub-class. Blondin et al. (2012) analysed SN Ia spectra obtained by the Centre for Astrophysics (CfA) Supernova Program and assigned Branch classifications using spectra around maximum light. Out of 218 SNe Ia in their sample ∼15% have a SS sub-class, ∼40% have a CN sub-class, ∼28% have a BL sub-class, and ∼17% have a CL sub-class. In another work, Folatelli et al. (2013) presented the optical spectra of SNe Ia with the spectra obtained by the Carnegie Supernova Project (CSP; Hamuy et al. 2006). Out of 78 SNe Ia at maximum light in their sample, ∼13% have a SS sub-class, ∼32% have a CN sub-class, ∼28% have a BL sub-class, and ∼27% have a CL sub-class. Assuming Poissonian uncertainties, on the relative percentages, our relative rates are broadly comparable to those of CfA and CSP. However, our SS rate is slightly higher, which may be due to the CfA and CSP studies not including events with only upper limits on their Si II 5972 Å feature but their spectra are generally higher S/N than the mean of our sample.
In Fig. 7, we also show the spectral types (91T-like, 99aa-like, normal, 04gs-like, 86G-like, 91bg-like, and Ia-unclear) we have identified for the 392 SNe Ia in Sect. 3.1. The normal SNe Ia fall generally fall into the CN and BL region, with some at the boundary of the Si IIλ6355 pEW between SS and CN (discussed more in Sect. 4.1.1). The 91bg-like, 86G-like, and 04gs-like SNe Ia are predominantly found in the CL region of Fig. 7, while the 91T-like and 99aa-like events are found in the SS region. These clusters of spectroscopic sub-classes in the Branch diagram are not unexpected since the Si II features are some of the main features used to sub-classify SN Ia spectra.
4.1.1. How rare are 91T-like events?
The SS Branch sub-class (those with both weak Si IIλ5972 and Si IIλ6355 features) is made up of ∼33 per cent 99aa-like, ∼32 per cent normal SNe Ia, ∼28 per cent Ia-unclear, and ∼7 per cent 91T-like. All 91T-like and 99aa-like SNe Ia in our sample are in the SS region. While we see similar rates of normal and 99aa-like SNe Ia in the SS region (see right panels of Fig. 7), true 91T-like SNe Ia remain rare at ∼7 per cent. All 91T-like SNe Ia have shallower Si IIλ6355 features than the 99aa-like events. The 91T-like SNe Ia all have Si IIλ6355 pEW values below 31 Å, while the 99aa-like SNe Ia have values in the range of 32 to 63 Å. Only four 99aa-like SNe Ia have a pEW Si IIλ6355 value higher than 55 Å (55, 60, 62 and 63 Å). Normal SNe Ia start to dominate the population with Si IIλ6355 pEW above ∼55 Å. Conversely, only two normal SNe Ia have pEW Si IIλ6355 values lower than ∼55 Å, at 51.5 and 54.5
 Å.
Å.
Figure 7 shows that most SNe Ia without a sub-classification (Ia-unclear) are on the lower end of the pEW Si IIλ6355 distribution. Approximately 70 per cent of the 42 SNe Ia without a sub-classification are in the SS region. We have shown in Sect. 3.2 that significant host contamination has the impact of decreasing the measured pEW of the Si II lines, while also making sub-classification more difficult in general. Therefore, it is unsurprising that the majority of events without a sub-classification are among the events with the weakest Si II pEW values. In the most extreme case where the host galaxy contamination is comparable to the SN flux, the pEW of the Si IIλ6355 feature may be up to 35 Å weaker due to host contamination than the intrinsic SN measurement. This could result in many of the unclassified Ia-unclear class moving into the core normal region on the Branch diagram (see bottom right panel of Fig. 7).
The rareness of the 91T-like events cannot be explained by the host contamination because significant host contamination decreases the pEW. Even if we assume all Ia-unclear that have similar Si IIλ6355 pEW values to those of the 91T-like SNe (< 31 Å) are also 91T-like, the rate is still less than 5 per cent of all SNe Ia in our sample.
Phillips et al. (2022) identified a sample of 91T-like events based on their Si IIλ6355 pEW as a function of phase, the time of maximum in the i band relative to the B band, and the presence of a clear secondary maximum in the i band. Their Si IIλ6355 pEW cutoff was < 40 Å at B-band maximum to < 50 Å at +10 days relative to maximum light. Our maximum-light (−1 to +5 d) 91T-like SNe are defined by the visual inspection method discussed in Sect. 3.1.1 and broadly in agreement with Phillips et al. (2022). They identified that their 91T-like events are overluminous in their Hubble residuals compared to other SS and CN SNe with similar light-curve decline rates.
Several normal SS SNe Ia are spectroscopically quite similar to the SNe Ia in lower limits of CN SNe Ia, showing a continuity in the pEW of Si IIλ6355 feature from SS to CN class. Hence, the defined separation at a pEW of Si IIλ6355 at 70 Å between SS and CN becomes less relevant than the separation between 99aa-like and normal SN Ia at ∼55 Å. A recent study from Chakraborty et al. (2024) shows that 99aa-like SN Ia can be separated into two groups, one showing similar LC properties to 91T-like SN Ia and other closer to brighter end of normal SN Ia, suggesting the later one bridging a continuity from normal to bright end of SN Ia. O’Brien et al. (2024) did TARDIS based analysis on 91T-like SN Ia and normal SN Ia. Through the effect of abundances and ionisation states of intermediate-mass elements in the spectra of these sub-types, it is concluded that continuity is seen between the normal and 91T-like SN Ia.
4.1.2. The diversity of cool events
The CL SN Ia sub-class of Branch et al. (2006) consists of SNe Ia with deeper Si IIλ5972 absorption (Fig. 7), often associated with low-luminosity events. The 91bg-like and 86G-like events are seen to dominate the CL class, but there are faint normal SNe Ia (04gs-like) that fall into this region in Fig. 7 as well. We have visually inspected these events and find that all 17 04gs-like SNe Ia in the CL class have the strong Si IIλ5972 of 91bg-like and 86G-like events but have significantly less Ti IIλ4300. These faint SN Ia also have stronger Ca II NIR and O I in their spectra than normal SNe Ia, populating the region between normal and the 86G-like events. While these faint SNe Ia do not show any preference in Fig. 7, other than all being in CL class, they do exhibit a clear difference in their light-curve properties (see Sect. 4.4). Seven SNe Ia in the CL region did not have key features in their spectra or were still host contaminated, making us unable to sub-classify them.
4.1.3. A continuum from core normal and to broad-line
In Fig. 7, the Branch classification of CN is dominated by SNe Ia that are also spectroscopically classified as normal SNe Ia (∼95 per cent). This suggests that the vast majority of normal SNe Ia can be identified by solely the pEW of their Si IIλ6355 and Si IIλ5972 features. There is only one 91bg-like event and one 86G-like event falling in this CN group. Both of these events displayed significant host contamination in their spectra (although they have dDLR values above our cut-off of 0.2), diminishing the Si IIλ5972 feature, hence lowering the pEWs of these SNe Ia (see Sect. 3.2) from likely CL to CN.
The BL SN Ia sub-class is exclusively SNe Ia that are visually spectroscopically classified as normal SNe Ia. This is likely because their most common spectral match in the SNID database is the BL SN Ia, SN 2002bo (Benetti et al. 2004; Stehle et al. 2005). The most extreme BL in our sample is SN 2018ccl, with a very high Si IIλ6355 pEW of ∼197 Å. This extreme case is similar to SN 1984A (Branch et al. 2006), which had a Si IIλ6355 pEW of ∼200 Å.
Previous studies have found that a significant fraction of SNe Ia possess secondary, high-velocity absorption components, predominantly in the Si IIλ6355 and Ca II NIR features (Hatano et al. 1999; Quimby et al. 2006; Childress et al. 2013; Maguire et al. 2014; Silverman et al. 2015) up to maximum light. The findings of Harvey et al. (2024) suggest that up to 42 ± 12 per cent of BL SN Ia classifications are due to the presence of an additional high-velocity component that broadens the line. Burrow et al. (2020) used Gaussian mixture models to investigate the Branch diagram from their data and showed that when the Si IIλ6355 velocity is taken into account in the analysis, the BL group is nearly distinct from the other Branch sub-classes, which further supports the case of the BL class being highly affected by the HV components since the combined velocity would be higher when two blended components are present.
4.2. Wang classification and velocity-pEW relation
The Wang classification scheme introduced by Wang et al. (2009a) of normal velocity (NV, vSi ≲ 11 800 km s−1) and high velocity (HV, vSi ≳ 11 800 km s−1) is solely based on the velocity of the Si IIλ6355 absorption feature around the peak of the SN light curve. In this paper 12 000 km s−1 is used as the velocity threshold separating HV and NV SNe Ia (Fig. 8). This classification only applies to normal SNe Ia, and all other sub-types, including the Ia-unclear, are excluded from the classification scheme. 257 out of 392 SN Ia in our sub-sample are classified as normal, and we assigned 191 SNe Ia as NV SN Ia (74%) and 66 SNe Ia as HV SNe Ia (26%). The mean velocity and the mean pEW 6355 of the NV SNe Ia in our sample are 10 974 ± 47 km s−1 and 86 ± 1 Å, respectively (Fig. 8). The mean velocity and the mean pEW 6355 of the HV SNe Ia in our sample are 13 124 ± 130 km s−1 and 103 ± 4 Å, respectively. These are broadly consistent with the results of Blondin et al. (2012), where the mean velocity and the mean pEW 6355 of the NV SNe Ia were estimated as ∼11 000 km s−1 and ∼95 Å. Small differences are not unexpected given differences in the origins of host galaxy redshifts (SNID compared to spectroscopic), the impact of smoothing, as well as our wider spectral phase range of ±5 d from maximum light, compared to ±3 d from maximum light in Blondin et al. (2012). Since in our sample we have more early spectra (Fig. 1) and for normal SNe Ia the earlier spectra tends to have smaller pEW values (Folatelli et al. 2013) than the after maximum light ones, this could explain the average pEW of Si IIλ6355 in our sample being smaller by a few angstroms compared to Blondin et al. (2012).
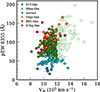 |
Fig. 8. Pseudo equivalent widths of the Si IIλ6355 feature plotted against the velocity of the same line (vSi) near maximum light (−5 to 5 days). Where several measurements exist for a given SN in the phase range used, we selected the one closest to maximum light. The different colours represent the different sub-types used in this study. The green filled and open circles represent respectively the NV SNe Ia and HV SNe Ia within the normal SNe Ia in our sample. |
As can be seen in Fig. 8 99aa-like objects have a similar velocity distribution to normal SNe Ia, with an average Si IIλ6355 velocity of 11 026 ± 184 km s−1 but a lower average pEW of 46 ± 1 Å. 91T-like objects in our sample on average slightly slower than the normal and 99aa-like objects with an average Si IIλ6355 velocity of 10 673 ± 247 km s−1 and have smaller pEWs of 26 ± 2 Å. 91bg-like objects also show similar velocities with an average Si IIλ6355 velocity of 10 315 ± 156 km s−1 and higher pEWs of 91 ± 4 Å.
4.3. Are 04gs-like events a continuum from normal SNe Ia?
To determine if the intermediate spectral features of SN 2004gs between those of normal and sub-luminous (86G-like) SNe Ia can be achieved by temperature or abundances changes, we use the 1D Monte Carlo radiative transfer code TARDIS (Kerzendorf & Sim 2014; Kerzendorf et al. 2020). The input parameters for TARDIS consist of the luminosity, the time elapsed since the explosion, the photospheric velocity, and profiles of abundance and density. TARDIS works under the assumption that a distinct, well-defined photosphere emits a blackbody continuum, bridging the transition between the optically thick and thin regions of the ejected material. TARDIS is commonly used and has proven to be successful at applying constraints to the broad range of SN ejecta coming from different sub-types such as 91T-like SNe Ia (O’Brien et al. 2024), normal SNe Ia (O’Brien et al. 2021; Ogawa et al. 2023), 02cx-like SNe Ia (Magee et al. 2016; Srivastav et al. 2020), and 86G-like SNe Ia (Harvey et al. 2023). By varying the input parameters, namely the luminosity and abundance profile, we aim to have a self-consistent model that can produce the primary key features (Ti II, Si II, O I, and Ca II NIR) of a photospheric-phase spectrum (+0.3 d relative to g-band peak) for SN 2004gs.
Firstly, we investigate the effect of changing the photospheric temperature, choosing our abundance and density profiles to be the custom SN 2021rhu model from Harvey et al. (2023). This model was chosen as it reproduces well the Ti II evolution in the 86G-like event, SN 2021rhu, which appears to be a stronger variation of the peculiarity seen in SN 2004gs. With the photospheric velocity at 10 500 km s−1 and the time since explosion at 16.8 d (input parameters for the −1.4 d spectrum of SN 2021rhu), we vary the photospheric temperature through the requested luminosity parameter to evaluate the effect upon the morphology of the Ti II feature at ∼4300 Å. We run these simulations at six temperatures in the range of 9300–12 700 K (Fig. 9, top panel). While there is a large evolution with the changing temperature in the Si IIλ5972 feature and therefore, the Si II 5972 to Si II 6355 Å ratio, there is little evolution in the Ti II feature, which fails to match the faint Ti II seen in SN 2004gs spectra, while having a strong Si IIλ5972 feature.
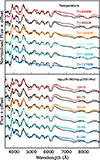 |
Fig. 9. Effects of temperature and abundance variations in faint SNe Ia. Top: Custom model spectra created for SN 2021rhu compared to a +0.3 d relative to g-band peak spectrum of SN 2004gs (black solid line). Each colour represents a different temperature setting, while keeping the rest of the initial conditions as same. The spectra shown are normalised by their value at 4000 Å to better line up the Ti II and Si II features. It is seen that the varying temperature impacts the strength of the Si IIλ5972 features, but has no considerable impact on the Ti II feature. Bottom: Set of spectral configuration of the N100 model (red) and the custom model created for SN 2021rhu (dark blue). The ratio of each model mixed is shown next to each model spectrum (calculated in log space). The best match of SN 2004gs is with the 40:60 model, which implies that the abundances of the 04gs-like faint SNe Ia are between the transitional 86G-like and the normal SNe Ia. SN 2004gs is less luminous than SN 2021rhu and is slightly cooler, and therefore has a stronger Si IIλ5972 feature. |
We subsequently investigate various blended models between this custom model for SN 2021rhu and the delayed detonation N100 model (Röpke et al. 2012; Seitenzahl et al. 2013). The time since explosion is once again taken as 16.8 d, and the photospheric velocity as 10 500 km s−1, with the luminosity parameter fixed as log10(L/L⊙) = 9.2 to align with the spectrum of 2004gs; lower than the log10(L/L⊙) = 9.3 for SN 2021rhu. We start with the pure N100 model, mixing in more of the SN 2021rhu abundance profile with each step but leaving the temperature fixed. In each step we mix in 20 per cent more of the SN 2021rhu abundance profile in log space until it becomes the pure SN 2021rhu model. The resulting abundance profile, X, can be expressed as
 (1)
(1)
where A is the fraction of the N100 abundance profile, XN100 is the abundance profile of the N100 model, and X2021rhu is the abundance profile of the SN 2021rhu model.
As the temperature remains fixed between these simulations (only varying the abundances between the pure N100 and the SN 2021rhu-matched models) the Si II ratio stays relatively constant for each mixing step, matching the observed spectrum closely. However, due to the changing abundances, there is significant variation in the Ti II feature, with the best match for the weaker Ti II line seen in SN 2004gs compared to SN 2021rhu coming from the 40:60 model (Fig. 9, bottom panel). This model consists of 40 per cent of the N100 model abundances and 60 per cent of the SN 2021rhu model bundances (scaled in log space), and produces the strong Si IIλ5972 feature and relatively strong O I and Ca II NIR features, along with the relatively weak Ti II 4300 Å feature to match the SN 2004gs spectrum well. Our findings suggest that variations in temperature alone are insufficient to produce the spectral properties seen in faint normal SNe Ia compared to normal SNe Ia. A combination of both temperature and abundance profile is key in the formation of these events and suggests that there is a potential continuum from normal to faint SNe Ia.
Nugent et al. (1995) suggested that temperature may be the dominant explanation for the spectral sequence seen in SNe Ia around maximum light. The spectra generated in Nugent et al. (1995) were synthesised with a model derived from the W7 deflagration model (Nomoto et al. 1984). They augmented the Ti abundance by a factor of 10 and were able to reproduce the range of morphologies for the Ti II feature from SN 1991bg through the transitional objects to the normal population simply by altering the temperature, unlike our findings here. The W7 Ti abundance is very compact, dropping off sharply above ∼12 000 km s−1. This results in a model that is very sensitive to temperature changes, as with all of the Ti concentrated around the photosphere, a shift in photospheric temperature will result in an ionisation shift for almost all of the Ti present. The fiducial SN 2021rhu model from Harvey et al. (2023) possesses a far more extended Ti distribution – as does the N100 model – and is therefore, far less sensitive to changing photospheric temperatures. Over the range 10 500–12 000 km s−1 the SN 2021rhu model contains ∼11 times as much Ti than the W7 model, similar to that of the model investigated in Nugent et al. (1995).
It is well known that SNe Ia in elliptical early-type galaxies are found to be intrinsically fainter with faster evolving light curves than SNe Ia in spiral late-type galaxies (Hamuy et al. 1995; Gallagher et al. 2005; Sullivan et al. 2006). While the host galaxy studies are not the scope of this paper, all the 04gs-like faint normal events in our sample are from late-type, high-mass host galaxies (log10 (M⋆/M⊙) ≳ 10) as is also mainly seen for transitional and 91bg-like events. Hence, for faint normal SNe Ia like SN 2004gs, our findings agree with the previous studies showing faint normal SNe Ia preferring to explode in late-type galaxies.
4.4. Connection with light-curve properties
In this section we compare the spectral line measurements of our SN Ia sample to those of their SALT2 light-curve parameters (x1, c). We present the peak Si IIλ6355 velocity, vSi as a function of x1 and c for the normal SN Ia sample in Fig. 10. We adopt the NV/HV classification scheme of Wang et al. (2009b) for splitting the sample based on their velocities. The weighted average of x1 for the HV and NV SNe Ia in our sample are −0.68 ± 0.13 and −0.18 ± 0.07, respectively, showing a 3.4σ difference between the two samples. The two populations (NV/HV) show similar distributions with the SALT2 c parameter as seen in Dettman et al. (2021), with mean c for the NV and HV SNe Ia for our sample of ∼0.04 ± 0.01 and ∼0.10 ± 0.02, respectively, showing a 2.7σ difference between the two samples.
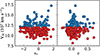 |
Fig. 10. Si II 6355 velocity plotted against SN light-curve parameters from SALT2, x1, and c. The blue circles represent 66 HV SN Ia and the red circles represent 191 NV SN Ia. All SN Ia in this plot are normal SNe Ia. |
We also investigated the relation amongst Si IIλ6355 velocity, Si II ratio, and light-curve width, x1 for normal SNe Ia (Fig. 11). A 3σ difference is found with HV SNe Ia, on average, tending to have smaller pEW ratios than NV SNe Ia, with weighted averages of the pEW of 0.117 ± 0.008 and 0.148 ± 0.005 for the HV and NV SNe Ia, respectively (shown as diamonds in Fig. 11). The Si II ratio is considered an indicator of the temperature of the line-forming region (Nugent et al. 1995; Hachinger et al. 2008). Harvey et al. (2024) estimated that around 40 per cent of SN Ia spectra between −5 d and peak have Si IIλ6355 high-velocity features that are blended with the photospheric components. While this will not change the photometric properties of the SNe Ia, it will result in larger Si IIλ6355 pEWs and higher average velocities for the SNe Ia where a high-velocity feature is present but not distinct from the photospheric component (also see Sect. 4.1.3). Harvey et al. (2024) did not however investigate the presence of Si HVFs in the Si IIλ5972 line and as such we cannot comment upon the resulting impact upon the Si II ratios. Harvey et al. (2024) found that high-velocity features in Si IIλ6355 were more common in SNe Ia with smaller x1 values. This suggests that the trend we observed, where HV SNe Ia tend to have smaller x1 values compared to NV SNe Ia, may be influenced by contributions from these high-velocity features.
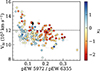 |
Fig. 11. Si IIλ6355 velocities plotted against the pEW ratio of Si II features, colour mapped with x1 for the normal SNe Ia in our sample. The black dashed line at vSi = 12 000 km s−1 marks the boundary between HV and NV SNe Ia on the plot. SNe Ia with velocities higher than 12 000 km s−1 are classified as HV SNe Ia, while those below are categorised as NV SNe Ia. The filled and empty black diamond represents the weighted average of HV SNe Ia and NV SNe Ia, respectively. |
We further inspected the light-curve properties of all the objects (not just normal events) in our sample. We compare the pEW of Si IIλ5972 and Si IIλ6355 with the SALT2 light-curve parameters, x1 and c in Fig. 12. We see a clear relation, similar to that of previous studies such as Nugent et al. (1995) and Hachinger et al. (2008), between the pEW of the Si IIλ5972 features and the light-curve width parameter, x1, where the 91bg-like, 86G-like, and the cool normal 04gs-like events, have on average faster declining light curves (x1 ≲ −2) than normal SNe Ia. The 99aa-like and 91T-like SNe Ia, populate the slower light-curve decline rate (x1 ≳ 0) regime with similar pEW of Si IIλ5972 to normal SNe Ia. Within the normal SNe Ia, a trend of SNe Ia with narrower light curves being slightly cooler than those with a broader one is also seen (visible also in Fig. 11). This trend is similar to what we already see for 86G-like and 99aa-like SNe Ia on the extremes. This trend is now also observed to be present as a gradient within the normal SNe Ia.
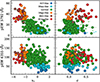 |
Fig. 12. Correlation between light-curve parameters and Si II pEW in SNe Ia. Top left: Light-curve parameter x1 from SALT2 plotted against the pEW of the Si IIλ5972 feature. The upper limits represent where actual calculations for Si IIλ6355 exist, but 5927 does not. Top right: Same plot as left, but for the light-curve parameter c from SALT2. Bottom left: x1 plotted against the pEW of the Si IIλ6355 feature. Bottom right: Same plot as bottom left, but for c. |
A similar correlation can also be seen between c and Si IIλ5972 feature (top right panel of Fig. 12). The colour c, on average is larger for 91bg-like SNe (weighted average c of 0.50 ± 0.04 compared to the 86G-like SNe (c of 0.35 ± 0.04) and the 04gs-like SNe Ia (c of 0.04 ± 0.02). 91T-like SN Ia are slightly redder (c of 0.14 ± 0.07) than 99aa-like SN Ia (c of 0.09 ± 0.04) but the number of 91T-like SNe Ia is low. No strong correlation between Si IIλ6355 and either x1 or c is seen (bottom panel of Fig. 12), apart from 99aa-like and 91T-like events having weaker pEW. This is likely due to the temperature having a more direct effect on the Si IIλ5972 than Si IIλ6355 line strengths (see Sect. 4.3).
The absolute peak magnitudes from SALT2 (corrected for Milky Way extinction) in the ZTF g-band are plotted against the pEW ratio of the Si II 5972–6355 Å features in Fig. 13. Only for this plot, we have removed normal SNe Ia with c values higher than 0.3 to remove highly reddened normal SNe Ia. 04gs-like SNe Ia are seen to be on average brighter (−18.55 ± 0.06 mag) than the 86G-like (−17.96 ± 0.11 mag) and 91bg-like (−17.25 ± 0.11 mag) events. As shown in Sect. 4.3 and in previous studies such as Hachinger et al. (2008), the pEW ratio of the Si II features is a good temperature indicator, with the Si IIλ5972 feature becoming more prominent when the temperature is lower. The absolute magnitude of an event directly relates to the amount of 56Ni produced in the explosion. Therefore, Fig. 13 shows that there is a strong relation between the mass of radioactive 56Ni and the temperature of the ejecta, with SNe with more 56Ni having hotter ejecta. However, from our TARDIS analysis in Sect. 4.3, temperature alone is insufficient to produce the combination of features seen in the spectra of SN 2004gs of weaker Ti II compared to 86G-like or 91bg-like events but a similar pEW ratio of the Si II 5972–6355 Å.
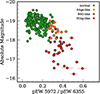 |
Fig. 13. Absolute g-band magnitudes of the volume limited ZTF DR2 SN Ia sample from SALT2 as a function of Si II ratios. All magnitudes are corrected for MW extinction. In this plot normal SNe Ia with a colour parameter (c) higher than 0.3 were excluded to remove highly reddened SNe Ia. |
5. Conclusions
In this work we presented a sub-sample of maximum-light spectra of 482 SNe Ia from the ZTF DR2 sample up to a redshift of 0.06. We investigated the spectral profiles of Si IIλ6355 and Si IIλ5972, and tested the template-matching accuracy of the DR2 spectral classifications. We provide the following summary of our conclusions:
-
We investigated the accuracy of the spectral-template matching and initial classifications and methods used for typing in 482 SNe Ia. After this manual inspection, we re-classified one SNe Ia with no sub-class (typed as Ia-unclear) as 91T-like; 12 Ia-unclearas 99a-like; and 10 Ia-unclearas normal. We also re-classified 9 91T-like SNe Ia as 99a-like and 2 91T-like SNe Ia as normal. Our classifications of 91T-like and 99aa-like SNe Ia are consistent with the classifications in Phillips et al. (2022). While 91T-like and 99aa-like SNe Ia are generally included in cosmology samples, there are studies (Scalzo et al. 2012; Yang et al. 2022; Chakraborty et al. 2024) suggesting that inclusion of these events might introduce a systematic bias. It is important to have a more accurate sub-class identification to help keep these cosmological samples of SNe Ia more homogeneous.
-
Host galaxy contamination in the SN Ia spectra is seen to have a considerable impact on sub-typing and spectral features, such as pseudo equivalent widths. No significant change in the velocities is seen. The galaxy contribution makes the SN Ia spectra appear redder and the strength of the features can become weaker. However, the minimum of the feature used to calculate the velocities is less affected.
-
Spectral template matching, such as SNID, still provides fast and reliable results for normal SN Ia. The rarer sub-types, on the other hand, need more detailed analysis and constraints from many spectral features such as Si II ratios, Ti II, O I, and Ca II NIR. These rarer sub-types are also less represented in training sets for spectral classifications codes.
-
Transitional 04gs-like events have a relatively high Si II ratio (suggesting cooler temperatures than normal SNe Ia) and weak Ti II absorption features. Using TARDIS modelling, we demonstrated that decreasing the temperature alone produces a good match to the S II ratio, but not to the Ti II feature. An increase in the Ti II abundance is also required to match its spectra. These events appear to lie between normal and sub-luminous SNe Ia, but are brighter than the standard transitional 86G-like events.
-
We assigned Branch sub-types to all SNe in our sample and studied the observed diversity from the spectral features. The normal to 91T-like transition, where 99aa-like SNe Ia are bridging the gap, is seen in terms of the pEW of Si IIλ6355. True 91T-like SNe Ia in our sample remain very rare.
-
We observed a strong correlation between x1 and the pEW of Si IIλ5972, with a clear transition in properties at ∼30 Å and x1 of around −2. All true 91T-like SNe Ia show positive x1 values; except for this, no other significant correlation is seen between the Si IIλ6355 feature and x1 and c. Especially for fainter objects, this is due to the Si IIλ6355 feature becoming saturated, while the Si IIλ5972 feature becomes more prominent due to the ionisation balance.
-
We found a trend among Si IIλ6355 velocity, Si II ratio, and x1 within the normal SNe Ia, showing that HV SNe Ia with lower pEW ratios tend to have faster declining light curves.
-
The absolute magnitude of SNe Ia follows a sequence as a function of the Si II pEW ratio for the sub-types. By investigating the faint normal SNe Ia, we show that this is likely caused by the different initial abundance profiles and temperature settings, which more directly correlates with the sub-types.
We emphasise that regardless of the underlying explosion mechanism and/or binary configuration, the continuity seen in both bright and faint SNe Ia persists, and we encourage that it be further quantified. Since only the peak spectra are investigated in this work, there is a possibility that even if there are several explosion mechanisms, they may all be showing similar properties, due to all being highly driven by 56Ni near the peak. Therefore, it is encouraged to obtain more early time spectra to investigate the ejecta properties that are more directly related to the explosion and late time spectra to investigate progenitor channels since the materials at this phase get optically thin. A forthcoming paper will present any effects coming from the host galaxies and their impact on our findings in current cosmological studies.
Data availability
Full Table A.1 is available at the CDS via anonymous ftp to cdsarc.cds.unistra.fr (130.79.128.5) or via https://cdsarc.cds.unistra.fr/viz-bin/cat/J/A+A/694/A9
Acknowledgments
Based on observations obtained with the Samuel Oschin Telescope 48-inch and the 60-inch Telescope at the Palomar Observatory as part of the Zwicky Transient Facility project. ZTF is supported by the National Science Foundation under Grants No. AST-1440341 and AST-2034437 and a collaboration including current partners Caltech, IPAC, the Weizmann Institute of Science, the Oskar Klein Center at Stockholm University, the University of Maryland, Deutsches Elektronen-Synchrotron and Humboldt University, the TANGO Consortium of Taiwan, the University of Wisconsin at Milwaukee, Trinity College Dublin, Lawrence Livermore National Laboratories, IN2P3, University of Warwick, Ruhr University Bochum, Northwestern University and former partners the University of Washington, Los Alamos National Laboratories, and Lawrence Berkeley National Laboratories. Operations are conducted by COO, IPAC, and UW. SED Machine is based upon work supported by the National Science Foundation under Grant No. 1106171. The ZTF forced-photometry service was funded under the Heising-Simons Foundation grant #12540303 (PI: Graham). This work was supported by the GROWTH project funded by the National Science Foundation under Grant No 1545949 (Kasliwal et al. 2019). Fritz (van der Walt et al. 2019; Coughlin et al. 2023) is used in this work. The Gordon and Betty Moore Foundation, through both the Data-Driven Investigator Program and a dedicated grant, provided critical funding for SkyPortal. UB, KM, GD, RS, MD, and JHT are supported by the H2020 European Research Council grant no. 758638. LH is funded by the Irish Research Council under grant number GOIPG/2020/1387. Y.-L.K. has received funding from the Science and Technology Facilities Council [grant number ST/V000713/1]. L.G. and T.E.M.B acknowledges financial support from the Spanish Ministerio de Ciencia e Innovación (MCIN) and the Agencia Estatal de Investigación (AEI) 10.13039/501100011033 under the PID2020-115253GA-I00 HOSTFLOWS project, from Centro Superior de Investigaciones Científicas (CSIC) under the PIE project 20215AT016, and the program Unidad de Excelencia María de Maeztu CEX2020-001058-M. L.G acknowledges financial support the Departament de Recerca i Universitats de la Generalitat de Catalunya through the 2021-SGR-01270 grant. T.E.M.B acknowledges financial support from the European Union Next Generation EU/PRTR funds under the 2021 Juan de la Cierva program FJC2021-047124-I. This project has received funding from the European Research Council (ERC) under the European Union’s Horizon 2020 research and innovation programme (grant agreement no 759194 - USNAC). This work has been supported by the research project grant “Understanding the Dynamic Universe” funded by the Knut and Alice Wallenberg Foundation under Dnr KAW 2018.0067. AG acknowledges support from Vetenskapsrådet, the Swedish Research Council, project 2020-03444. SD acknowledges support from the Marie Curie Individual Fellowship under grant ID 890695 and a Junior Research Fellowship at Lucy Cavendish College. This work has been supported by the Agence Nationale de la Recherche of the French government through the program ANR-21-CE31-0016-03.
References
- Amenouche, M., Rosnet, P., Smith, M., et al. 2025, A&A, 694, A3 (ZTF DR2 SI) [NASA ADS] [CrossRef] [EDP Sciences] [Google Scholar]
- Ashall, C., Mazzali, P. A., Pian, E., & James, P. A. 2016, MNRAS, 463, 1891 [NASA ADS] [CrossRef] [Google Scholar]
- Bellm, E. C., Kulkarni, S. R., Barlow, T., et al. 2019, PASP, 131, 068003 [Google Scholar]
- Benetti, S., Meikle, P., Stehle, M., et al. 2004, MNRAS, 348, 261 [CrossRef] [Google Scholar]
- Benetti, S., Cappellaro, E., Mazzali, P. A., et al. 2005, ApJ, 623, 1011 [NASA ADS] [CrossRef] [Google Scholar]
- Benetti, S., Cappellaro, E., Turatto, M., et al. 2006, ApJ, 653, L129 [NASA ADS] [CrossRef] [Google Scholar]
- Blagorodnova, N., Neill, J. D., Walters, R., et al. 2018, PASP, 130, 035003 [Google Scholar]
- Blondin, S., & Tonry, J. L. 2007, ApJ, 666, 1024 [NASA ADS] [CrossRef] [Google Scholar]
- Blondin, S., Dessart, L., Leibundgut, B., et al. 2006, AJ, 131, 1648 [NASA ADS] [CrossRef] [Google Scholar]
- Blondin, S., Matheson, T., Kirshner, R. P., et al. 2012, AJ, 143, 126 [NASA ADS] [CrossRef] [Google Scholar]
- Branch, D., Dang, L. C., Hall, N., et al. 2006, PASP, 118, 560 [NASA ADS] [CrossRef] [Google Scholar]
- Branch, D., Chau Dang, L., & Baron, E. 2009, PASP, 121, 238 [NASA ADS] [CrossRef] [Google Scholar]
- Burgaz, U., Maeda, K., Kalomeni, B., et al. 2021, MNRAS, 502, 4112 [NASA ADS] [CrossRef] [Google Scholar]
- Burrow, A., Baron, E., Ashall, C., et al. 2020, ApJ, 901, 154 [NASA ADS] [CrossRef] [Google Scholar]
- Chakraborty, S., Sadler, B., Hoeflich, P., et al. 2024, ApJ, 969, 80 [NASA ADS] [CrossRef] [Google Scholar]
- Chambers, K. C., Magnier, E. A., Metcalfe, N., et al. 2016, arXiv e-prints [arXiv:1612.05560] [Google Scholar]
- Childress, M. J., Scalzo, R. A., Sim, S. A., et al. 2013, ApJ, 770, 29 [NASA ADS] [CrossRef] [Google Scholar]
- Coughlin, M. W., Bloom, J. S., Nir, G., et al. 2023, ApJS, 267, 31 [NASA ADS] [CrossRef] [Google Scholar]
- Dekany, R., Smith, R. M., Riddle, R., et al. 2020, PASP, 132, 038001 [NASA ADS] [CrossRef] [Google Scholar]
- Dettman, K. G., Jha, S. W., Dai, M., et al. 2021, ApJ, 923, 267 [NASA ADS] [CrossRef] [Google Scholar]
- Dilday, B., Howell, D. A., Cenko, S. B., et al. 2012, Science, 337, 942 [NASA ADS] [CrossRef] [Google Scholar]
- Dimitriadis, G., Burgaz, U., Deckers, M., et al. 2025, A&A, 694, A10 (ZTF DR2 SI) [NASA ADS] [CrossRef] [EDP Sciences] [Google Scholar]
- Filippenko, A. V., Richmond, M. W., Matheson, T., et al. 1992a, ApJ, 384, L15 [CrossRef] [Google Scholar]
- Filippenko, A. V., Richmond, M. W., Branch, D., et al. 1992b, AJ, 104, 1543 [NASA ADS] [CrossRef] [Google Scholar]
- Filippenko, A. V., Li, W. D., & Leonard, D. C. 1999, IAU Circ., 7108, 2 [NASA ADS] [Google Scholar]
- Folatelli, G., Morrell, N., Phillips, M. M., et al. 2013, ApJ, 773, 53 [Google Scholar]
- Foley, R. J., & Kasen, D. 2011, ApJ, 729, 55 [Google Scholar]
- Gall, C., Stritzinger, M. D., Ashall, C., et al. 2018, A&A, 611, A58 [NASA ADS] [CrossRef] [EDP Sciences] [Google Scholar]
- Gallagher, J. S., Garnavich, P. M., Berlind, P., et al. 2005, ApJ, 634, 210 [NASA ADS] [CrossRef] [Google Scholar]
- Ganeshalingam, M., Li, W., & Filippenko, A. V. 2011, MNRAS, 416, 2607 [NASA ADS] [CrossRef] [Google Scholar]
- Ganeshalingam, M., Li, W., Filippenko, A. V., et al. 2012, ApJ, 751, 142 [NASA ADS] [CrossRef] [Google Scholar]
- Graham, M. J., Kulkarni, S. R., Bellm, E. C., et al. 2019, PASP, 131, 078001 [Google Scholar]
- Gupta, R. R., Kuhlmann, S., Kovacs, E., et al. 2016, AJ, 152, 154 [NASA ADS] [CrossRef] [Google Scholar]
- Guy, J., Astier, P., Baumont, S., et al. 2007, A&A, 466, 11 [NASA ADS] [CrossRef] [EDP Sciences] [Google Scholar]
- Hachinger, S., Mazzali, P. A., Tanaka, M., Hillebrandt, W., & Benetti, S. 2008, MNRAS, 389, 1087 [NASA ADS] [CrossRef] [Google Scholar]
- Hamuy, M., Phillips, M. M., Maza, J., et al. 1995, AJ, 109, 1 [NASA ADS] [CrossRef] [Google Scholar]
- Hamuy, M., Folatelli, G., Morrell, N. I., et al. 2006, PASP, 118, 2 [NASA ADS] [CrossRef] [Google Scholar]
- Harvey, L., Maguire, K., Magee, M. R., et al. 2023, MNRAS, 522, 4444 [NASA ADS] [CrossRef] [Google Scholar]
- Harvey, L., Maguire, K., Burgaz, U., et al. 2024, A&A, submitted (ZTF DR2 SI) [Google Scholar]
- Hatano, K., Branch, D., Fisher, A., Baron, E., & Filippenko, A. V. 1999, ApJ, 525, 881 [NASA ADS] [CrossRef] [Google Scholar]
- Howell, D. A., Sullivan, M., Nugent, P. E., et al. 2006, Nature, 443, 308 [Google Scholar]
- Hoyle, F., & Fowler, W. A. 1960, ApJ, 132, 565 [NASA ADS] [CrossRef] [Google Scholar]
- Hsiao, E. Y., Burns, C. R., Contreras, C., et al. 2015, A&A, 578, A9 [NASA ADS] [CrossRef] [EDP Sciences] [Google Scholar]
- Iben, I., Jr., & Tutukov, A. V. 1984, ApJS, 54, 335 [NASA ADS] [CrossRef] [Google Scholar]
- Kasliwal, M. M., Cannella, C., Bagdasaryan, A., et al. 2019, PASP, 131, 038003 [NASA ADS] [CrossRef] [Google Scholar]
- Kerzendorf, W. E., & Sim, S. A. 2014, MNRAS, 440, 387 [NASA ADS] [CrossRef] [Google Scholar]
- Kerzendorf, W., Sim, S., Vogl, C., et al. 2020, https://doi.org/10.5281/zenodo.3893940 [Google Scholar]
- Khokhlov, A. M. 1991, A&A, 245, 114 [NASA ADS] [Google Scholar]
- Kim, Y. L., Rigault, M., Neill, J. D., et al. 2022, PASP, 134, 024505 [NASA ADS] [CrossRef] [Google Scholar]
- Kinney, A. L., Calzetti, D., Bohlin, R. C., et al. 1996, ApJ, 467, 38 [NASA ADS] [CrossRef] [Google Scholar]
- Li, W., Filippenko, A. V., Chornock, R., et al. 2003, PASP, 115, 453 [Google Scholar]
- Maeda, K., & Terada, Y. 2016, IJMPD, 25, 1630024 [NASA ADS] [CrossRef] [Google Scholar]
- Maeda, K., Benetti, S., Stritzinger, M., et al. 2010, Nature, 466, 82 [NASA ADS] [CrossRef] [Google Scholar]
- Magee, M. R., Kotak, R., Sim, S. A., et al. 2016, A&A, 589, A89 [NASA ADS] [CrossRef] [EDP Sciences] [Google Scholar]
- Maguire, K., Sullivan, M., Pan, Y. C., et al. 2014, MNRAS, 444, 3258 [NASA ADS] [CrossRef] [Google Scholar]
- Maoz, D., Mannucci, F., & Nelemans, G. 2014, ARA&A, 52, 107 [Google Scholar]
- Masci, F. J., Laher, R. R., Rusholme, B., et al. 2019, PASP, 131, 018003 [Google Scholar]
- Morrell, N., Folatelli, G., & Hamuy, M. 2004, IAU Circ., 8453, 2 [NASA ADS] [Google Scholar]
- Nomoto, K., Thielemann, F. K., & Yokoi, K. 1984, ApJ, 286, 644 [Google Scholar]
- Nomoto, K., Iwamoto, K., & Kishimoto, N. 1997, Science, 276, 1378 [NASA ADS] [CrossRef] [Google Scholar]
- Nordin, J., Östman, L., Goobar, A., et al. 2011, A&A, 526, A119 [NASA ADS] [CrossRef] [EDP Sciences] [Google Scholar]
- Nugent, P., Phillips, M., Baron, E., Branch, D., & Hauschildt, P. 1995, ApJ, 455, L147 [NASA ADS] [CrossRef] [Google Scholar]
- Nugent, P. E., Sullivan, M., Cenko, S. B., et al. 2011, Nature, 480, 344 [NASA ADS] [CrossRef] [Google Scholar]
- O’Brien, J. T., Kerzendorf, W. E., Fullard, A., et al. 2021, ApJ, 916, L14 [CrossRef] [Google Scholar]
- O’Brien, J. T., Kerzendorf, W. E., Fullard, A., et al. 2024, ApJ, 964, 137 [CrossRef] [Google Scholar]
- Ogawa, M., Maeda, K., & Kawabata, M. 2023, ApJ, 955, 49 [NASA ADS] [CrossRef] [Google Scholar]
- Park, S., & Li, W. 2004, IAU Circ., 8453, 1 [NASA ADS] [Google Scholar]
- Perlmutter, S., Gabi, S., Goldhaber, G., et al. 1997, ApJ, 483, 565 [Google Scholar]
- Perlmutter, S., Aldering, G., Goldhaber, G., et al. 1999, ApJ, 517, 565 [Google Scholar]
- Phillips, M. M., Phillips, A. C., Heathcote, S. R., et al. 1987, PASP, 99, 592 [NASA ADS] [CrossRef] [Google Scholar]
- Phillips, M. M., Wells, L. A., Suntzeff, N. B., et al. 1992, AJ, 103, 1632 [NASA ADS] [CrossRef] [Google Scholar]
- Phillips, M. M., Ashall, C., Burns, C. R., et al. 2022, ApJ, 938, 47 [NASA ADS] [CrossRef] [Google Scholar]
- Pignata, G., Benetti, S., Mazzali, P. A., et al. 2008, MNRAS, 388, 971 [NASA ADS] [CrossRef] [Google Scholar]
- Quimby, R., Höflich, P., Kannappan, S. J., et al. 2006, ApJ, 636, 400 [NASA ADS] [CrossRef] [Google Scholar]
- Riess, A. G., Filippenko, A. V., Challis, P., et al. 1998, AJ, 116, 1009 [Google Scholar]
- Riess, A. G., Macri, L. M., Hoffmann, S. L., et al. 2016, ApJ, 826, 56 [Google Scholar]
- Rigault, M., Neill, J. D., Blagorodnova, N., et al. 2019, A&A, 627, A115 [NASA ADS] [CrossRef] [EDP Sciences] [Google Scholar]
- Rigault, M., Smith, M., Goobar, A., et al. 2025a, A&A, 694, A1 (ZTF DR2 SI) [NASA ADS] [CrossRef] [EDP Sciences] [Google Scholar]
- Rigault, M., Smith, M., Regnault, N., et al. 2025b, A&A, 694, A2 (ZTF DR2 SI) [NASA ADS] [CrossRef] [EDP Sciences] [Google Scholar]
- Röpke, F. K., Kromer, M., Seitenzahl, I. R., et al. 2012, ApJ, 750, L19 [CrossRef] [Google Scholar]
- Scalzo, R., Aldering, G., Antilogus, P., et al. 2012, ApJ, 757, 12 [NASA ADS] [CrossRef] [Google Scholar]
- Schlafly, E. F., & Finkbeiner, D. P. 2011, ApJ, 737, 103 [Google Scholar]
- Seitenzahl, I. R., Ciaraldi-Schoolmann, F., Röpke, F. K., et al. 2013, MNRAS, 429, 1156 [NASA ADS] [CrossRef] [Google Scholar]
- Senzel, R., Maguire, K., Burgaz, U., et al. 2025, A&A, 694, A14 (ZTF DR2 SI) [NASA ADS] [CrossRef] [EDP Sciences] [Google Scholar]
- Silverman, J. M., Vinkó, J., Marion, G. H., et al. 2015, MNRAS, 451, 1973 [CrossRef] [Google Scholar]
- Smith, M., Nichol, R. C., Dilday, B., et al. 2012, ApJ, 755, 61 [Google Scholar]
- Smith, M., Rigault, M., et al. 2025, A&A, in prep. (ZTF DR2 SI) [Google Scholar]
- Soumagnac, M. T., Nugent, P., Knop, R. A., et al. 2024, ApJS, 275, 22 [NASA ADS] [CrossRef] [Google Scholar]
- Srivastav, S., Smartt, S. J., Leloudas, G., et al. 2020, ApJ, 892, L24 [NASA ADS] [CrossRef] [Google Scholar]
- Stehle, M., Mazzali, P. A., Benetti, S., & Hillebrandt, W. 2005, MNRAS, 360, 1231 [NASA ADS] [CrossRef] [Google Scholar]
- Sullivan, M., Le Borgne, D., Pritchet, C. J., et al. 2006, ApJ, 648, 868 [NASA ADS] [CrossRef] [Google Scholar]
- van der Walt, S., Crellin-Quick, A., & Bloom, J. 2019, J. Open Source Softw., 4, 1247 [NASA ADS] [CrossRef] [Google Scholar]
- Wang, X., Li, W., Filippenko, A. V., et al. 2008, ApJ, 675, 626 [NASA ADS] [CrossRef] [Google Scholar]
- Wang, X., Li, W., Filippenko, A. V., et al. 2009a, ApJ, 697, 380 [NASA ADS] [CrossRef] [Google Scholar]
- Wang, X., Filippenko, A. V., Ganeshalingam, M., et al. 2009b, ApJ, 699, L139 [NASA ADS] [CrossRef] [Google Scholar]
- Wang, X., Wang, L., Filippenko, A. V., Zhang, T., & Zhao, X. 2013, Science, 340, 170 [NASA ADS] [CrossRef] [Google Scholar]
- Webbink, R. F. 1984, ApJ, 277, 355 [NASA ADS] [CrossRef] [Google Scholar]
- Whelan, J., & Iben, Icko 1973, J., ApJ, 186, 1007 [NASA ADS] [Google Scholar]
- Yang, J., Wang, L., Suntzeff, N., et al. 2022, ApJ, 938, 83 [NASA ADS] [CrossRef] [Google Scholar]
- Zhao, X., Maeda, K., Wang, X., & Sai, H. 2021, MNRAS, 503, 4667 [NASA ADS] [CrossRef] [Google Scholar]
Appendix A: Tables
Classification and spectroscopic properties of SNe Ia from the volume limited ZTF DR2 sample (extract).
All Tables
Classification and spectroscopic properties of SNe Ia from the volume limited ZTF DR2 sample (extract).
All Figures
|
Fig. 1. Redshift, phase, and SALT2 x1 distributions of the ZTF SN Ia sample. Left: Redshift distribution of the full ZTF SN Ia sample (grey dashed line, 2959 SNe Ia) with good light-curve coverage; the sample with a redshift limit at z ≤ 0.06 (blue dashed line, 1093 SNe Ia); and SNe Ia passing our other cuts that have a spectrum at −5 to 5 d with respect to maximum light (red solid line, 482 SNe Ia). Middle: Rest-frame phase distribution of all good light-curve coverage ZTF SNe Ia spectra at −5 to 5 d (grey) and with the redshift cut of z ≤ 0.06. Right: SALT2 x1 distribution of the ZTF SN Ia sample. |
| In the text | |
|
Fig. 2. Velocity (left), pEW (middle), and FWHM (right) of Si IIλ5972 (blue diamonds) and Si IIλ6355 (black circles) from the ZTF DR2 SN Ia sample as a function of rest-frame phases with respect to SALT2 maximum light. The black and blue dashed lines in the right panel represent the linear regression fits to the FWHM of Si IIλ6355 and Si IIλ5972, respectively. |
| In the text | |
|
Fig. 3. Examples of 91T-like (black) and 99aa-like (grey) maximum light spectra are shown compared to the labelled spectra of SN 1991T, SN 1999aa, and SN 2011fe at similar phases. The key features for identifying these SNe Ia are marked. Each spectrum has been corrected for MW extinction (Schlafly & Finkbeiner 2011). |
| In the text | |
|
Fig. 4. Sub-sample of 86G-like SN Ia spectra (shown in black) around maximum light are compared to those of SN 2004gs, SN 1986G, SN 1991bg, and SN 2011fe at similar phases. The key features identifying these SN Ia are shown. Each spectrum has been corrected for MW extinction. |
| In the text | |
|
Fig. 5. Sub-sample of 04gs-like (shown in black) ZTF DR2 SNe Ia around maximum light plotted with the spectra of SN 2004gs, SN 1986G, SN 1991bg, and SN 2011fe at similar phases for comparison. The key features identifying these SN Ia are shown in the figure. Each spectrum in the figure is corrected for MW extinction. |
| In the text | |
|
Fig. 6. Relationships between local surface brightness, dDLR, and Si IIλ6355 pEW for SN Ia sub-types. Left: Local surface brightness compared with the dDLR of volume limited ZTF DR2 sample. The fit shown with a black solid line on the plot is used to estimate a dDLR value (vertical dashed line) based on the chosen surface brightness magnitude of 20.1 mag (horizontal dotted line). Middle: Si IIλ6355 pEW plotted against velocity for three different sub-types of SNe Ia: 91T-like (represented by squares), 99aa-like (represented by diamonds), and normal (represented by circles). The data points for each SN sub-type are shown with increasing levels of host galaxy light contamination (25, 50, 75, and 100 per cent) from top to bottom. The different colours represent different galaxy types used to simulate the contamination effects. This allows for the comparison of how various galaxy types influence the measured Si IIλ6355 pEW for different SN sub-types and how the pEW is affected by increasing galaxy contamination. Right: Local surface brightness plotted against the pEW of Si IIλ6355 feature. The grey dotted line represents the equivalent value of dDLR where we applied our cut of dDLR = 0.2, based on the corresponding surface brightness magnitude of 20.1 mag. The red and blue dashed line represents the regression line fitted to all the data and the data with the dDLR cut, respectively. The red and blue shaded regions represent the confidence interval around the corresponding regression lines. A strong correlation between the pEW of Si IIλ6355 and local surface brightness and its effect on sub-typing is shown. |
| In the text | |
|
Fig. 7. Distribution of Si IIλ5972 and Si IIλ6355 pEW values across SN Ia sub-types. Left: pEW of Si IIλ5972 plotted against pEW of Si IIλ6355 based on sub-types of SNe Ia taken from Branch et al. (2006) for the 392 SNe Ia from the ZTF DR2 sample with dDLR greater than 0.2. Branch sub-type zones are shown with the black dashed lines following the limits from Folatelli et al. (2013), with SS for shallow silicon, CN for core normal, BL for broad line and CL for cool events. The filled circles in the different colours represent the SN Ia types. Upper limits shown in the plots are plotted as downward arrows (see Sect. 2.3). Right: Zoomed-in plot of the SS SN Ia region along with the histogram above the number of events of the 91T-like, 99aa-like, and normal SN Ia sub-types in this region, showing the transition from 91T-like (dark blue) to 99aa-like (cyan) to normal (green) with increasing pEW of Si IIλ6355. |
| In the text | |
|
Fig. 8. Pseudo equivalent widths of the Si IIλ6355 feature plotted against the velocity of the same line (vSi) near maximum light (−5 to 5 days). Where several measurements exist for a given SN in the phase range used, we selected the one closest to maximum light. The different colours represent the different sub-types used in this study. The green filled and open circles represent respectively the NV SNe Ia and HV SNe Ia within the normal SNe Ia in our sample. |
| In the text | |
|
Fig. 9. Effects of temperature and abundance variations in faint SNe Ia. Top: Custom model spectra created for SN 2021rhu compared to a +0.3 d relative to g-band peak spectrum of SN 2004gs (black solid line). Each colour represents a different temperature setting, while keeping the rest of the initial conditions as same. The spectra shown are normalised by their value at 4000 Å to better line up the Ti II and Si II features. It is seen that the varying temperature impacts the strength of the Si IIλ5972 features, but has no considerable impact on the Ti II feature. Bottom: Set of spectral configuration of the N100 model (red) and the custom model created for SN 2021rhu (dark blue). The ratio of each model mixed is shown next to each model spectrum (calculated in log space). The best match of SN 2004gs is with the 40:60 model, which implies that the abundances of the 04gs-like faint SNe Ia are between the transitional 86G-like and the normal SNe Ia. SN 2004gs is less luminous than SN 2021rhu and is slightly cooler, and therefore has a stronger Si IIλ5972 feature. |
| In the text | |
|
Fig. 10. Si II 6355 velocity plotted against SN light-curve parameters from SALT2, x1, and c. The blue circles represent 66 HV SN Ia and the red circles represent 191 NV SN Ia. All SN Ia in this plot are normal SNe Ia. |
| In the text | |
|
Fig. 11. Si IIλ6355 velocities plotted against the pEW ratio of Si II features, colour mapped with x1 for the normal SNe Ia in our sample. The black dashed line at vSi = 12 000 km s−1 marks the boundary between HV and NV SNe Ia on the plot. SNe Ia with velocities higher than 12 000 km s−1 are classified as HV SNe Ia, while those below are categorised as NV SNe Ia. The filled and empty black diamond represents the weighted average of HV SNe Ia and NV SNe Ia, respectively. |
| In the text | |
|
Fig. 12. Correlation between light-curve parameters and Si II pEW in SNe Ia. Top left: Light-curve parameter x1 from SALT2 plotted against the pEW of the Si IIλ5972 feature. The upper limits represent where actual calculations for Si IIλ6355 exist, but 5927 does not. Top right: Same plot as left, but for the light-curve parameter c from SALT2. Bottom left: x1 plotted against the pEW of the Si IIλ6355 feature. Bottom right: Same plot as bottom left, but for c. |
| In the text | |
|
Fig. 13. Absolute g-band magnitudes of the volume limited ZTF DR2 SN Ia sample from SALT2 as a function of Si II ratios. All magnitudes are corrected for MW extinction. In this plot normal SNe Ia with a colour parameter (c) higher than 0.3 were excluded to remove highly reddened SNe Ia. |
| In the text | |
Current usage metrics show cumulative count of Article Views (full-text article views including HTML views, PDF and ePub downloads, according to the available data) and Abstracts Views on Vision4Press platform.
Data correspond to usage on the plateform after 2015. The current usage metrics is available 48-96 hours after online publication and is updated daily on week days.
Initial download of the metrics may take a while.