Fig. 7.
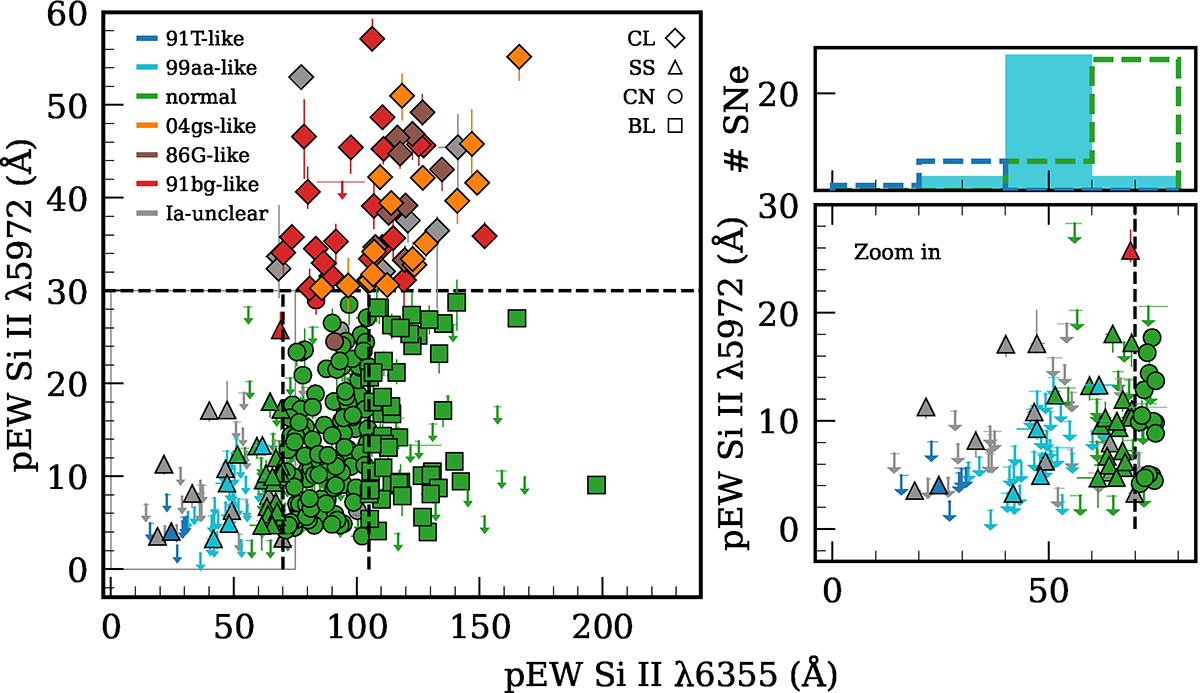
Download original image
Distribution of Si IIλ5972 and Si IIλ6355 pEW values across SN Ia sub-types. Left: pEW of Si IIλ5972 plotted against pEW of Si IIλ6355 based on sub-types of SNe Ia taken from Branch et al. (2006) for the 392 SNe Ia from the ZTF DR2 sample with dDLR greater than 0.2. Branch sub-type zones are shown with the black dashed lines following the limits from Folatelli et al. (2013), with SS for shallow silicon, CN for core normal, BL for broad line and CL for cool events. The filled circles in the different colours represent the SN Ia types. Upper limits shown in the plots are plotted as downward arrows (see Sect. 2.3). Right: Zoomed-in plot of the SS SN Ia region along with the histogram above the number of events of the 91T-like, 99aa-like, and normal SN Ia sub-types in this region, showing the transition from 91T-like (dark blue) to 99aa-like (cyan) to normal (green) with increasing pEW of Si IIλ6355.
Current usage metrics show cumulative count of Article Views (full-text article views including HTML views, PDF and ePub downloads, according to the available data) and Abstracts Views on Vision4Press platform.
Data correspond to usage on the plateform after 2015. The current usage metrics is available 48-96 hours after online publication and is updated daily on week days.
Initial download of the metrics may take a while.