| Issue |
A&A
Volume 694, February 2025
ZTF SN Ia DR2
|
|
|---|---|---|
| Article Number | A13 | |
| Number of page(s) | 12 | |
| Section | Extragalactic astronomy | |
| DOI | https://doi.org/10.1051/0004-6361/202452571 | |
| Published online | 14 February 2025 | |
ZTF SN Ia DR2: Properties of the low-mass host galaxies of Type Ia supernovae in a volume-limited sample
1
School of Physics, Trinity College Dublin, College Green, Dublin 2, Ireland
2
Department of Physics, Lancaster University, Lancs LA1 4YB, UK
3
Oskar Klein Centre, Department of Astronomy, Stockholm University, SE-10691 Stockholm, Sweden
4
Institute of Space Sciences (ICE, CSIC), Campus UAB, Carrer de Can Magrans, s/n, E-08193 Barcelona, Spain
5
Institut d’Estudis Espacials de Catalunya (IEEC), E-08034 Barcelona, Spain
6
Univ. Lyon, Univ. Claude Bernard Lyon 1, CNRS, IP2I Lyon/IN2P3, UMR 5822, F-69622 Villeurbanne, France
7
Oskar Klein Centre, Department of Physics, Stockholm University, SE-10691 Stockholm, Sweden
8
National Research Council of Canada, Herzberg Astronomy & Astrophysics Research Centre, 5071 West Saanich Road, Victoria, BC V9E 2E7, Canada
9
Institut für Physik, Humboldt-Universität zu Berlin, Newtonstr. 15, 12489 Berlin, Germany
10
Université Clermont Auvergne, CNRS/IN2P3, LPCA, F-63000 Clermont-Ferrand, France
11
Lawrence Berkeley National Laboratory, 1 Cyclotron Road, MS 50B-4206, Berkeley, CA 94720, USA
12
Department of Astronomy, University of California, Berkeley, 501 Campbell Hall, Berkeley, CA 94720, USA
13
Nordic Optical Telescope, Rambla José Ana Fernández Pérez 7, ES-38711 Breña Baja, Spain
14
Division of Physics, Mathematics and Astronomy, California Institute of Technology, Pasadena, CA 91125, USA
15
Caltech Optical Observatories, California Institute of Technology, Pasadena, CA 91125, USA
16
IPAC, California Institute of Technology, 1200 E. California Blvd Pasadena, CA 91125, USA
⋆ Corresponding author; This email address is being protected from spambots. You need JavaScript enabled to view it.
Received:
11
October
2024
Accepted:
10
December
2024
Abstract
In this study, we explore the characteristics of ‘low-mass’ (log(M⋆/M⊙) ≤ 8) and ‘intermediate-mass’ (8 < log(M⋆/M⊙) ≤ 10) host galaxies of Type Ia supernovae (SNe Ia) from the second data release (DR2) of the Zwicky Transient Facility survey. We investigated their correlations with different sub-types of SNe Ia. We used the photospheric velocities measured from the Si IIλ6355 feature, SALT2 light-curve stretch (x1), and host-galaxy properties of SNe Ia to re-investigate the existing relationship between host galaxy mass and Si IIλ6355 velocities. We also investigated sub-type preferences for host populations. We show that the more energetic and brighter 91T-like SNe Ia tend to reside among the younger host populations, while 91bg-like SNe Ia are found among the older populations. Our findings suggest that high-velocity SNe Ia (HV SNe Ia) do indeed come from older populations, but they can also come from young populations as well. Therefore, while our findings can partly provide support for HV SNe Ia in the context of single degenerate progenitor models, they indicate that HV SNe Ia (rather than comprising a different population) might be a continued distribution with different explosion mechanisms. Lastly, we investigate the specific rate of SNe Ia in the volume-limited SN Ia sample of DR2 and compare our results with other surveys.
Key words: supernovae: general
© The Authors 2025
 Open Access article, published by EDP Sciences, under the terms of the Creative Commons Attribution License (https://creativecommons.org/licenses/by/4.0), which permits unrestricted use, distribution, and reproduction in any medium, provided the original work is properly cited.
This article is published in open access under the Subscribe to Open model. This email address is being protected from spambots. You need JavaScript enabled to view it. to support open access publication.
1. Introduction
Type Ia supernovae (SNe Ia) are believed to be thermonuclear explosions of carbon-oxygen (C/O) white dwarfs (WDs, Hoyle & Fowler 1960). They play an important role in astronomy as standardisable candles and are used to measure the accelerating expansion of the Universe (Perlmutter et al. 1997, 1999; Riess et al. 1998, 2016; DES Collaboration 2024). Despite the standardizable nature of SNe Ia, the mechanisms behind their explosions and their progenitors are still not fully understood and there are potentially multiple explosion channels and mechanisms (Maoz et al. 2014; Maeda & Terada 2016; Liu et al. 2023). There are currently two commonly considered types of SN Ia progenitor models. In the single-degenerate (SD) model (Whelan & Iben 1973; Nomoto et al. 1997), a C/O WD accretes material from the companion star, which is either a non-degenerate main-sequence star or an evolved star, such as a red giant. The double-degenerate (DD) model involves the merging of two C/O WDs (Iben & Tutukov 1984; Webbink 1984). There are several evolutionary paths within the DD model that can lead to SN Ia explosions. An initial helium detonation could be triggered by the accumulation of a helium shell on top of the primary carbon-oxygen (CO) WD if the secondary WD is a He WD, which would lead to sub-Chandrasekhar-mass (MCh ≲ 1.2 M⊙) double-detonation scenario (Fink et al. 2007; Sim et al. 2010; Shen et al. 2018). In the past decades, numerical simulations have also explored the merger of two WDs, where a carbon detonation can be directly triggered by the interaction of the debris from the secondary WD with the primary WD, leading to the violent merger scenario (Raskin et al. 2009; Pakmor et al. 2013; Sato et al. 2015; Roy et al. 2022).
Several studies have tried to identify SN Ia progenitors and improve their cosmological use by examining the connections between the photometric properties (e.g. absolute magnitude, light curve width, colour, and Hubble residuals) and host galaxy properties, such as morphological type (Hamuy et al. 1996), offset from the host galaxy centre (Galbany et al. 2012), colour (Kelsey et al. 2021), star formation rate (SFR), and age (Gallagher et al. 2005; Howell et al. 2009; Rigault et al. 2013, 2020; Pan et al. 2014; Barkhudaryan et al. 2019; Hakobyan et al. 2020; Wiseman et al. 2023), along with stellar mass (Sullivan et al. 2010; Gupta et al. 2011; Childress et al. 2013; Pan et al. 2014) and metallicity (Gallagher et al. 2008; Pan et al. 2014). After applying standard corrections for light curve width and colour, we have observed that SNe Ia appear brighter in galaxies with higher stellar masses, compared to those in galaxies with lower stellar masses. SNe Ia with faster declining light curves are shown to prefer higher mass galaxies. It is also evident that galaxies with higher rates of star formation generally host brighter, slower SNe Ia than those with lower star formation activity, as in the case of passive galaxies.
The spectral properties of SNe Ia have also been suggested to correlate with their host galaxy properties. Wang et al. (2013) found that SNe Ia with Si IIλ6355 absorption feature velocities at maximum light ≳12 000 km s−1 are more likely to be found more centrally in their host galaxies, while SNe Ia with Si IIλ6355 velocities of < 12 000 km s−1 occur across a broader range of radial distances. Results from Pan et al. (2015) have indicated a trend amongst the HV and NV SNe Ia, where more massive galaxies host more SNe Ia with higher Si IIλ6355 velocities than SNe Ia with lower Si IIλ6355 velocities. This is further supported by future analysis, where they suggest that the main criterion for forming a HV SNe Ia is the metallicity of the host (Pan 2020, hereafter P20).
A trend between SN Ia rates and host galaxy stellar mass and star formation rate is observed in several studies (e.g. Sullivan et al. 2006; Li et al. 2011; Smith et al. 2012; Graur & Maoz 2013; Wiseman et al. 2021), where it has been shown that the specific SN Ia rate, which is defined as the total SN Ia rate scaled by the stellar mass of the galaxy, is considerably higher for lower mass more actively star-forming galaxies than for higher mass less actively star-forming galaxies. The delay-time distribution (DTD) is the rate of explosion of a SN Ia as a function of the time since a burst of star formation. It can provide constraints on the explosion mechanism. For example, SD scenarios struggle to match the observed rate of SNe Ia at long delay times, while DD scenarios under-predict the rate at short delay times (Wang & Han 2012; Maoz et al. 2014; Liu et al. 2023).
Brown et al. (2019) studied the specific rate of low-redshift SNe Ia from the All-Sky Automated Survey for Supernovae (ASAS-SN; Shappee et al. 2014; Kochanek et al. 2017) sample and by using the stellar mass function (SMF) presented in Bell et al. (2003). These authors showed that the specific SN Ia rate is roughly proportional to the inverse square root of stellar mass. Gandhi et al. (2022) presented a modified version of the ASASS-SN sample by converting the Bell et al. (2003) SMF to the SMF of Baldry et al. (2012), where they also used the measurements in the (Wiseman et al. 2021) coming from the Dark Energy Survey (DES; DES Collaboration 2016) and investigated the SMF dependence of the specific SN Ia rates.
Kistler et al. (2013) argued that the specific SN Ia rate’s dependence on stellar mass could be influenced by metallicity as lower-mass galaxies typically contain lower metallicity stars where these lower metallicity stars produce higher-mass white dwarfs, which are more prone to explosion than their higher metallicity counterparts. Gandhi et al. (2022) utilised FIRE−2 simulations to show that incorporating a SN Ia rate that scales inversely with metallicity (Z−0.5 to Z−1) enhances the match between simulated galactic stellar masses and observations.
It is known that a minor fraction of SNe takes place in either dwarf galaxies or globular clusters that are too dim to be observed, hence, they are considered to be ‘hostless’. While this case more commonly seen in super-luminous SNe (Gal-Yam 2012), since they tend to appear in faint dwarf galaxies, a small number of spectroscopically normal SNe Ia also appear hostless (Graham et al. 2015; Moon et al. 2021) or appear in very faint dwarf galaxies (Holoien et al. 2023). Restrictions on identifying and matching host galaxies could lead to falsely classifying SNe as hostless in large datasets (see Section 2.2 for further details on host galaxy identification and matching for the ZTF sample). In this study, we account for all these factors, identify the hostless SNe in our sample that are actually located in faint-undetected galaxies, and include them in our analysis.
In this paper, we present an analysis of the host galaxies from the Zwicky Transient Facility (ZTF) data release (DR2) SN Ia, obtained as part of the Zwicky Transient Facility survey from 2018–2020 (Bellm et al. 2019; Graham et al. 2019; Masci et al. 2019; Dekany et al. 2020). ZTF is an optical time-domain survey that has been in operation since 2018. The ZTF SN Ia DR2 sample contains 3628 spectroscopically confirmed SNe Ia (see Rigault et al. 2025a; Smith et al. 2025 for further details), without biases in terms of host-galaxy properties (i.e. massive galaxies were not specifically targeted). Most of the earlier studies are largely biased towards higher mass (higher luminosity) galaxies since they are easier to observe; hence, they are missing a considerable fraction of low-mass host galaxies. Here, we focus on SNe Ia in low mass hosts, including those without detected hosts (‘hostless’ SNe Ia). We discuss the broad sample selection, hostless SNe Ia, and the low-mass galaxies in our sample in Section 2. We present the results from our study and compare them with previous host galaxy studies in Section 3. Our conclusions are presented in Section 4.
2. Data and analysis
In this section, we discuss the data selection and analysis of our low-mass host galaxy sample from the ZTF SN Ia DR2. Section 2.1 describes our low-mass sample selection based on photometric and spectroscopic properties, while Section 2.2 details the host galaxy selection criteria. In Section 2.3, we present the hostless SNe Ia from the ZTF SN Ia DR2 sample.
2.1. ZTF DR2 SN Ia data
There are 3628 spectroscopically confirmed SNe Ia events are released as part of the ZTF DR2 sample (see Rigault et al. 2025a; Smith et al. 2025 for more details). We make a number of cuts to this sample to obtain our final sample for analysis, which are detailed in Table 1 to show how we arrive at our final sample. The ZTF DR2 SNe Ia sample is volume-limited and unbiased up to redshift (z) ≤0.06, with key parameters such as stretch, colour, and peak magnitude accurately reflecting their intrinsic distributions. Simulations by Amenouche et al. (2025) demonstrated that the sample is complete for non-peculiar SNe Ia at redshift (z) ≤0.06, which is supported by the colour distribution (Ginolin et al. 2025) that is aligned with the intrinsic properties of the population, as confirmed by KS tests with an approximately 2-sigma confidence level. Hence, we only consider this spectroscopically-complete sample of SNe Ia in this work. This cut is made to ensure that we can accurately determine the rates of SNe Ia across different galaxy types.
Summary of the cuts applied to obtain the final sample.
The next cut we apply is remove SNe Ia that are spectroscopically classified as peculiar. The spectral classifications used to sub-type the SNe Ia in this analysis come from two sources. For the SNe Ia with peak (−5 d ≤ t0 ≤ 5 d) spectra, where t0 is the time of peak, we used the sub-types of Burgaz et al. (2025). For the rest of the sample, we took the sub-types from Dimitriadis et al. (2025). While both sub-type classifications are self consistent, Dimitriadis et al. (2025) lacks 04gs-like and 86G-like classifications. Therefore, for the spectra outside the peak range we estimate we could have approximately 13 04gs-like and 14 86G-like SNe Ia (estimated from scaling the peak sample to the full sample) that could be misclassified as a normal SNe Ia. These classifications are based on visual inspection as well as investigation of the properties of their main spectral features, including velocity, pseudo-equivalent width (pEW). The peculiar sub-types that were excluded include ‘Ia-CSM’, ‘Iax’, ‘03fg-like’, ‘02es-like’, ‘00cx-like’, and ‘18byg-like’ SNe Ia. This removed 49 SNe Ia from our sample. We still considered 91T-like, 99aa-like, 04gs-like, 86G-like and 91bg-like sub-types (Burgaz et al. 2025). The ‘Ia-unclear’ sub-type refers to SNe Ia where detailed investigations did not reveal a confident sub-type and we see a similar distribution in each mass bin in the low mass regions. This sub-type also includes those classified after post peak brightness.
There are 18 SNe Ia in the ZTF DR2 sample for which the host galaxy masses have not been calculated. Eight have potential host galaxies with higher Directional Light Radius (dDLR; Sullivan et al. 2006; Smith et al. 2012; Gupta et al. 2016) matches, ranging from 7.1 to 14. These were excluded since the criterion to match a host galaxy was to have a dDLR of less than 7 (Smith et al. 2025). Five are located in clusters, making it impossible to determine the actual host galaxy. Detailed host galaxy associations are discussed briefly in Section 2.2 and in detail in Smith et al. (2025). While we discuss about the six truly hostless SNe Ia in Section 2.3, we excluded the remaining 12 SNe Ia (corresponding to less than 1% of the sample) from our studies. This results in a final sample of 1523 SNe Ia that we consider in this work.
In some cases, we sought to compare the host galaxy properties to their light curve parameters. Therefore, we also can apply a cut based on the quality of the light curves so that we have a sub-sample with reliable SALT2 light curve (Guy et al. 2007) parameters. These cuts follow those of the DR2 sample (Rigault et al. 2025a), which require each SN to have a minimum of two detections in two different filters (both pre- and post-maximum light relative to the time of maximum light, t0) and a total of at least seven detections across all filters. In this work, we use the light curve parameters (x1, c) from Smith et al. (2025), in which the values were calculated with the SALT2 version published by Taylor et al. (2021), only considering the −10 to +40 days in the rest-frame phase range, as suggested by Rigault et al. (2025b). While some of the analysis in this work has not required a phase cut, when we compare the host galaxy properties to their spectroscopic properties we use a phase cut of −5 d ≤ t0 ≤ 5 d to study the sample at peak brightness. Table 1 shows all the criteria used to define the final sample along with the number of remaining SNe Ia after each cut.
The velocities and pEWs of the Si IIλ5972 and Si IIλ6355 features for the volume-limited ZTF DR2 SN Ia sample in maximum light (−5 d ≤ t0 ≤ 5 d) are calculated and presented in Burgaz et al. (2025). The majority of the optical spectra comes from the low-resolution integral field spectrograph, SED machine (SEDm, Blagorodnova et al. 2018; Rigault et al. 2019; Kim et al. 2022) on the 60-inch telescope at the Mount Palomar observatory. A detailed methodology and selection criteria for the sample is presented in Burgaz et al. (2025).
In the ZTF DR2 SN Ia sample, the redshifts come from three different sources: (i) a catalogue redshift, where the redshift of the galaxy is known from SIMBAD, NASA extra-galactic database (NED), Sloan Digital Sky Survey (SDSS) DR 17 (Abdurro’uf et al. 2022), or the Dark Energy Spectroscopic Instrument (DESI) through the Mosthost program (Soumagnac et al. 2024; ii) galaxy features in the SN spectra; or (iii) where no redshift information exists, a template-matching SNID was used to estimate the redshift.
2.2. ZTF DR2 host galaxy data
The method used to identify the host galaxies of the ZTF SN Ia DR2 sample, along with the calculation process for the host galaxy properties are presented in Smith et al. (2025). Briefly, the first step was to obtain the 100 kpc radius images (centered on the SN location) from the Legacy Imaging Survey DR9 (LS; Dey et al. 2019), SDSS DR17, and Pan-STARRS DR2 (PS1; Chambers et al. 2016) (in given priority order). The next step involved applying the software package Host_Phot (Müller-Bravo & Galbany 2022) to the PS1 images to obtain the Kron fluxes. In this process dDLR for each SN is also calculated. A cut-off of dDLR < 7 is chosen to associate possible host galaxies, where more than one possible galaxy exist the source with smaller dDLR is chosen as the host galaxy. Smith et al. (2025) also calculated the stellar galaxy masses from both the method of Taylor et al. (2011) and PÉGASE.2 (Fioc & Rocca-Volmerange 1997). Both methods, especially with respect to the higher masses produce similar results. The masses calculated with PÉGASE.2 are used throughout this paper.
2.3. Hostless SNe Ia
There are six SNe Ia in the our sample that were not associated with any host galaxy in the DR2 and we label these as ‘hostless’. This is an observed naming convention since each SNe Ia will occur in a host galaxy of some mass. The observational occurence of these ‘hostless’ SNe Ia in our sample is 0.39%. We visually inspected the PS1 r-band images that spans over 125 kpc for each potentially hostless SNe Ia. Figure 1 shows the location and the surroundings of these SNe Ia. No candidate galaxy could be identified for five of the six SNe Ia. For SN 2020rzx, a diffuse source at the detection limit of PS1 can be seen at 3 kpc away from the SN location. However, there are no photometric measurements available in the PS1 database for this object. Host_Phot did not return any flux from the images either.
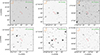 |
Fig. 1. Hostless SNe Ia from the volume-limited ZTF DR2 sample. All SNe presented in this plot are investigated for potential host galaxies within a search radius of 125 kpc and each image shown here spans 125 kpc scaled from the corresponding SN redshift for a clear visualisation. |
We used the limiting magnitudes of the PS1 survey g- and i-band images to calculate the absolute magnitude limits and upper limits of the stellar galaxy masses for each of the six SNe Ia. To obtain the most conservative absolute magnitudes and mass limits, we used the upper bound of the redshift uncertainty for each event as the redshift when calculating the mass. For SN 2020lmd, the redshift is quite uncertain (0.011 ≤ z ≤ 0.018) because of the presence of a prominent high-velocity component in its Si IIλ6355 feature. This results in reasonable SNID (Blondin & Tonry 2007) spectral template matches at a broad range of redshifts (0.011 ≤ z ≤ 0.018), leading to an upper limit of log(M⋆/M⊙) = 6.0. In Table 2, we present the photometric properties of each hostless SN Ia, along with the limits of their host galaxy properties. In terms of spectral sub-typing, three of the hostless SNe are classified as normal, one as 99aa-like and remaining two as Ia-unclear, meaning that a robust sub-classification could not be made (see Dimitriadis et al. 2025; Burgaz et al. 2025 for more details).
Properties of the hostless SNe Ia from the volume-limited ZTF DR2 SN Ia sample.
To attempt to explain why we not identify host galaxies for these relatively nearby (z ≤ 0.06) SNe Ia, we investigated their locations relative to the Galactic plane and their Galactic extinction values. In Fig. 2, we show the Galactic latitude for each SN Ia in our sample against the host stellar mass, with the value of AV shown as a colour bar. Four out of our six hostless SNe Ia are located within 15° of the Galactic plane and exhibit high extinction values, with AV reaching up to 2.18 mag. This may push any faint host galaxy beyond the detection limit of the PS1 survey. Generally, ZTF focuses on regions of higher Galactic latitude because of the increased extinction towards the plane.
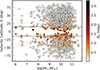 |
Fig. 2. Galactic latitudes plotted against the stellar masses from the ZTF DR2 volume limited (z ≤ 0.06) sample, colour-mapped with the MW extinction (AV). The filled circles represent the sample with a measured stellar galaxy mass and triangles represent the estimated upper limits of the 6 hostless SNe. Dashed black lines show +15 and −15° in the Galactic latitude. |
The two remaining hostless events (SNe 2020rzx and 2020lyt) that are at 18.8 and 29.8 deg from the Galactic plane have AV values of 0.64 and 0.15 mag, respectively. SN 2020rzx is the one hostless event, where a potential source was detected in the PS1 images. Although the extinction towards SN 2020lyt is not particularly high (the mean of the ZTF is 0.23 mag), there is also a bright star located around at 21 arcsec distance from SN 2020lyt, which also could potentially conceal a faint host galaxy. Therefore, we conclude that relatively high values of extinction is the most plausible reason for no host being detected for these SNe Ia. We included these SNe Ia in our further analysis, but with upper limits on their host galaxy properties.
3. Results and discussions
In Section 3.2, we present the connection between the galaxy masses of SNe Ia and their SALT2 light curve properties. We investigate the relation between the Si IIλ6355 velocities of SNe Ia and host galaxy masses in Section 3.3. In Section 3.4, we compare the properties of our peak sample to the sample from Pan (2020) based on the parent sample of Pan et al. (2015) and present our findings. In Section 3.5, we present the specific SN Ia rates and compare the specific ZTF DR2 SN Ia rate with previous studies.
3.1. Low-mass galaxies of ZTF DR2 SN Ia
Investigation of 1523 SNe Ia in the ZTF DR2 that pass our cuts (Table 1) results in 52 SNe Ia with log(M⋆/M⊙) ≤ 8, along with the six ‘hostless’ SNe Ia for which upper limits exist (Table 2). Figure 3 shows the mass distribution of the volume-limited ZTF DR2 sample, highlighting the 52 low-mass host galaxies (log(M⋆/M⊙) ≤ 8), and the six upper limits for hostless events. This reveals that the occurrence rate of SN Ia in low mass galaxies, including the hostless ones, is ∼3%, making the ZTF DR2 sample the largest collection of low mass galaxies with spectroscopically confirmed SN Ia in the literature. Brown et al. (2019) investigated 476 SNe Ia host galaxies from the All-Sky Automated Survey for Supernova (ASAS-SN) Bright Supernova Catalogues, where in their sample the occurrence rate of SN Ia in low mass galaxies is also ∼3%, representing 13 galaxies.
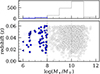 |
Fig. 3. Host galaxy masses in the ZTF DR2 volume limited (z ≤ 0.06) sample. Blue solid circles are the ‘low-mass’ galaxies where log(M⋆/M⊙) ≤ 8. Blue triangles represent the estimated upper limits of the six hostless SNe. The upper histogram shows the distributions of the stellar galaxy masses in mass bins. |
In our sample, 37 out of 52 SNe Ia in the low mass galaxies have good light curve coverage and, hence, reliable light-curve properties such as SALT2 x1 and c were obtained. Overall, 16 out 52 SNe Ia in the ‘low-mass’ galaxies also have peak (−5 d ≤ t0 ≤ 5 d) spectral coverage.
In the low-mass region (log(M⋆/M⊙) ≤ 8), the population is mainly dominated by normal SN Ia (38 SN Ia), along with three 91T-like SN Ia, two 99aa-like SN Ia, and nine Ia-unclear cases, where the available spectra are mostly only late-time (more than 15 days after maximum light) and five of the unclear cases are without good light curve coverage. There are no sub-luminous sub-types (04gs-like, 86G-like or 91bg-like) found in this lowest mass bin. Below log(M⋆/M⊙) of 7, there are 16 events (including six hostless events), of which ten are normal SNe Ia, one 99aa-like SN Ia, and five are Ia-unclear.
Previous studies have found a preference for 91T-like events to occur in star-forming host galaxies (Hamuy et al. 1996). There is a higher percentage of overluminous 91T-like and 99aa-like events in the low and intermediate mass bins in our sample relative to the total SN Ia sample. However, there are 91T-like and 99a-like SNe Ia found with log(M⋆/M⊙) of 6.5 to 11. The total number of SNe Ia in the log(M⋆/M⊙) ≤ 7 mass bin is low overall so the lack of any of these events is likely due to low number statistics but in the highest mass bin (log(M⋆/M⊙) ≥ 11), there appears to be an intrinsic preference for these sub-classes of SNe Ia not to occur.
3.2. Connection with SALT2 light curve properties
In Fig. 4, we compare the SALT2 light-curve parameter, x1, against the host galaxy stellar mass, colour-coded by the spectral classification of each SN Ia. The relative percentage of sub-types in each mass bin is also shown as a histogram. We split the sample into three broad mass regions, ‘low mass’ (log(M⋆/M⊙) ≤ 8), ‘intermediate mass’ (8 < log(M⋆/M⊙) ≤ 10), and ‘high mass’ (log(M⋆/M⊙) > 10).
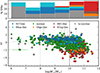 |
Fig. 4. Stellar galaxy masses plotted against the SALT2 x1 parameter for the good light-curve coverage sample of the volume-limited sample of ZTF DR 2 SN Ia (1106 SNe Ia, including the six hostless SNe Ia). A relative percentage of sub-types in each mass bin is plotted as a histogram above the figure and the cumulative occurrence of these types is illustrated as additive. The distribution of the sub-type normal is excluded where it is mostly constant in each mass bin with a range of (65−77%). Different colours of circles, represent different sub-types used in this study. For the selection of sub-type methods, we refer to Sect. 3.2. The gray and black dashed line represents the separation for the low, intermediate, and high stellar galaxy masses. |
As expected, the 91T-like/99aa-like SNe Ia primarily have high x1 values, indicating a slower decline rate in their light-curve evolution. However, two 99aa-like SNe Ia, namely: SN 2020hll (ZTF18aarikzk) and SN 2020adka (ZTF20acywefl), and one 91T-like SN Ia, namely: SN 2020ctr (ZTF19aaklqod) show lower x1 values than typically seen for these sub-classes with values of −2.4 ± 0.1, −1.1 ± 0.1, and −1.7 ± 0.1, respectively. The weighted means of x1 for 91T-like SNe Ia and 99aa-like SNe Ia in our sample (excluding the three unusual cases) are 0.72 ± 0.06 and 0.35 ± 0.10, respectively.
SN 2020hll and SN 2020adka are classified as a 99aa-like event based on their Si IIλ6355 pEW values of ∼50 and 53 Å around peak light, respectively. However, SN 2020hll happened very close to the host galaxy center (dDLR = 0.16) and the quite reddened spectra of SN 2020adka is also dominated by galaxy light. The 91T-like SN is also heavily effected by host light (dDLR = 0.1). The impact of host galaxy light on SN spectra, discussed in Burgaz et al. (2025), highlights that it can lead to lower pEW values and potentially incorrect sub-typing, where typical increases in pEW for the 99aa-like SNe would be around 10 to 20 Å, which could push the classification of these SNe to normal.
The percentage of ‘normal’ SNe Ia in each mass bin of Fig. 4 is similar (in the range of 65−77%). For the high-mass bins, we notice an increase in the Ia-unclear sub-type and this is potentially due to the galaxies being brighter and SN Ia light being suppressed. This is discussed in detail in Burgaz et al. (2025), where it is clear that both galaxy light in SN Ia spectra and the distance of the explosion to the host galaxy location directly effects the sub-typing.
On the faint end of normal SN Ia such as 04gs-like, transitional 86G-like and under-luminous 91bg-like SN Ia are observed to preferentially occur in higher mass galaxies, with none observed in a galaxy below log(M⋆/M⊙) of 9. This preference for higher mass hosts is in agreement with previous studies (Howell 2001; Sullivan et al. 2006; Graur et al. 2017; Wiseman et al. 2021). The mean stellar galaxy masses of 04gs-like, 86G-like, and 91bg-like objects in our sample are 10.66 ± 0.09, 10.48 ± 0.19, and 10.51 ± 0.10, respectively. We see a clear increase in the percentage of 04gs-like, 86G-like, and 91bg-like events with increasing stellar galaxy mass, with ∼30% of SNe Ia occurring in galaxies with log(M⋆/M⊙) ≥ 11 being of these sub-classes. Three 91bg-like events, SN 2020abmg (ZTF20acuoacn), SN 2018hls (ZTF18acefgoc), and SN 2018bef (ZTF18aaodnxt) in our sample show higher x1 values than typically seen for this sub-class with values of −0.5 ± 0.2, −0.1 ± 0.2, 0.2 ± 0.2. The weighted mean of x1 for 91bg-like SNe Ia Ia in our sample (excluding the three unusual cases) is −2.37 ± 0.12. The x1 and stellar galaxy mass relationship for non-peculiar SNe Ia is studied in detail in Ginolin et al. (2024).
The top panel of Fig. 4 illustrates the relative percentages of different sub-types within each mass bin for the sample with good light-curve coverage (comprising 1106 SNe Ia). To assess whether the light-curve coverage cut influences the distribution of sub-types, we also analyzed the full sample of 1523 SNe Ia. The resulting distributions were found to be similar, agreeing within the uncertainties.
3.3. Connection with Si II velocity
In this section, we investigate the relation between the diversity of the velocity of the Si IIλ6355 feature for SNe Ia exploding in different galaxy environments. In Fig. 5, we show the Si IIλ6355 velocities against the galaxy stellar masses for the SNe Ia in our sample, separated into spectroscopic or template-matched redshift sources (see Section 2.1). These events are limited to those around maximum light (−5 to 5 d) when a comparison can be made between their velocities. A significant portion (69%) of SNe Ia in ‘low-mass’ galaxies in our peak light sample do not have spectroscopic redshifts, consistent with the observational challenges posed by these fainter systems, which make them more difficult to observe and obtain reliable spectroscopic measurements. In intermediate-mass galaxies, the proportion of SNe without spectroscopic redshifts drops to 33%, and in high-mass galaxies, this ratio decreases further to 9%.
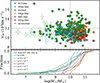 |
Fig. 5. Si IIλ6355 velocities, taken from Burgaz et al. (2025) plotted against the stellar galaxy masses of the volume-limited ZTF DR2 SN Ia sample for 477 SNe Ia spectra with a phase range of −5 d ≤ t0 ≤ 5 d. Filled and empty circles represents the SNe Ia with known redshift sources and SNID template matched sources, respectively. The horizontal black dashed line represents the value of Si IIλ6355 velocity used to separate the sample into HV and NV events for the normal SNe Ia (HV/NV can only be defined for normal SNe Ia). The vertical dashed line represents the standard value (1010 M⊙) for separating high- and low-mass host galaxies. The bottom histograms show the cumulative fractions of the host galaxy masses for each sub-type and the full peak sample. The p-values shown are derived from two-sample K-S tests using normal SNe Ia as the reference. |
A classification scheme mainly based on the Si IIλ6355 velocity was introduced by Wang et al. (2009) by investigating the velocity distribution of ‘normal’ SNe Ia, where SNe with vSi < 12 000 km s−1 are classified as normal velocity (NV) SN Ia and SNe with vSi ≳ 12 000 km s−1 are classified as high-velocity (HV) SN Ia. We note that this classification only applies to normal SNe Ia, and all other sub-types, including the ‘Ia-unclear’, should not be considered.
In Fig. 5, for those SNe Ia with Si IIλ6355 velocity measurements around peak light, we do not see as many 91T-like SNe Ia in the low-mass galaxies as in Fig. 4 for those with reliable light curves. A possible explanation for this could be that since the 91T-like events are brighter, they are possibly picked-up in earlier phases and the classifications were done before the maximum light phase range.
The impact of host galaxy contamination on the measured Si IIλ6355 velocities is not negligible Burgaz et al. (2025), with decreases in the Si IIλ6355 velocities of up to 500 km s−1 measured for SN Ia spectra when host galaxy contamination is increased. The dDLR (the offset of the SN location scaled by the galaxy size) can be used as a proxy for host galaxy contamination since more centrally located SNe Ia are more heavily impacted by the underlying galaxy light. In this work, we investigate the impact of host galaxy contamination through the dDLR measurements on the velocities of both the HV and NV SN Ia samples. In Fig. 6, we show the host galaxy stellar mass against the dDLR of each of the normal SNe Ia in our sample split into HV and NV events. The data points are colour-coded based on the global rest-frame g − z host colours (Smith et al. 2025).
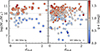 |
Fig. 6. dDLR distribution of the ‘normal’ SNe Ia are presented as a function of stellar galaxy masses, colour-mapped according to the global g − z rest-frame colours. Circles and squares represent NV and HV SNe Ia, respectively. Dashed horizontal line represent the separation of high mass and low mass galaxies at (log(M⋆/M⊙) = 10). There are eight NV SNe Ia with higher dDLR values that are excluded from the plot to provide a clearer comparison between the two sub-types within the lower dDLR ranges. |
We do not identify any difference between the distribution of dDLR among the HV and NV sub-types (Fig. 6). The ratio of HV to NV SNe Ia in 0.5 dDLR bins remains the same up to dDLR ∼ 2, with a constant ratio of ∼30% HV to NV events between dDLR of 0 and 2. A KS test for the dDLR distribution between the HV and NV SNe Ia also yields a high p value of 0.85, meaning both classes will be affected similarly by any host galaxy contamination. Although there are no HV SNe Ia with dDLR values exceeding 2.4, the sample includes 8 NV SNe Ia with dDLR values above this threshold. It can also be seen that both HV SNe Ia and NV SNe Ia exhibit similar behavior in terms of rest-frame colour distribution in both low and high mass host galaxies. There is only one HV SNe Ia in the ‘low-mass’ bin of our sample and it is with a higher value of dDLR = 1.9. The rest of the ‘low-mass’ galaxies are with NV SNe Ia at smaller dDLR. However, within the NV SN Ia sample, the ‘low-mass’ and ‘intermediate-mass’ samples have marginally higher mean dDLR of 0.89 ± 0.18 and 0.94 ± 0.09, respectively, than the mean dDLR of the ‘high-mass’ counterpart (0.79 ± 0.06). In summary, we interpret these results to mean that any difference in velocity between HV and NV sub-samples is not driven by the impact of host galaxy contamination and this diversity is an intrinsic property of normal SNe Ia.
3.4. Comparison with other galaxy samples
The results of Pan et al. (2014) and P20 suggest a trend where more massive galaxies host more HV SNe Ia compared to low-mass host galaxies. In this section, we compare the distribution of Si IIλ6355 velocity versus stellar galaxy masses of our sample to those presented by P20, which used the galaxy stellar masses of Pan et al. (2014). Since our sample and theirs have different initial selection criteria, we first bring our sample down to a phase range of −3 d ≤ t0 ≤ 3 d to match the phase range of P20, which drops the sample size to 186 SNe. 45 out 186 SNe in our sample have their redshifts estimated with SNID template matching. In the P20 sample, only sources with spectroscopic redshifts were used. To investigate potential selection bias, we conducted our analysis both by including and excluding the 45 template-matched sources. This is meant to help determine if the inclusion of these sources affects our results. We disregarded all non-PTF SNe Ia to remove any selection bias from the sample of P20 and cut the SN Ia at higher redshift than the ZTF DR2 volume-limited redshift of z ≤ 0.06, which drops the final sample of P20 to 37 SNe Ia.
The resulting redshift distribution of our sample in terms of Si IIλ6355 velocity is compared to that of P20 in the left hand panels of Fig. 7. The two distributions are found to be similar with a KS test between the two samples having a high p-value of 0.28 and 0.09 for the 45 template-matched sources excluded and included, respectively, suggesting in both cases the ZTF and P20 samples are likely to be coming from the same distribution. However, it can be seen that our sample has more HV SNe Ia at higher redshift than the P20 sample. We only have one HV SNe up to the redshift of 0.02 in our sample. Between the redshift of 0.02 to 0.03, the ratio of HV to NV SNe Ia for the ZTF sample is ∼70%. Similarly, between the redshift of 0.03 to 0.04, the ratio is ∼60. Above this, we start to have fewer HV SNe Ia and the ratio changes to around ∼35% for the redshift between 0.04 to 0.05, for the last redshift bin of 0.05 to 0.06, the ratio drops ∼24%. The ratio indeed drops in the last bin, however it is still consistent with the previous bins within the uncertainties. A linear line fit to the data shows that the significance of the slope is inconsistent with zero slope at 2σ level. We note that this two-sigma significance is derived from the sample with [ − 3 : 3] days phase range. The significance drops to 1.5σ for sample with [ − 5 : 5] days phase range. Therefore, in this analysis, we do not notice a significant change in the relative ratio of HV to NV SNe Ia, unlike P20. We note that our sample is limited to a redshift up to 0.06 and whether the current relative ratio of HV to NV SNe Ia holds at higher redshifts needs to be investigated.
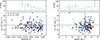 |
Fig. 7. Si IIλ6355 velocities as a function of redshift and host galaxy stellar mass. Left: Si IIλ6355 velocities plotted against the redshift. Right: Si IIλ6355 velocities plotted against the stellar galaxy masses. In both plots, blue filled and unfilled circles represent the volume-limited ZTF DR2 SN Ia sample adjusted to match the selection criteria of P20 with known and template matched redshift sources within 3 days since peak brightness, respectively. Red circles represent the P20 sample with only PTF sources and matched to the redshift range of the volume-limited ZTF DR2 SN Ia sample, (z ≤ 0.06). The horizontal black dashed line represents the value of Si IIλ6355 velocity used to separate the sample into HV and NV SN Ia. The vertical dashed line represents the typical high-low host galaxy mass separation value. Histograms of the distributions are shown in the top panels for the corresponding plots underneath. In these plots, the unfilled bars represent the ratio of HV SNe Ia to NV SNe Ia in the corresponding bins for the volume-limited ZTF DR2 SN Ia sample. |
In the right-hand panels of Fig. 7, the Si IIλ6355 velocity against host stellar mass is shown for both samples. In the P20 sample (with only PTF SNe Ia and with z ≤ 0.06), there are no HV SNe Ia below a host stellar mass of log(M⋆/M⊙) of ∼9.9. In our sample, there are more HV SNe Ia in lower mass hosts compared to the P20 sample, with 28 ± 7% of SNe Ia in galaxies below 1010 M⊙ being HV compared to 40 ± 9% in galaxies above 1010 M⊙. Our highest velocity SN Ia (SN 2018koy) is the event with a low stellar mass host. However, apart from this event, the SNe Ia with velocities above ∼14 000 km s−1 in our sample are mainly present in the higher mass hosts.
Dettman et al. (2021) used data from the untargeted Foundation Supernova Survey (Foley et al. 2018) and divided their sample (−6 d < t0 < 10 d) into four quadrants as having HV and NV split at vSi < 11 800 km s−1 in low and high mass galaxies split at log(M⋆/M⊙) = 9.5. They found that the HV velocity SNe are found nearly exclusively in higher stellar mass (log(M⋆/M⊙) > 9.5) hosts. However, they note that the significance of this result is dependent on where the split in host galaxy mass is made; if it is lowered to log(M⋆/M⊙) = 9, then the result become insignificant. Following the same method, we divided Fig. 7 (right) into four quadrants. However, to evaluate the impact of various selection criteria on our results, we conducted our analysis considering each different criterion for splitting HV and NV velocities, masses, different phase ranges, and the inclusion or exclusion of the template-matched sources, as outlined in Table 3.
Sample selection effect on the number of HV SNe Ia in low-mass galaxies.
We conducted our analysis with a HV and NV split at vSi < 12 000 km s−1 and low and high mass galaxies split at log(M⋆/M⊙) = 10, with a phase range of [ − 5, 5] days with the template matched sources included. As a result, we have 109 NV and 40 HV SNe in high stellar mass and 110 NV SNe in low stellar mass. Hence, under the assumption of HV SNe Ia rate being same in low and high stellar masses, we predicted 110(40/109) = 40 ± 6 SNe in the low-mass HV quadrant, compared to the 34 SNe observed. The exclusion of template-matched sources brings the predicted number to 23 ± 5 SNe in the low-mass HV quadrant, compared to the 26 SNe observed. However, the sample with a smaller phase range, [ − 3, 3] days, gives 31 ± 6 and 19 ± 4 SNe predicted, compared to the 20 and 16 observed SNe for the template-matched sources for both included and excluded cases, respectively.
Following the split criteria used in Dettman et al. (2021), for the ZTF sample with [ − 5, 5] days phase range, we find that we have already more SNe observed than the predicted numbers in low-mass HV quadrant regardless of template-matched sources being included or excluded Table 3. The ZTF SN Ia sample with [ − 3, 3] days phase range also yields observed numbers that are already higher than or very close to the predicted values. In both split criteria cases, we note that adopting higher phase ranges such as [ − 5, 5] days provides better results. Overall, we conclude that HV SNe Ia show similar rates of occurrence between high and low mass galaxies.
Nugent et al. (2023) identified no trend between SN Ia Si IIλ6355 velocity and host stellar mass, however, they did suggest that they are more centrally concentrated. Polin et al. (2019) suggested that HV SNe Ia may come from a population of sub-Chandrasekhar mass explosions. P20 also measured gas-phase metallicities for a sub-sample of their events and speculated that increased metallicity may result in HV SNe Ia being formed. Lin et al. (2024) investigated the connection between velocity and age and found a possible correlation in the sense that HV SNe Ia may come from older environments; however, this result was of low significance. Based on our results, we do not find any evidence for a difference in the stellar mass distribution of SNe Ia displaying HV Si IIλ6355 features, as compared to the NV sample.
3.5. Specific SN Ia rate of the volume-limited ZTF DR2 SN Ia sample
In this section, we calculate the SN Ia rate per unit stellar mass for the volume-limited ZTF SN Ia DR2 sample by combining our observed SN Ia rates with an estimate of the galaxy stellar mass function (SMF). Our sample covers the mass range from log(M⋆/M⊙) of ∼6.5 to 11.5, with significantly more SNe Ia in the ‘low-mass’ bins compared to previous studies, such as Brown et al. (2019). We note that the six hostless SNe identified in this study were not included in the rate analysis, since they all are calculated as upper limits and cannot be assigned to specific mass bins.
To obtain the relative SN Ia rate per unit stellar mass, the total number of SNe Ia in each mass bin of width of log(M⋆/M⊙) of 0.5 is divided by the integral of the stellar mass function over the width of that mass range. In the analysis discussed below, we used the SMF from Baldry et al. (2012) and the double-Schechter function presented in Driver et al. (2022) to calculate the SMF. We did not attempt an absolute specific SN Ia rate; instead, we used the convention of Brown et al. (2019) to show the relative rates normalized to the rate at log(M⋆/M⊙) = 10.
The ZTF SN Ia DR2 sample is defined as complete up to z ≤ 0.06, but this is only valid for the bright 91T-like, bright transitional 99aa-like, and normal SNe Ia. Dimitriadis et al. (2025) showed that fainter 91bg-like SNe Ia are complete up to redshift z ≤ 0.04. Even then, this is true only for the 91bg-like events down to an absolute magnitude of around −15 mag due the magnitude limitations of the ZTF survey. Hence, the analysis is incomplete below this magnitude limit to 91bg-like events, although fainter 91bg-like events are not expected to be common (Dimitriadis et al. 2025). In this work, we introduce a correction to the volume-limited sample to account for the missing 91bg-like SNe Ia between redshifts of 0.04 and 0.06 based on the intrinsic rates calculated by Dimitriadis et al. (2025). We assume that that host galaxy stellar mass distribution of the missing events follow the same distribution as the observed sample of the missed events.
There are 75 91bg-like events out of 1523 SNe Ia in the volume-limited ZTF DR2 sample, where 51 of the 91bg-like events are at z ≤ 0.04. In order to find out how many 91bg-like events we miss, first we calculated the distribution of 91bg-like events in each mass bin, scaled to the total number of SNe Ia. Then the same is done for the redshift range of 0.04 to 0.05 and 0.05 to 0.06 to find separate, more precise efficiencies as a function of mass (Dimitriadis et al. 2025). This correction introduces another 34 91bg-like events between 0.04 and 0.06 that were missed by ZTF due to its incompleteness for fainter 91bg-like SNe Ia. However, it is also important to point out that we might still be missing the faintest 91bg-like events, which could potentially increase the observed rate mainly for log(M⋆/M⊙) ≥ 10, where they are most common.
Gandhi et al. (2022) showed that assumed galaxy SMFs is the dominant sources of uncertainty in the specific SN Ia rate and especially for the low mass galaxies, the SMF highly affects the SN Ia rate. Previous studies have used a number of different estimates of the SMF. Brown et al. (2019) used the SMF of Bell et al. (2003), while Gandhi et al. (2022) using the measured SMF from the low-redshift GAMA survey (Baldry et al. 2012), which is steeper at lower mass. This SMF is considered complete down to a log(M⋆/M⊙) of 8, with lower limits to log(M⋆/M⊙) of 6.25. Wiseman et al. (2021) for the higher redshift DES sample estimated their own SMF, which was in good agreement with the SMF of Baldry et al. (2012). More recently, the GAMA survey has released an updated sample, which extends their measured SMF values down to log(M⋆/M⊙) of 6.75 with improved statistics (Driver et al. 2022).
We estimated the relative SN Ia rate per unit stellar mass for the ZTF data assuming two different methods of estimating the SMF. The first chosen method is similar to Gandhi et al. (2022) using the slightly modified SMF of Baldry et al. (2012) for the low-redshift GAMA survey and is also very similar to that used in DES (Wiseman et al. 2021). The second method uses the double Schechter fit from the Driver et al. (2022), which has measured SMF values down to log(M⋆/M⊙) of 6.75. A steeper SMF at low stellar mass results in lower relative specific SN Ia rates at these masses.
Fig. 8 shows the relative specific SN Ia rate for the volume-limited ZTF SN Ia DR2 sample (corrected for missed faint 91bg-like events) as a function of host galaxy stellar mass for the two methods of estimating the SMF, solid red points for the Baldry et al. (2012) and red squares for the steeper double-Schechter fit of Driver et al. (2022). We observe a higher rate for the low mass galaxies with the SMF from Baldry et al. (2012), whereas the double-Schechter fit from Driver et al. (2022) results in a lower rate. Hence, the observed rates are highly dependent on the selected SMF. We notice a significant decrease in the specific SN Ia rate in the log(M⋆/M⊙) = 7.0 bin; however, we believe this is due to the low number statistics where only two SNe are in the corresponding bin. For comparison, the log(M⋆/M⊙) = 6.5 and 7.5 bins have 9 and 21 SNe, respectively.
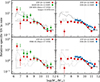 |
Fig. 8. SN Ia rate per unit stellar mass as function of stellar galaxy mass. As in Brown et al. (2019) and Gandhi et al. (2022), all the rates are normalized to the rate at log(M⋆/M⊙) = 10. Upper left: Filled red dots represent the volume-limited ZTF SN Ia DR2 sample, using the SMF from Baldry et al. (2012) as presented. Green dots represent the ASAS-SN volume-limited sample from the Gandhi et al. (2022), where they modified the SMF from Bell et al. (2003) used in Brown et al. (2019) to that of Baldry et al. (2012). The rates obtained by applying the DTD from Maoz & Graur (2017) to semi-empirical galaxy SFHs from (UniverseMachine, Behroozi et al. 2019), as presented in Gandhi et al. (2022), are represented by the gray dashed lines (re-scaled to the ZTF data) where α = 0, indicating no metallicity dependence, and α = −0.5, a slight metallicity dependence as metallicity decreases, respectively. Upper right: Filled squares represent the volume-limited ZTF SN Ia DR2 sample, using the SMF with the presented Schechter function from Driver et al. (2022). The DES sample from Wiseman et al. (2021) is shown by blue points. The DTD from Graur et al. (2015) is shown with the black line. Lower left: Same data as upper left panel, but with the rates from FIRE-2 simulations with the DTD applied from Maoz & Graur (2017) as used in Gandhi et al. (2022) and presented with the gray dotted lines. Lower right: Same as upper right panel, but with the FIRE-2 simulations. |
The ASAS-SN volume limited sample of 113 SNe Ia at z < 0.02 (Brown et al. 2019) is also shown in Fig. 8, assuming the SMF of Baldry et al. (2012) used by Gandhi et al. (2022). We also show the DES absolute specific SN Ia rate of Wiseman et al. (2021) for SNe Ia in the range of 0.2 < z < 0.6, normalised to their rate at log(M⋆/M⊙) = 10 for comparison with our values. Looking first at the comparison of the rates in higher mass galaxies (log(M⋆/M⊙) ≥ 10), we find the ZTF rates are slightly lower but consistent within the uncertainties to the ASAS-SN volume-limited sample (Brown et al. 2019; Gandhi et al. 2022). These are also consistent with the high mass (log(M⋆/M⊙) > 10) rates from Lick Observatory SN Search as a function of stellar mass (Li et al. 2011). We have made a correction to our volume-limited sample to account for missed 91bg-like SNe Ia in the range of 0.04z < 0.06. Brown et al. (2019) noted that for SNe Ia fainter than −18 mag in the V band they are incomplete. These fainter events have a strong preference to occur in higher mass hosts (see Fig. 4) and so, they could result in a lower ASAS-SN rate in the highest mass host galaxies. However, we see the opposite trend with a slightly lower relative specific rate for the ZTF volume-limited sample in host galaxies with log(M⋆/M⊙) > 11. Again, we note that if the ZTF rates are calculated with the double-Schechter fit, the relative specific rate for the log(M⋆/M⊙) = 11 bin shows an increase, showing the effects coming from the choice of SMF.
Our rates are very similar to those of the ASAS-SN sample from log(M⋆/M⊙) of 9 to 10. However, for the lower masses the ASAS-SN volume-limited sample show generally higher rates. Below log(M⋆/M⊙) of 8, we have used two estimates of the SMF. The ZTF data shown with solid red points use Baldry et al. (2012) SMF, while the ASAS-SN data (Gandhi et al. 2022) uses their own conversion from Bell et al. (2003) to Baldry et al. (2012) SMF. However, the modified SMF is still very close to the Baldry et al. (2012) values. Hence, the differences observed between the two samples are highly likely to be driven by the measured rates of the SNe Ia in those mass bins, expect for the significant drop observed at the log(M⋆/M⊙) = 7 bin for the ZTF data, where only two SNe exist. The lowest ASAS-SN sample bins represent the upper limits since, in their sample, they only had one SNe with log(M⋆/M⊙) < 7.25.
In each mass bin where the DES data exists, we see that both the ZTF and ASAS-SN samples show lower rates in general than those of the DES sample. Since a more strict x1 cut was applied in Wiseman et al. (2021), about 10% of their sample was removed, due to the cut from the x1 being below −3 (which is usually populated by 91bg-like events).
Gandhi et al. (2022) investigated how the specific SN Ia rate depends on the metallicity by testing different parameters for the metallicity in the SN Ia DTD from Maoz & Graur (2017) combined with the star formation histories (SFH) of the galaxy simulations, FIRE-2 (Hopkins et al. 2018), and UniverseMachine (UM; Behroozi et al. 2019). They found that a single power-law Zα metallicity dependence to the SN Ia DTD, with α = −0.5 to −1, is the closest to their observed rates. In the top panels of Fig. 8, the ZTF data in the low-mass galaxies closely follow the UM models combined with a DTD with no metallicity dependence (α = 0). However, an increased metallicity dependence is needed to follow the observed trend in the high mass galaxies. The ASAS-SN date with its higher SN Ia rates being (on average) in the lower mass bins is more consistent with a metallicity dependence, but is based on a smaller sample with a number of upper limits. The choice of SMF also contributes to the observed differences between the model and the data. On average, the Driver et al. (2022) SMF matches the models better than that of Baldry et al. (2012).
In the bottom panels of Fig. 8, we compare our ZTF data using the two different SMF to the FIRE-2 simulations combined with the metallicity-dependent DTD. Using the FIRE-2 SFH, compared to the UM SFH, results in the ZTF data are a better match to the models with α = −0.5, suggesting a metallicity dependence in the lower mass host galaxies. In summary, the lower and generally flatter specific rates of SNe Ia at lower stellar mass seen for the ZTF sample compared to ASAS-SN sample, combined with the most up-to-date Driver et al. (2022) SMF (right-hand panels of Fig. 8), suggest that there could be a metallicity dependence on the observed relative specific SN Ia rate. However, it would be small and perhaps even zero.
We also included the rate simulations from Graur et al. (2015) in our comparisons, which extend down to log(M⋆/M⊙) ≃ 9. We observe that our rates are generally consistent with these simulations, although the simulated rates tend to predict slightly higher values than those observed in the actual ZTF data for galaxies with log(M⋆/M⊙) ≤ 10.
4. Conclusions
In this work, we used sub-samples of 1523 SNe Ia from the volume-limited ZTF DR2 SN Ia sample to explore the relation between the velocity of the Si IIλ6355 feature, SALT2 light-curve stretch x1, and stellar galaxy properties of SNe Ia.
-
We visually inspected six hostless SNe Ia in our sample to identify possible host galaxies nearby. Upon our investigation, 4 out of 6 hostless SN Ia were found to be near the Galactic plane (within 15°) and experiencing higher extinction. One hostless SN Ia, while not being within 15° from the Galactic plane, was still close enough for extinction to be the reason for a lack of detected host. The remaining one hostless SN Ia is further away from the Galactic plane with low extinction and we found an extremely faint, diffuse source with no detection in the PS1 images.
-
We investigated the distribution of SALT2 stretch x1 and stellar galaxy masses for different sub-types in our sample. A general trend of brighter SNe Ia being in the lower-mass galaxies is observed, in agreement with previous studies. In the low- and intermediate-mass galaxies, the distributions of both normal SN Ia and Ia-unclear sub-types remain similar for each mass bin. Bright 91T-like SNe Ia and 99aa-like transitional SNe Ia have a higher distribution in the lower mass regions. In the ‘low-mass’ (log(M⋆/M⊙) ≤ 8) galaxies, around 80% of the SNe Ia are normal SNe Ia, around 10% are Ia-unclear and remaining 10% are 91T-like and 99aa-like SNe Ia.
-
Using a volume-limited SN Ia sample, we found that HV SNe Ia do not necessarily favor high-mass galaxies but are also found in low-mass and intermediate mass galaxies, even without including the redshift sources from SNID matches. We conclude that the missing HV SNe Ia in previous samples is mainly related to the sample size and/or a selection bias towards observing higher mass galaxies.
-
No correlations have been found between the rest-frame g − z host galaxy colour, nor the SN to host galaxy distance scaled with the size of the corresponding galaxies between HV and NV SNe Ia. This indicates that both sub-types should be experiencing similar host galaxy contamination.
-
Following the work of Gandhi et al. (2022), we calculated the specific SN Ia rate for the volume-limited ZTF SN Ia DR2 sample and compared with other surveys, as well as a DTD model. Overall, we find our rates to be closely in agreement with the ASAS-SN volume-limited sample within the uncertainties. In the low-mass galaxies, our data differ from the ASAS-SN data and show a more constant rate. By comparison with literature SFH and a metallicity-dependent DTD, we find that our sample is most consistent with a slight to no metallicity dependence of the specific SN Ia rate.
In this work, we highlight the significance of low-mass galaxies and the value of large, well-characterised samples of such galaxies, highlighting the need for even larger samples in future studies. A forthcoming paper will explore the relationship between metallicity and low-mass host galaxies, specifically focussing on systems with stellar masses of log(M⋆/M⊙) ≤ 8.
Acknowledgments
We thank Or Graur for providing simulation data for SNe Ia rates. UB, KM, GD, MD and JHT are supported by the H2020 European Research Council grant no. 758638. LH is funded by the Irish Research Council under grant number GOIPG/2020/1387. T.E.M.B. acknowledges financial support from the Spanish Ministerio de Ciencia e Innovación (MCIN), the Agencia Estatal de Investigación (AEI) 10.13039/501100011033, and the European Union Next Generation EU/PRTR funds under the 2021 Juan de la Cierva program FJC2021-047124-I and the PID2020-115253GA-I00 HOSTFLOWS project, from Centro Superior de Investigaciones Científicas (CSIC) under the PIE project 20215AT016, and the program Unidad de Excelencia María de Maeztu CEX2020-001058-M. This project has received funding from the European Research Council (ERC) under the European Union’s Horizon 2020 research and innovation program (grant agreement n 759194 – USNAC). L.G. acknowledges financial support from AGAUR, CSIC, MCIN and AEI 10.13039/501100011033 under projects PID2020-115253GA-I00, PIE 20215AT016, CEX2020-001058-M, and 2021-SGR-01270. Y.-L.K. has received funding from the Science and Technology Facilities Council [grant number ST/V000713/1]. This work has been supported by the research project grant “Understanding the Dynamic Universe” funded by the Knut and Alice Wallenberg Foundation under Dnr KAW 2018.0067 and the Vetenskapsrådet, the Swedish Research Council, project 2020-03444. Based on observations obtained with the Samuel Oschin Telescope 48-inch and the 60-inch Telescope at the Palomar Observatory as part of the Zwicky Transient Facility project. ZTF is supported by the National Science Foundation under Grants No. AST-1440341 and AST-2034437 and a collaboration including current partners Caltech, IPAC, the Weizmann Institute of Science, the Oskar Klein Center at Stockholm University, the University of Maryland, Deutsches Elektronen-Synchrotron and Humboldt University, the TANGO Consortium of Taiwan, the University of Wisconsin at Milwaukee, Trinity College Dublin, Lawrence Livermore National Laboratories, IN2P3, University of Warwick, Ruhr University Bochum, Northwestern University and former partners the University of Washington, Los Alamos National Laboratories, and Lawrence Berkeley National Laboratories. Operations are conducted by COO, IPAC, and UW. SED Machine is based upon work supported by the National Science Foundation under Grant No. 1106171. The ZTF forced-photometry service was funded under the Heising-Simons Foundation grant 12540303 (PI: Graham). SED Machine is based upon work supported by the National Science Foundation under Grant No. 1106171. The ZTF forced-photometry service was funded under the Heising-Simons Foundation grant 12540303 (PI: Graham). This work was supported by the GROWTH project funded by the National Science Foundation under Grant No. 1545949 (Kasliwal et al. 2019). Fritz (van der Walt et al. 2019; Coughlin et al. 2023) is used in this work. The Gordon and Betty Moore Foundation, through both the Data-Driven Investigator Program and a dedicated grant, provided critical funding for SkyPortal.
References
- Abdurro’uf, Accetta, K., Aerts, C., et al. 2022, ApJS, 259, 35 [NASA ADS] [CrossRef] [Google Scholar]
- Amenouche, M., Rosnet, P., Smith, M., et al. 2025, A&A, 694, A3 (ZTF DR2 SI) [NASA ADS] [CrossRef] [EDP Sciences] [Google Scholar]
- Baldry, I. K., Driver, S. P., Loveday, J., et al. 2012, MNRAS, 421, 621 [NASA ADS] [Google Scholar]
- Barkhudaryan, L. V., Hakobyan, A. A., Karapetyan, A. G., et al. 2019, MNRAS, 490, 718 [NASA ADS] [CrossRef] [Google Scholar]
- Behroozi, P., Wechsler, R. H., Hearin, A. P., & Conroy, C. 2019, MNRAS, 488, 3143 [NASA ADS] [CrossRef] [Google Scholar]
- Bell, E. F., McIntosh, D. H., Katz, N., & Weinberg, M. D. 2003, ApJS, 149, 289 [Google Scholar]
- Bellm, E. C., Kulkarni, S. R., Barlow, T., et al. 2019, PASP, 131, 068003 [Google Scholar]
- Blagorodnova, N., Neill, J. D., Walters, R., et al. 2018, PASP, 130, 035003 [Google Scholar]
- Blondin, S., & Tonry, J. L. 2007, ApJ, 666, 1024 [NASA ADS] [CrossRef] [Google Scholar]
- Brown, J. S., Stanek, K. Z., Holoien, T. W. S., et al. 2019, MNRAS, 484, 3785 [NASA ADS] [CrossRef] [Google Scholar]
- Burgaz, U., Maguire, K., Dimitriadis, G., et al. 2025, A&A, 694, A9 (ZTF DR2 SI) [NASA ADS] [CrossRef] [EDP Sciences] [Google Scholar]
- Chambers, K. C., Magnier, E. A., Metcalfe, N., et al. 2016, ArXiv e-prints [arXiv:1612.05560] [Google Scholar]
- Childress, M., Aldering, G., Antilogus, P., et al. 2013, ApJ, 770, 108 [Google Scholar]
- Coughlin, M. W., Bloom, J. S., Nir, G., et al. 2023, ApJS, 267, 31 [NASA ADS] [CrossRef] [Google Scholar]
- Dekany, R., Smith, R. M., Riddle, R., et al. 2020, PASP, 132, 038001 [NASA ADS] [CrossRef] [Google Scholar]
- DES Collaboration (Abbott, T., et al.) 2016, MNRAS, 460, 1270 [Google Scholar]
- DES Collaboration (Abbott, T. M. C., et al.) 2024, ArXiv e-prints [arXiv:2401.02929] [Google Scholar]
- Dettman, K. G., Jha, S. W., Dai, M., et al. 2021, ApJ, 923, 267 [NASA ADS] [CrossRef] [Google Scholar]
- Dey, A., Schlegel, D. J., Lang, D., et al. 2019, AJ, 157, 168 [Google Scholar]
- Dimitriadis, G., Burgaz, U., Deckers, M., et al. 2025, A&A, 694, A10 (ZTF DR2 SI) [NASA ADS] [CrossRef] [EDP Sciences] [Google Scholar]
- Driver, S. P., Bellstedt, S., Robotham, A. S. G., et al. 2022, MNRAS, 513, 439 [NASA ADS] [CrossRef] [Google Scholar]
- Fink, M., Hillebrandt, W., & Röpke, F. K. 2007, A&A, 476, 1133 [NASA ADS] [CrossRef] [EDP Sciences] [Google Scholar]
- Fioc, M., & Rocca-Volmerange, B. 1997, A&A, 326, 950 [NASA ADS] [Google Scholar]
- Foley, R. J., Scolnic, D., Rest, A., et al. 2018, MNRAS, 475, 193 [Google Scholar]
- Gal-Yam, A. 2012, Science, 337, 927 [Google Scholar]
- Galbany, L., Miquel, R., Östman, L., et al. 2012, ApJ, 755, 125 [NASA ADS] [CrossRef] [Google Scholar]
- Gallagher, J. S., Garnavich, P. M., Berlind, P., et al. 2005, ApJ, 634, 210 [NASA ADS] [CrossRef] [Google Scholar]
- Gallagher, J. S., Garnavich, P. M., Caldwell, N., et al. 2008, ApJ, 685, 752 [NASA ADS] [CrossRef] [Google Scholar]
- Gandhi, P. J., Wetzel, A., Hopkins, P. F., et al. 2022, MNRAS, 516, 1941 [NASA ADS] [CrossRef] [Google Scholar]
- Ginolin, M., Rigault, M., Smith, M., et al. 2024, A&A, submitted [arXiv:2405.20965] (ZTF DR2 SI) [Google Scholar]
- Ginolin, M., Rigault, M., Copin, Y., et al. 2025, A&A, 694, A4 (ZTF DR2 SI) [NASA ADS] [CrossRef] [EDP Sciences] [Google Scholar]
- Graham, M. L., Sand, D. J., Zaritsky, D., & Pritchet, C. J. 2015, ApJ, 807, 83 [NASA ADS] [CrossRef] [Google Scholar]
- Graham, M. J., Kulkarni, S. R., Bellm, E. C., et al. 2019, PASP, 131, 078001 [Google Scholar]
- Graur, O., & Maoz, D. 2013, MNRAS, 430, 1746 [NASA ADS] [CrossRef] [Google Scholar]
- Graur, O., Bianco, F. B., & Modjaz, M. 2015, MNRAS, 450, 905 [NASA ADS] [CrossRef] [Google Scholar]
- Graur, O., Bianco, F. B., Modjaz, M., et al. 2017, ApJ, 837, 121 [CrossRef] [Google Scholar]
- Gupta, R. R., D’Andrea, C. B., Sako, M., et al. 2011, ApJ, 740, 92 [Google Scholar]
- Gupta, R. R., Kuhlmann, S., Kovacs, E., et al. 2016, AJ, 152, 154 [NASA ADS] [CrossRef] [Google Scholar]
- Guy, J., Astier, P., Baumont, S., et al. 2007, A&A, 466, 11 [NASA ADS] [CrossRef] [EDP Sciences] [Google Scholar]
- Hakobyan, A. A., Barkhudaryan, L. V., Karapetyan, A. G., et al. 2020, MNRAS, 499, 1424 [NASA ADS] [CrossRef] [Google Scholar]
- Hamuy, M., Phillips, M. M., Suntzeff, N. B., et al. 1996, AJ, 112, 2391 [Google Scholar]
- Holoien, T. W. S., Berger, V. L., Hinkle, J. T., et al. 2023, ApJ, 950, 108 [NASA ADS] [CrossRef] [Google Scholar]
- Hopkins, P. F., Wetzel, A., Kereš, D., et al. 2018, MNRAS, 480, 800 [NASA ADS] [CrossRef] [Google Scholar]
- Howell, D. A. 2001, ApJ, 554, L193 [Google Scholar]
- Howell, D. A., Sullivan, M., Brown, E. F., et al. 2009, ApJ, 691, 661 [Google Scholar]
- Hoyle, F., & Fowler, W. A. 1960, ApJ, 132, 565 [NASA ADS] [CrossRef] [Google Scholar]
- Iben, I., & Tutukov, A. V. 1984, ApJS, 54, 335 [NASA ADS] [CrossRef] [Google Scholar]
- Kasliwal, M. M., Cannella, C., Bagdasaryan, A., et al. 2019, PASP, 131, 038003 [NASA ADS] [CrossRef] [Google Scholar]
- Kelsey, L., Sullivan, M., Smith, M., et al. 2021, MNRAS, 501, 4861 [NASA ADS] [CrossRef] [Google Scholar]
- Kim, Y. L., Rigault, M., Neill, J. D., et al. 2022, PASP, 134, 024505 [NASA ADS] [CrossRef] [Google Scholar]
- Kistler, M. D., Stanek, K. Z., Kochanek, C. S., Prieto, J. L., & Thompson, T. A. 2013, ApJ, 770, 88 [Google Scholar]
- Kochanek, C. S., Shappee, B. J., Stanek, K. Z., et al. 2017, PASP, 129, 104502 [Google Scholar]
- Li, W., Chornock, R., Leaman, J., et al. 2011, MNRAS, 412, 1473 [NASA ADS] [CrossRef] [Google Scholar]
- Lin, H.-T., Pan, Y.-C., & Abdurro’uf 2024, MNRAS, 531, 1988 [NASA ADS] [CrossRef] [Google Scholar]
- Liu, Z.-W., Röpke, F. K., & Han, Z. 2023, RAA, 23, 082001 [NASA ADS] [Google Scholar]
- Maeda, K., & Terada, Y. 2016, Int. J. Mod. Phys. D, 25, 1630024 [NASA ADS] [CrossRef] [Google Scholar]
- Maoz, D., & Graur, O. 2017, ApJ, 848, 25 [Google Scholar]
- Maoz, D., Mannucci, F., & Nelemans, G. 2014, ARA&A, 52, 107 [Google Scholar]
- Masci, F. J., Laher, R. R., Rusholme, B., et al. 2019, PASP, 131, 018003 [Google Scholar]
- Moon, D.-S., Ni, Y. Q., Drout, M. R., et al. 2021, ApJ, 910, 151 [NASA ADS] [CrossRef] [Google Scholar]
- Müller-Bravo, T., & Galbany, L. 2022, J. Open Source Softw., 7, 4508 [CrossRef] [Google Scholar]
- Nomoto, K., Iwamoto, K., & Kishimoto, N. 1997, Science, 276, 1378 [NASA ADS] [CrossRef] [Google Scholar]
- Nugent, A. E., Polin, A. E., & Nugent, P. E. 2023, ArXiv e-prints [arXiv:2304.10601] [Google Scholar]
- Pakmor, R., Kromer, M., Taubenberger, S., & Springel, V. 2013, ApJ, 770, L8 [Google Scholar]
- Pan, Y.-C. 2020, ApJ, 895, L5 [NASA ADS] [CrossRef] [Google Scholar]
- Pan, Y. C., Sullivan, M., Maguire, K., et al. 2014, MNRAS, 438, 1391 [NASA ADS] [CrossRef] [Google Scholar]
- Pan, Y. C., Sullivan, M., Maguire, K., et al. 2015, MNRAS, 446, 354 [NASA ADS] [CrossRef] [Google Scholar]
- Perlmutter, S., Gabi, S., Goldhaber, G., et al. 1997, ApJ, 483, 565 [Google Scholar]
- Perlmutter, S., Aldering, G., Goldhaber, G., et al. 1999, ApJ, 517, 565 [Google Scholar]
- Polin, A., Nugent, P., & Kasen, D. 2019, ApJ, 873, 84 [Google Scholar]
- Raskin, C., Timmes, F. X., Scannapieco, E., Diehl, S., & Fryer, C. 2009, MNRAS, 399, L156 [NASA ADS] [CrossRef] [Google Scholar]
- Riess, A. G., Filippenko, A. V., Challis, P., et al. 1998, AJ, 116, 1009 [Google Scholar]
- Riess, A. G., Macri, L. M., Hoffmann, S. L., et al. 2016, ApJ, 826, 56 [Google Scholar]
- Rigault, M., Copin, Y., Aldering, G., et al. 2013, A&A, 560, A66 [NASA ADS] [CrossRef] [EDP Sciences] [Google Scholar]
- Rigault, M., Neill, J. D., Blagorodnova, N., et al. 2019, A&A, 627, A115 [NASA ADS] [CrossRef] [EDP Sciences] [Google Scholar]
- Rigault, M., Brinnel, V., Aldering, G., et al. 2020, A&A, 644, A176 [NASA ADS] [CrossRef] [EDP Sciences] [Google Scholar]
- Rigault, M., Smith, M., Goobar, A., et al. 2025a, A&A, 694, A1 (ZTF DR2 SI) [NASA ADS] [CrossRef] [EDP Sciences] [Google Scholar]
- Rigault, M., Smith, M., Regnault, N., et al. 2025b, A&A, 694, A2 (ZTF DR2 SI) [NASA ADS] [CrossRef] [EDP Sciences] [Google Scholar]
- Roy, N. C., Tiwari, V., Bobrick, A., et al. 2022, ApJ, 932, L24 [NASA ADS] [CrossRef] [Google Scholar]
- Sato, Y., Nakasato, N., Tanikawa, A., et al. 2015, ApJ, 807, 105 [NASA ADS] [CrossRef] [Google Scholar]
- Shappee, B. J., Prieto, J. L., Grupe, D., et al. 2014, ApJ, 788, 48 [Google Scholar]
- Shen, K. J., Kasen, D., Miles, B. J., & Townsley, D. M. 2018, ApJ, 854, 52 [Google Scholar]
- Sim, S. A., Röpke, F. K., Hillebrandt, W., et al. 2010, ApJ, 714, L52 [Google Scholar]
- Smith, M., Nichol, R. C., Dilday, B., et al. 2012, ApJ, 755, 61 [Google Scholar]
- Smith, M., Rigault, M., et al. 2025, A&A, in prep. (ZTF DR2 SI) [Google Scholar]
- Soumagnac, M. T., Nugent, P., Knop, R. A., et al. 2024, ApJS, 275, 22 [NASA ADS] [CrossRef] [Google Scholar]
- Sullivan, M., Le Borgne, D., Pritchet, C. J., et al. 2006, ApJ, 648, 868 [NASA ADS] [CrossRef] [Google Scholar]
- Sullivan, M., Conley, A., Howell, D. A., et al. 2010, MNRAS, 406, 782 [NASA ADS] [Google Scholar]
- Taylor, E. N., Hopkins, A. M., Baldry, I. K., et al. 2011, MNRAS, 418, 1587 [Google Scholar]
- Taylor, G., Lidman, C., Tucker, B. E., et al. 2021, MNRAS, 504, 4111 [NASA ADS] [CrossRef] [Google Scholar]
- van der Walt, S., Crellin-Quick, A., & Bloom, J. 2019, J. Open Source Softw., 4, 1247 [NASA ADS] [CrossRef] [Google Scholar]
- Wang, B., & Han, Z. 2012, New Astron. Rev., 56, 122 [CrossRef] [Google Scholar]
- Wang, X., Filippenko, A. V., Ganeshalingam, M., et al. 2009, ApJ, 699, L139 [NASA ADS] [CrossRef] [Google Scholar]
- Wang, X., Wang, L., Filippenko, A. V., Zhang, T., & Zhao, X. 2013, Science, 340, 170 [NASA ADS] [CrossRef] [Google Scholar]
- Webbink, R. F. 1984, ApJ, 277, 355 [NASA ADS] [CrossRef] [Google Scholar]
- Whelan, J., & Iben, I. 1973, ApJ, 186, 1007 [CrossRef] [Google Scholar]
- Wiseman, P., Sullivan, M., Smith, M., et al. 2021, MNRAS, 506, 3330 [NASA ADS] [Google Scholar]
- Wiseman, P., Sullivan, M., Smith, M., & Popovic, B. 2023, MNRAS, 520, 6214 [CrossRef] [Google Scholar]
- Smith, M. 2025, A&A, in prep. (ZTF DR2 SI), Rigault, M., et al. [Google Scholar]
All Tables
All Figures
|
Fig. 1. Hostless SNe Ia from the volume-limited ZTF DR2 sample. All SNe presented in this plot are investigated for potential host galaxies within a search radius of 125 kpc and each image shown here spans 125 kpc scaled from the corresponding SN redshift for a clear visualisation. |
| In the text | |
|
Fig. 2. Galactic latitudes plotted against the stellar masses from the ZTF DR2 volume limited (z ≤ 0.06) sample, colour-mapped with the MW extinction (AV). The filled circles represent the sample with a measured stellar galaxy mass and triangles represent the estimated upper limits of the 6 hostless SNe. Dashed black lines show +15 and −15° in the Galactic latitude. |
| In the text | |
|
Fig. 3. Host galaxy masses in the ZTF DR2 volume limited (z ≤ 0.06) sample. Blue solid circles are the ‘low-mass’ galaxies where log(M⋆/M⊙) ≤ 8. Blue triangles represent the estimated upper limits of the six hostless SNe. The upper histogram shows the distributions of the stellar galaxy masses in mass bins. |
| In the text | |
|
Fig. 4. Stellar galaxy masses plotted against the SALT2 x1 parameter for the good light-curve coverage sample of the volume-limited sample of ZTF DR 2 SN Ia (1106 SNe Ia, including the six hostless SNe Ia). A relative percentage of sub-types in each mass bin is plotted as a histogram above the figure and the cumulative occurrence of these types is illustrated as additive. The distribution of the sub-type normal is excluded where it is mostly constant in each mass bin with a range of (65−77%). Different colours of circles, represent different sub-types used in this study. For the selection of sub-type methods, we refer to Sect. 3.2. The gray and black dashed line represents the separation for the low, intermediate, and high stellar galaxy masses. |
| In the text | |
|
Fig. 5. Si IIλ6355 velocities, taken from Burgaz et al. (2025) plotted against the stellar galaxy masses of the volume-limited ZTF DR2 SN Ia sample for 477 SNe Ia spectra with a phase range of −5 d ≤ t0 ≤ 5 d. Filled and empty circles represents the SNe Ia with known redshift sources and SNID template matched sources, respectively. The horizontal black dashed line represents the value of Si IIλ6355 velocity used to separate the sample into HV and NV events for the normal SNe Ia (HV/NV can only be defined for normal SNe Ia). The vertical dashed line represents the standard value (1010 M⊙) for separating high- and low-mass host galaxies. The bottom histograms show the cumulative fractions of the host galaxy masses for each sub-type and the full peak sample. The p-values shown are derived from two-sample K-S tests using normal SNe Ia as the reference. |
| In the text | |
|
Fig. 6. dDLR distribution of the ‘normal’ SNe Ia are presented as a function of stellar galaxy masses, colour-mapped according to the global g − z rest-frame colours. Circles and squares represent NV and HV SNe Ia, respectively. Dashed horizontal line represent the separation of high mass and low mass galaxies at (log(M⋆/M⊙) = 10). There are eight NV SNe Ia with higher dDLR values that are excluded from the plot to provide a clearer comparison between the two sub-types within the lower dDLR ranges. |
| In the text | |
|
Fig. 7. Si IIλ6355 velocities as a function of redshift and host galaxy stellar mass. Left: Si IIλ6355 velocities plotted against the redshift. Right: Si IIλ6355 velocities plotted against the stellar galaxy masses. In both plots, blue filled and unfilled circles represent the volume-limited ZTF DR2 SN Ia sample adjusted to match the selection criteria of P20 with known and template matched redshift sources within 3 days since peak brightness, respectively. Red circles represent the P20 sample with only PTF sources and matched to the redshift range of the volume-limited ZTF DR2 SN Ia sample, (z ≤ 0.06). The horizontal black dashed line represents the value of Si IIλ6355 velocity used to separate the sample into HV and NV SN Ia. The vertical dashed line represents the typical high-low host galaxy mass separation value. Histograms of the distributions are shown in the top panels for the corresponding plots underneath. In these plots, the unfilled bars represent the ratio of HV SNe Ia to NV SNe Ia in the corresponding bins for the volume-limited ZTF DR2 SN Ia sample. |
| In the text | |
|
Fig. 8. SN Ia rate per unit stellar mass as function of stellar galaxy mass. As in Brown et al. (2019) and Gandhi et al. (2022), all the rates are normalized to the rate at log(M⋆/M⊙) = 10. Upper left: Filled red dots represent the volume-limited ZTF SN Ia DR2 sample, using the SMF from Baldry et al. (2012) as presented. Green dots represent the ASAS-SN volume-limited sample from the Gandhi et al. (2022), where they modified the SMF from Bell et al. (2003) used in Brown et al. (2019) to that of Baldry et al. (2012). The rates obtained by applying the DTD from Maoz & Graur (2017) to semi-empirical galaxy SFHs from (UniverseMachine, Behroozi et al. 2019), as presented in Gandhi et al. (2022), are represented by the gray dashed lines (re-scaled to the ZTF data) where α = 0, indicating no metallicity dependence, and α = −0.5, a slight metallicity dependence as metallicity decreases, respectively. Upper right: Filled squares represent the volume-limited ZTF SN Ia DR2 sample, using the SMF with the presented Schechter function from Driver et al. (2022). The DES sample from Wiseman et al. (2021) is shown by blue points. The DTD from Graur et al. (2015) is shown with the black line. Lower left: Same data as upper left panel, but with the rates from FIRE-2 simulations with the DTD applied from Maoz & Graur (2017) as used in Gandhi et al. (2022) and presented with the gray dotted lines. Lower right: Same as upper right panel, but with the FIRE-2 simulations. |
| In the text | |
Current usage metrics show cumulative count of Article Views (full-text article views including HTML views, PDF and ePub downloads, according to the available data) and Abstracts Views on Vision4Press platform.
Data correspond to usage on the plateform after 2015. The current usage metrics is available 48-96 hours after online publication and is updated daily on week days.
Initial download of the metrics may take a while.