Fig. 8.
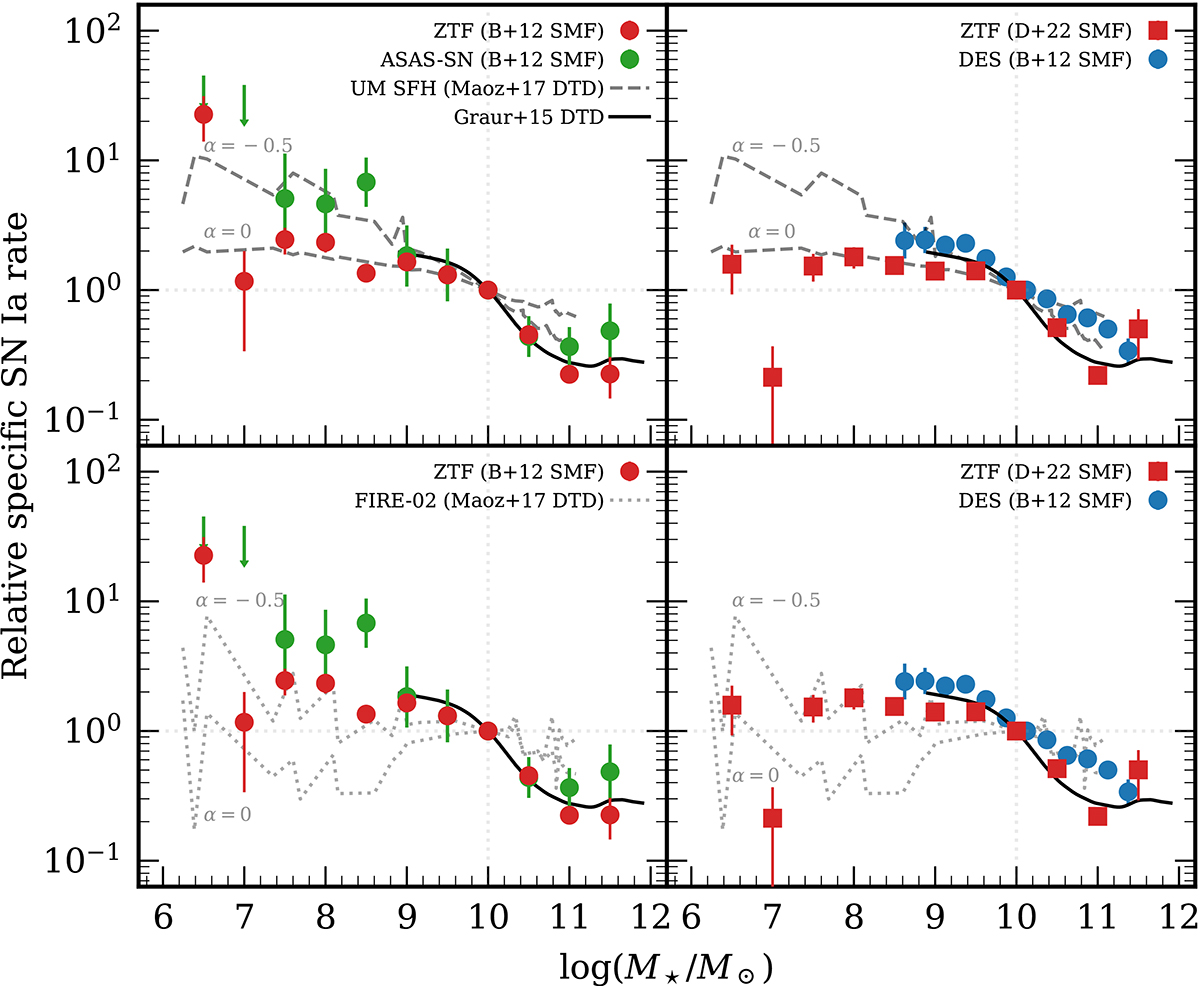
Download original image
SN Ia rate per unit stellar mass as function of stellar galaxy mass. As in Brown et al. (2019) and Gandhi et al. (2022), all the rates are normalized to the rate at log(M⋆/M⊙) = 10. Upper left: Filled red dots represent the volume-limited ZTF SN Ia DR2 sample, using the SMF from Baldry et al. (2012) as presented. Green dots represent the ASAS-SN volume-limited sample from the Gandhi et al. (2022), where they modified the SMF from Bell et al. (2003) used in Brown et al. (2019) to that of Baldry et al. (2012). The rates obtained by applying the DTD from Maoz & Graur (2017) to semi-empirical galaxy SFHs from (UniverseMachine, Behroozi et al. 2019), as presented in Gandhi et al. (2022), are represented by the gray dashed lines (re-scaled to the ZTF data) where α = 0, indicating no metallicity dependence, and α = −0.5, a slight metallicity dependence as metallicity decreases, respectively. Upper right: Filled squares represent the volume-limited ZTF SN Ia DR2 sample, using the SMF with the presented Schechter function from Driver et al. (2022). The DES sample from Wiseman et al. (2021) is shown by blue points. The DTD from Graur et al. (2015) is shown with the black line. Lower left: Same data as upper left panel, but with the rates from FIRE-2 simulations with the DTD applied from Maoz & Graur (2017) as used in Gandhi et al. (2022) and presented with the gray dotted lines. Lower right: Same as upper right panel, but with the FIRE-2 simulations.
Current usage metrics show cumulative count of Article Views (full-text article views including HTML views, PDF and ePub downloads, according to the available data) and Abstracts Views on Vision4Press platform.
Data correspond to usage on the plateform after 2015. The current usage metrics is available 48-96 hours after online publication and is updated daily on week days.
Initial download of the metrics may take a while.