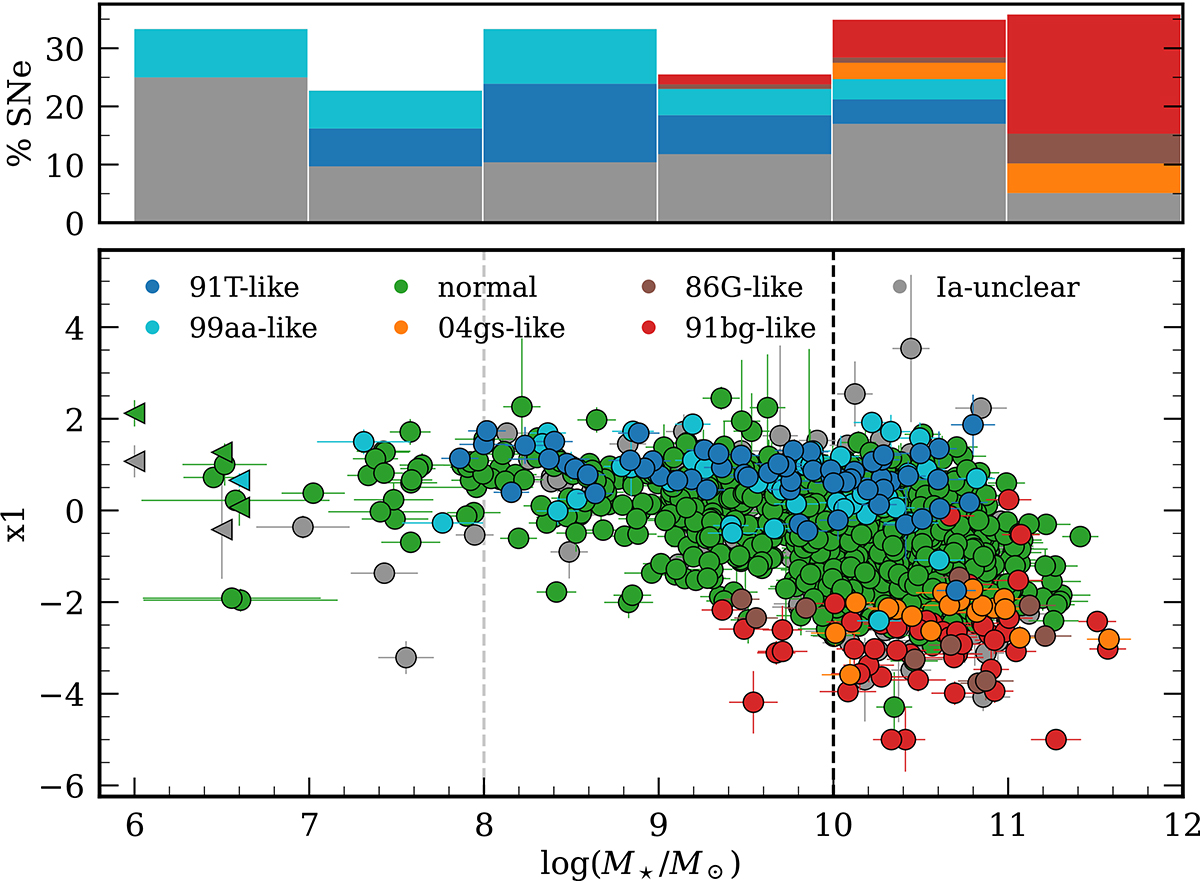
Fig. 4.
Download original image
Stellar galaxy masses plotted against the SALT2 x1 parameter for the good light-curve coverage sample of the volume-limited sample of ZTF DR 2 SN Ia (1106 SNe Ia, including the six hostless SNe Ia). A relative percentage of sub-types in each mass bin is plotted as a histogram above the figure and the cumulative occurrence of these types is illustrated as additive. The distribution of the sub-type normal is excluded where it is mostly constant in each mass bin with a range of (65−77%). Different colours of circles, represent different sub-types used in this study. For the selection of sub-type methods, we refer to Sect. 3.2. The gray and black dashed line represents the separation for the low, intermediate, and high stellar galaxy masses.
Current usage metrics show cumulative count of Article Views (full-text article views including HTML views, PDF and ePub downloads, according to the available data) and Abstracts Views on Vision4Press platform.
Data correspond to usage on the plateform after 2015. The current usage metrics is available 48-96 hours after online publication and is updated daily on week days.
Initial download of the metrics may take a while.