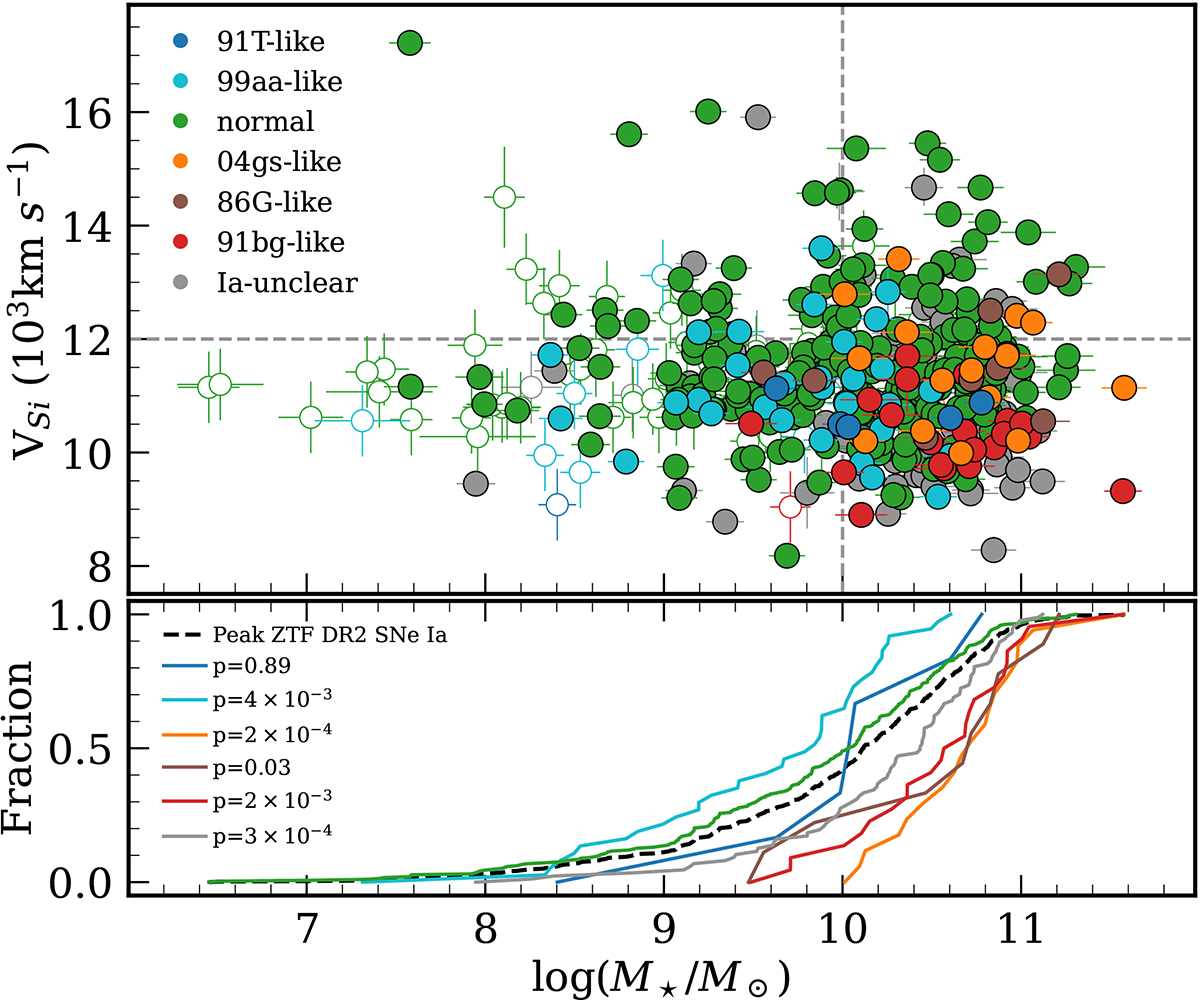
Fig. 5.
Download original image
Si IIλ6355 velocities, taken from Burgaz et al. (2025) plotted against the stellar galaxy masses of the volume-limited ZTF DR2 SN Ia sample for 477 SNe Ia spectra with a phase range of −5 d ≤ t0 ≤ 5 d. Filled and empty circles represents the SNe Ia with known redshift sources and SNID template matched sources, respectively. The horizontal black dashed line represents the value of Si IIλ6355 velocity used to separate the sample into HV and NV events for the normal SNe Ia (HV/NV can only be defined for normal SNe Ia). The vertical dashed line represents the standard value (1010 M⊙) for separating high- and low-mass host galaxies. The bottom histograms show the cumulative fractions of the host galaxy masses for each sub-type and the full peak sample. The p-values shown are derived from two-sample K-S tests using normal SNe Ia as the reference.
Current usage metrics show cumulative count of Article Views (full-text article views including HTML views, PDF and ePub downloads, according to the available data) and Abstracts Views on Vision4Press platform.
Data correspond to usage on the plateform after 2015. The current usage metrics is available 48-96 hours after online publication and is updated daily on week days.
Initial download of the metrics may take a while.