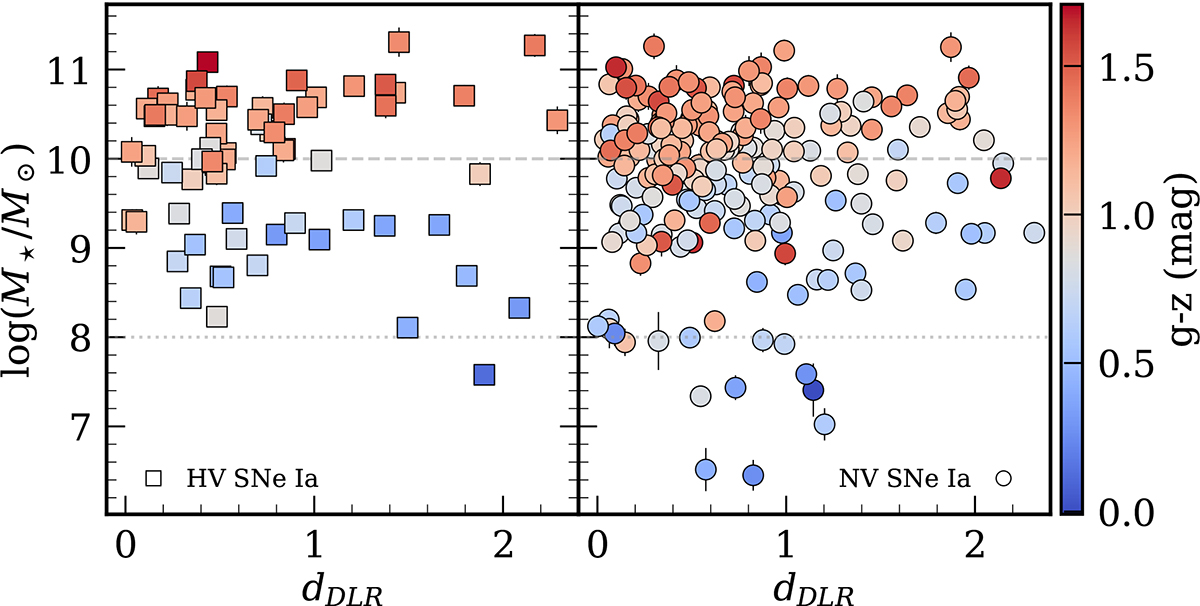
Fig. 6.
Download original image
dDLR distribution of the ‘normal’ SNe Ia are presented as a function of stellar galaxy masses, colour-mapped according to the global g − z rest-frame colours. Circles and squares represent NV and HV SNe Ia, respectively. Dashed horizontal line represent the separation of high mass and low mass galaxies at (log(M⋆/M⊙) = 10). There are eight NV SNe Ia with higher dDLR values that are excluded from the plot to provide a clearer comparison between the two sub-types within the lower dDLR ranges.
Current usage metrics show cumulative count of Article Views (full-text article views including HTML views, PDF and ePub downloads, according to the available data) and Abstracts Views on Vision4Press platform.
Data correspond to usage on the plateform after 2015. The current usage metrics is available 48-96 hours after online publication and is updated daily on week days.
Initial download of the metrics may take a while.