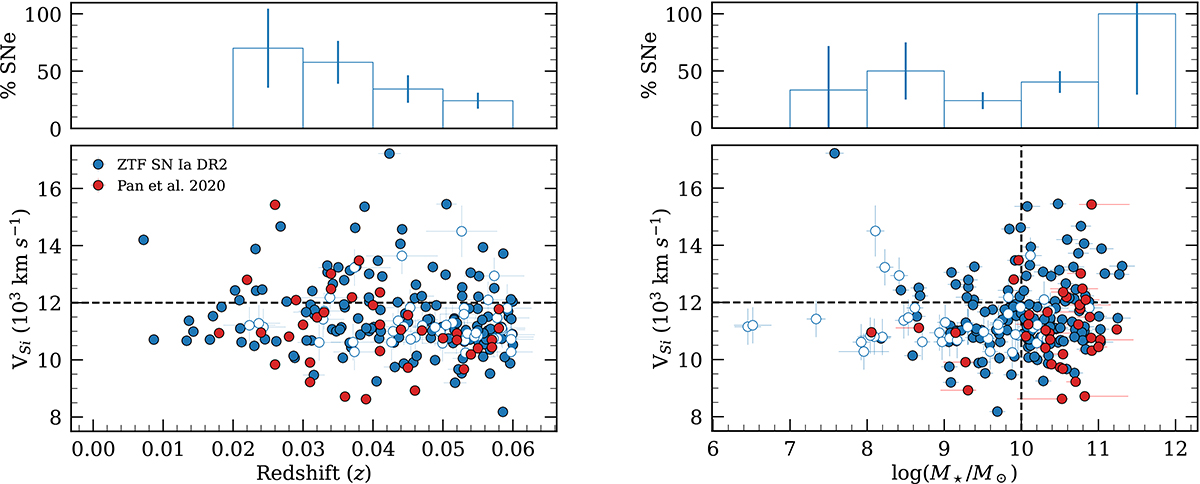
Fig. 7.
Download original image
Si IIλ6355 velocities as a function of redshift and host galaxy stellar mass. Left: Si IIλ6355 velocities plotted against the redshift. Right: Si IIλ6355 velocities plotted against the stellar galaxy masses. In both plots, blue filled and unfilled circles represent the volume-limited ZTF DR2 SN Ia sample adjusted to match the selection criteria of P20 with known and template matched redshift sources within 3 days since peak brightness, respectively. Red circles represent the P20 sample with only PTF sources and matched to the redshift range of the volume-limited ZTF DR2 SN Ia sample, (z ≤ 0.06). The horizontal black dashed line represents the value of Si IIλ6355 velocity used to separate the sample into HV and NV SN Ia. The vertical dashed line represents the typical high-low host galaxy mass separation value. Histograms of the distributions are shown in the top panels for the corresponding plots underneath. In these plots, the unfilled bars represent the ratio of HV SNe Ia to NV SNe Ia in the corresponding bins for the volume-limited ZTF DR2 SN Ia sample.
Current usage metrics show cumulative count of Article Views (full-text article views including HTML views, PDF and ePub downloads, according to the available data) and Abstracts Views on Vision4Press platform.
Data correspond to usage on the plateform after 2015. The current usage metrics is available 48-96 hours after online publication and is updated daily on week days.
Initial download of the metrics may take a while.