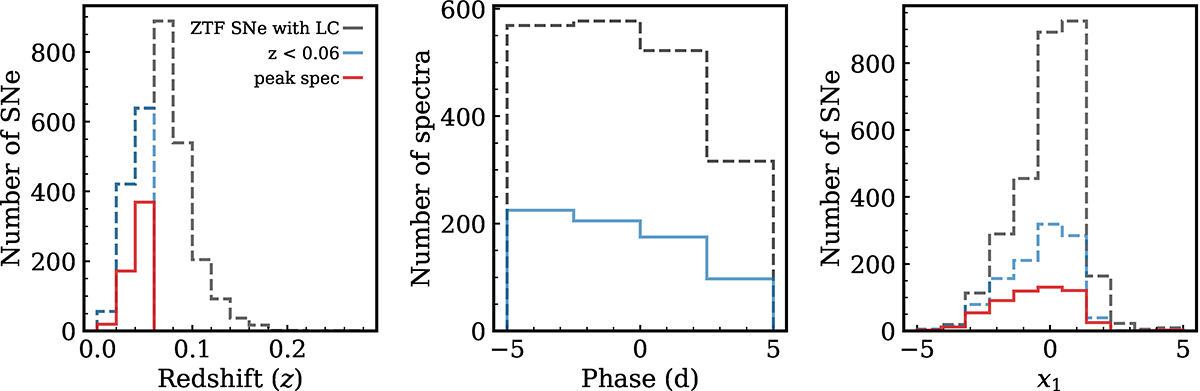
Fig. 1.
Download original image
Redshift, phase, and SALT2 x1 distributions of the ZTF SN Ia sample. Left: Redshift distribution of the full ZTF SN Ia sample (grey dashed line, 2959 SNe Ia) with good light-curve coverage; the sample with a redshift limit at z ≤ 0.06 (blue dashed line, 1093 SNe Ia); and SNe Ia passing our other cuts that have a spectrum at −5 to 5 d with respect to maximum light (red solid line, 482 SNe Ia). Middle: Rest-frame phase distribution of all good light-curve coverage ZTF SNe Ia spectra at −5 to 5 d (grey) and with the redshift cut of z ≤ 0.06. Right: SALT2 x1 distribution of the ZTF SN Ia sample.
Current usage metrics show cumulative count of Article Views (full-text article views including HTML views, PDF and ePub downloads, according to the available data) and Abstracts Views on Vision4Press platform.
Data correspond to usage on the plateform after 2015. The current usage metrics is available 48-96 hours after online publication and is updated daily on week days.
Initial download of the metrics may take a while.