Fig. 11.
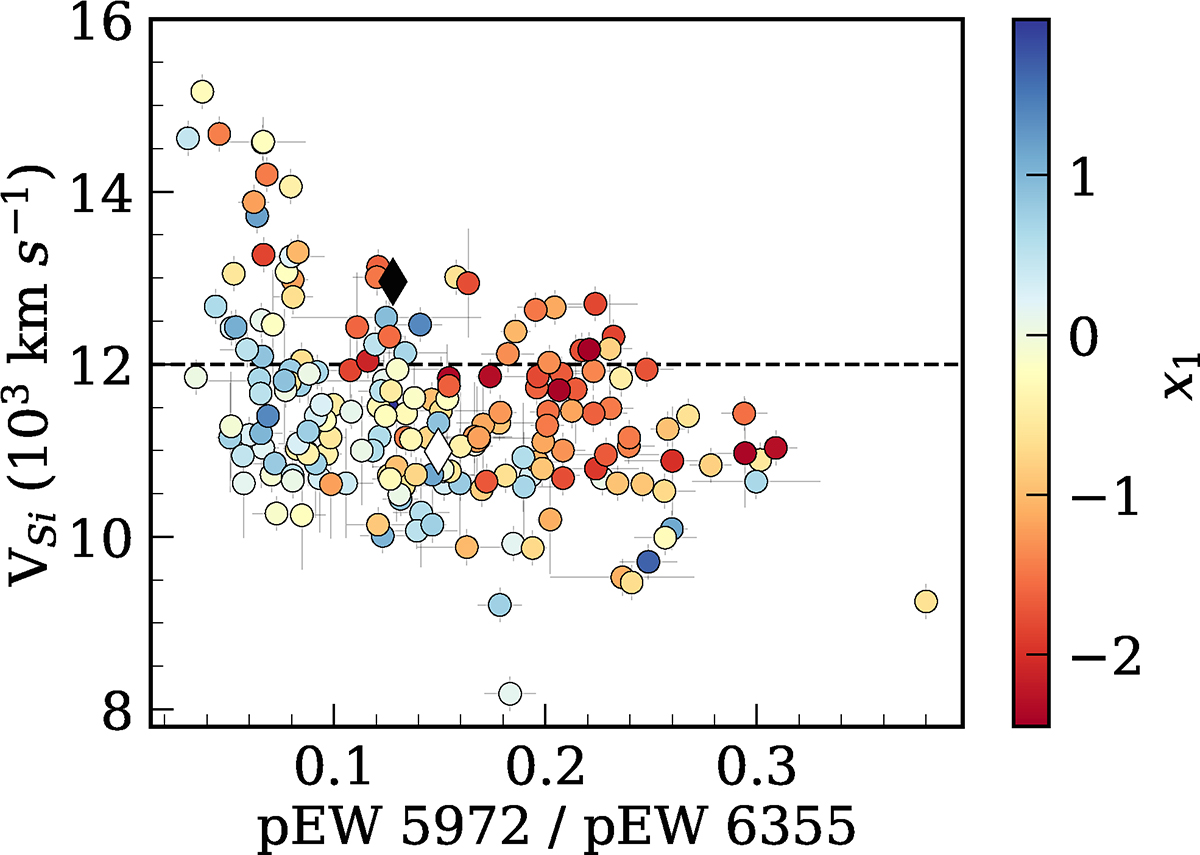
Download original image
Si IIλ6355 velocities plotted against the pEW ratio of Si II features, colour mapped with x1 for the normal SNe Ia in our sample. The black dashed line at vSi = 12 000 km s−1 marks the boundary between HV and NV SNe Ia on the plot. SNe Ia with velocities higher than 12 000 km s−1 are classified as HV SNe Ia, while those below are categorised as NV SNe Ia. The filled and empty black diamond represents the weighted average of HV SNe Ia and NV SNe Ia, respectively.
Current usage metrics show cumulative count of Article Views (full-text article views including HTML views, PDF and ePub downloads, according to the available data) and Abstracts Views on Vision4Press platform.
Data correspond to usage on the plateform after 2015. The current usage metrics is available 48-96 hours after online publication and is updated daily on week days.
Initial download of the metrics may take a while.