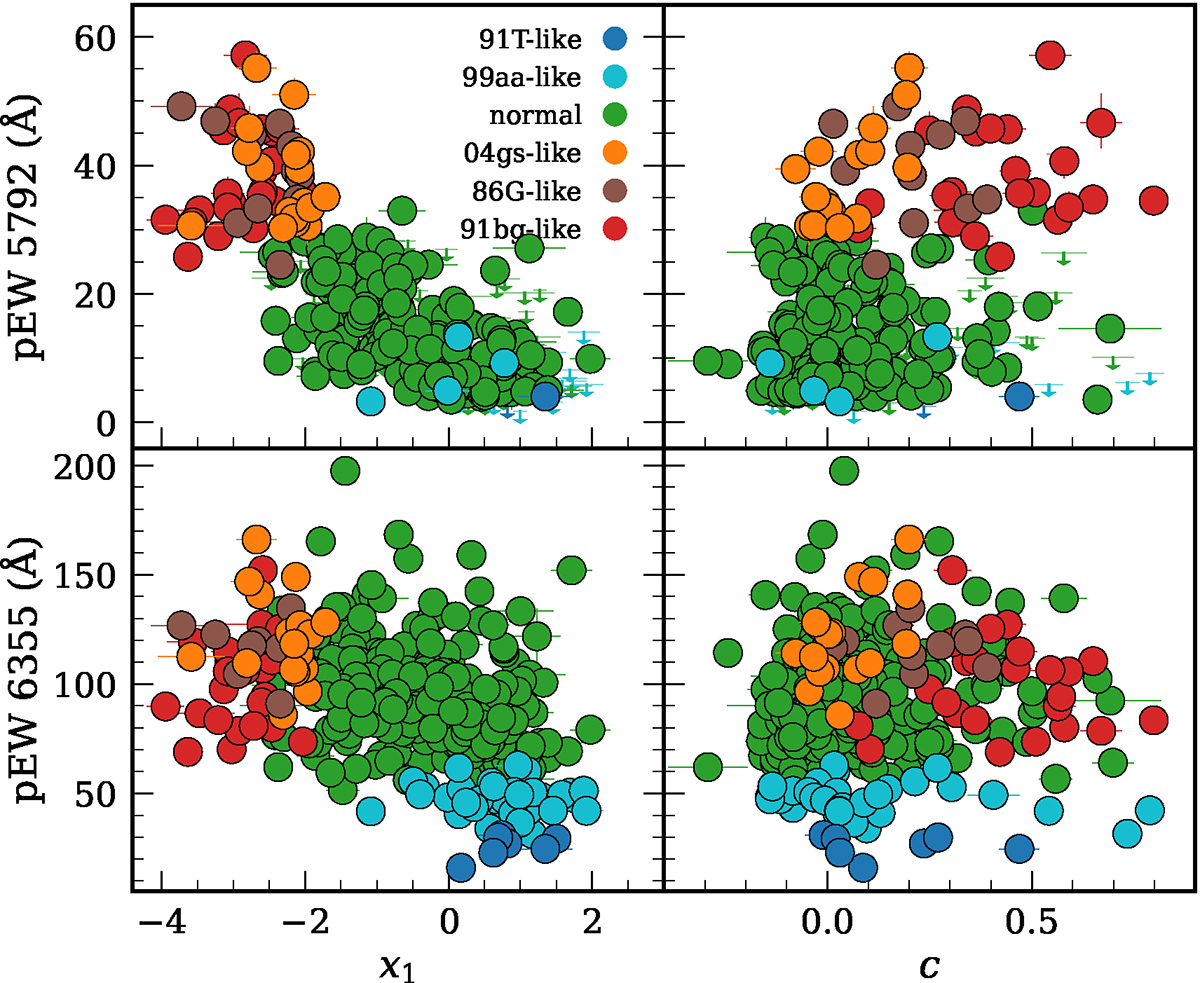
Fig. 12.
Download original image
Correlation between light-curve parameters and Si II pEW in SNe Ia. Top left: Light-curve parameter x1 from SALT2 plotted against the pEW of the Si IIλ5972 feature. The upper limits represent where actual calculations for Si IIλ6355 exist, but 5927 does not. Top right: Same plot as left, but for the light-curve parameter c from SALT2. Bottom left: x1 plotted against the pEW of the Si IIλ6355 feature. Bottom right: Same plot as bottom left, but for c.
Current usage metrics show cumulative count of Article Views (full-text article views including HTML views, PDF and ePub downloads, according to the available data) and Abstracts Views on Vision4Press platform.
Data correspond to usage on the plateform after 2015. The current usage metrics is available 48-96 hours after online publication and is updated daily on week days.
Initial download of the metrics may take a while.