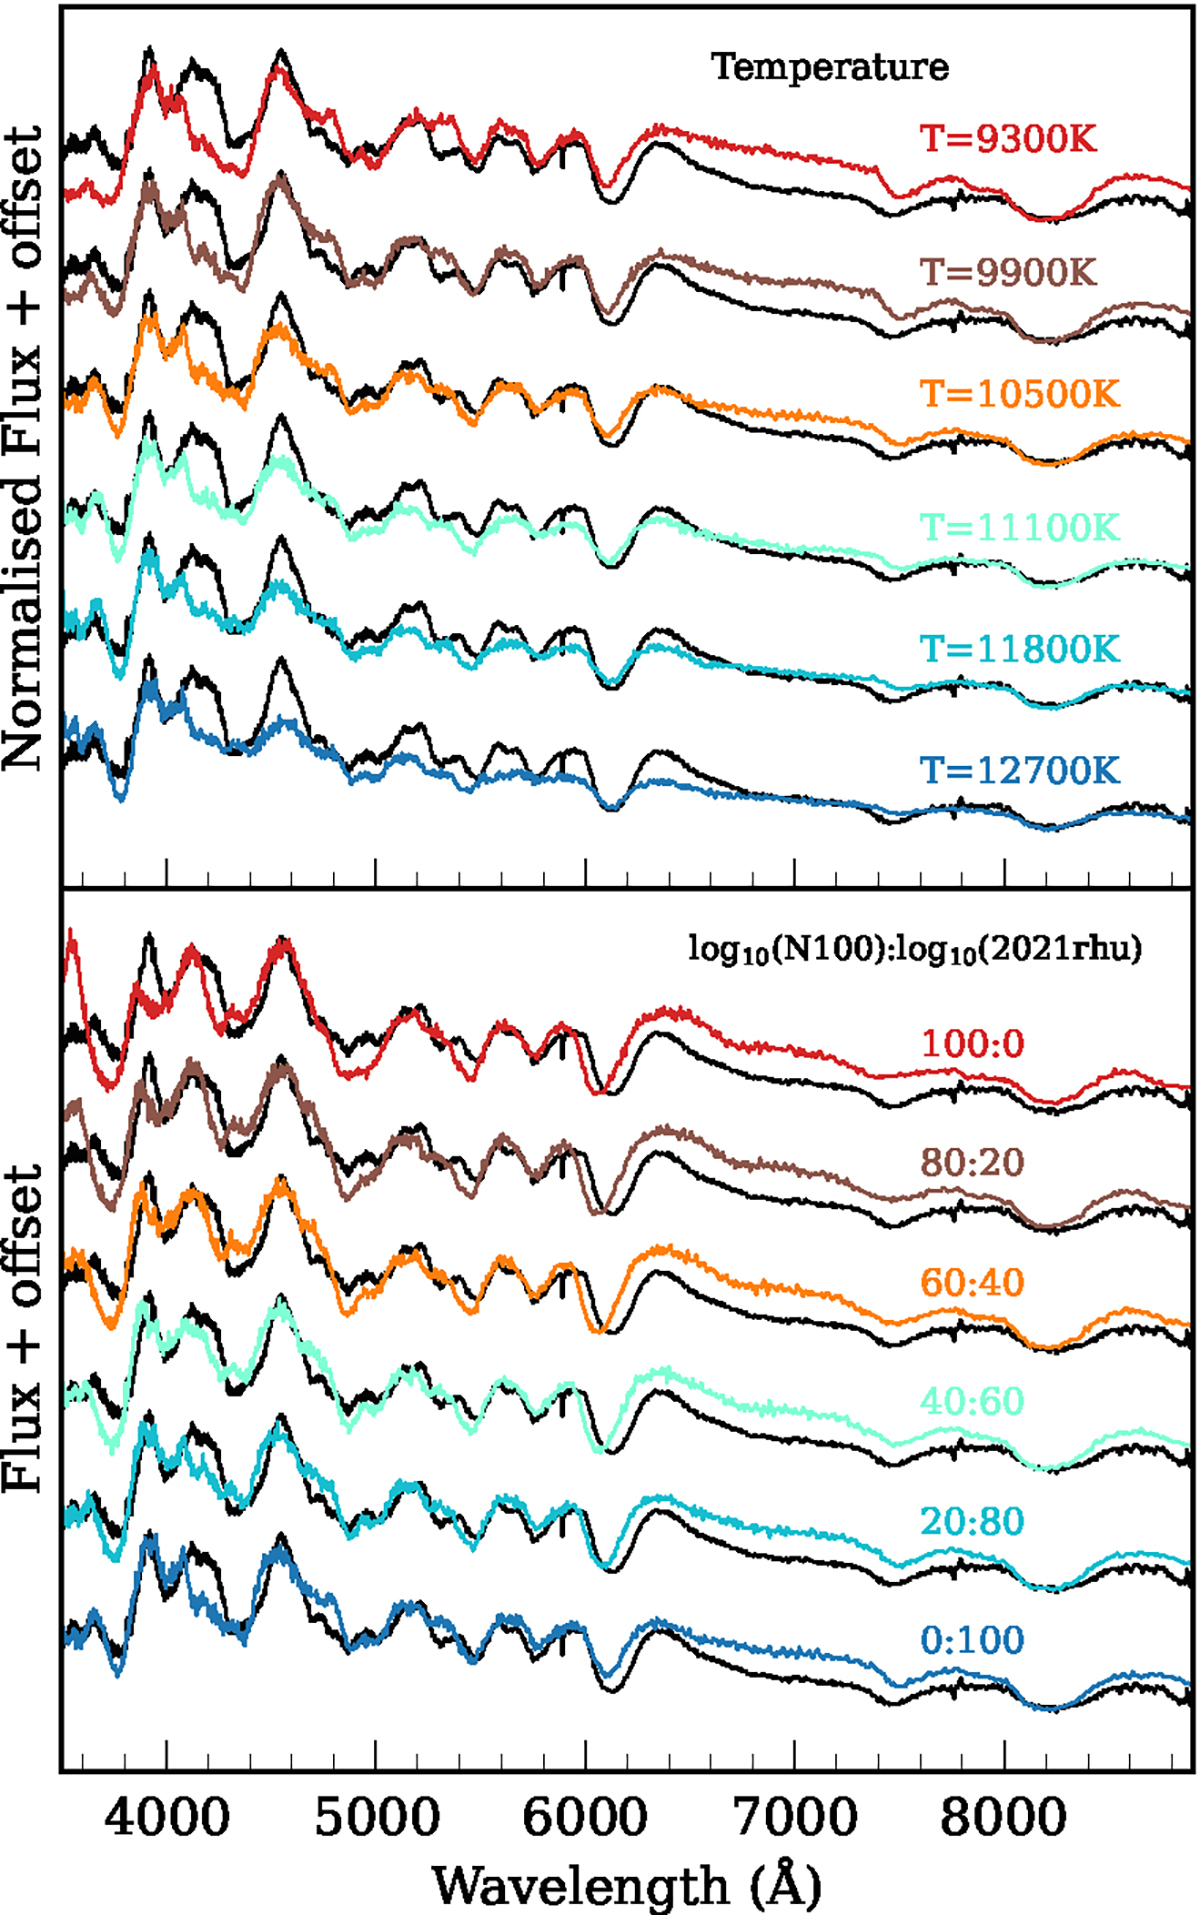
Fig. 9.
Download original image
Effects of temperature and abundance variations in faint SNe Ia. Top: Custom model spectra created for SN 2021rhu compared to a +0.3 d relative to g-band peak spectrum of SN 2004gs (black solid line). Each colour represents a different temperature setting, while keeping the rest of the initial conditions as same. The spectra shown are normalised by their value at 4000 Å to better line up the Ti II and Si II features. It is seen that the varying temperature impacts the strength of the Si IIλ5972 features, but has no considerable impact on the Ti II feature. Bottom: Set of spectral configuration of the N100 model (red) and the custom model created for SN 2021rhu (dark blue). The ratio of each model mixed is shown next to each model spectrum (calculated in log space). The best match of SN 2004gs is with the 40:60 model, which implies that the abundances of the 04gs-like faint SNe Ia are between the transitional 86G-like and the normal SNe Ia. SN 2004gs is less luminous than SN 2021rhu and is slightly cooler, and therefore has a stronger Si IIλ5972 feature.
Current usage metrics show cumulative count of Article Views (full-text article views including HTML views, PDF and ePub downloads, according to the available data) and Abstracts Views on Vision4Press platform.
Data correspond to usage on the plateform after 2015. The current usage metrics is available 48-96 hours after online publication and is updated daily on week days.
Initial download of the metrics may take a while.