Open Access
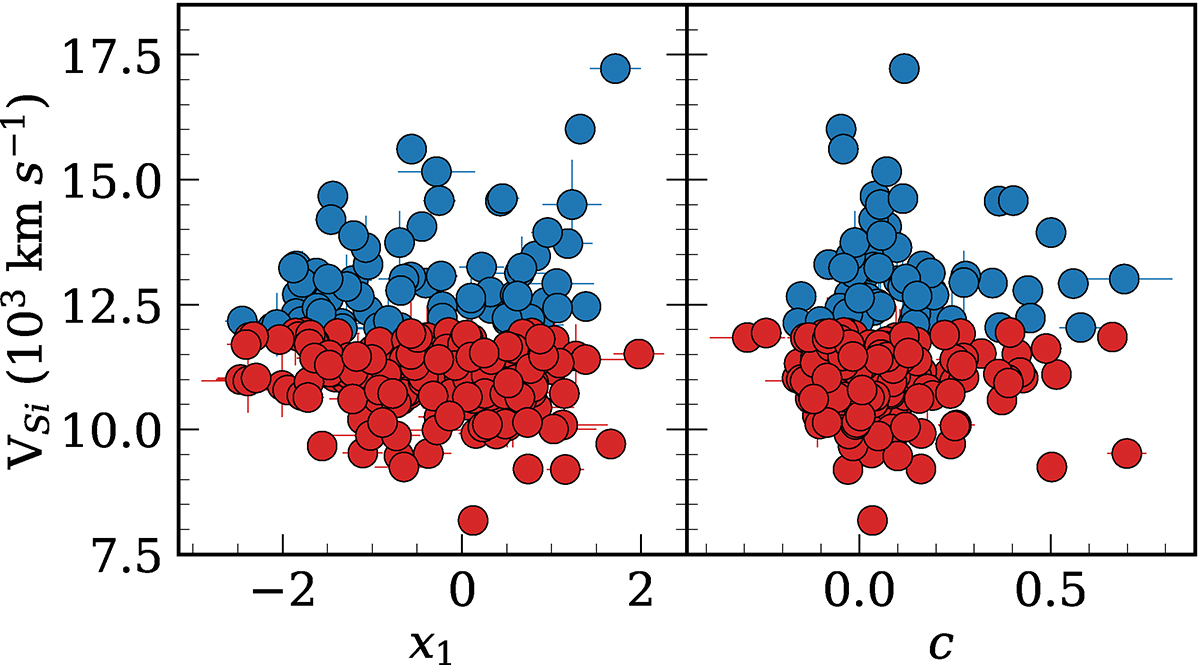
Fig. 10.
Download original image
Si II 6355 velocity plotted against SN light-curve parameters from SALT2, x1, and c. The blue circles represent 66 HV SN Ia and the red circles represent 191 NV SN Ia. All SN Ia in this plot are normal SNe Ia.
Current usage metrics show cumulative count of Article Views (full-text article views including HTML views, PDF and ePub downloads, according to the available data) and Abstracts Views on Vision4Press platform.
Data correspond to usage on the plateform after 2015. The current usage metrics is available 48-96 hours after online publication and is updated daily on week days.
Initial download of the metrics may take a while.