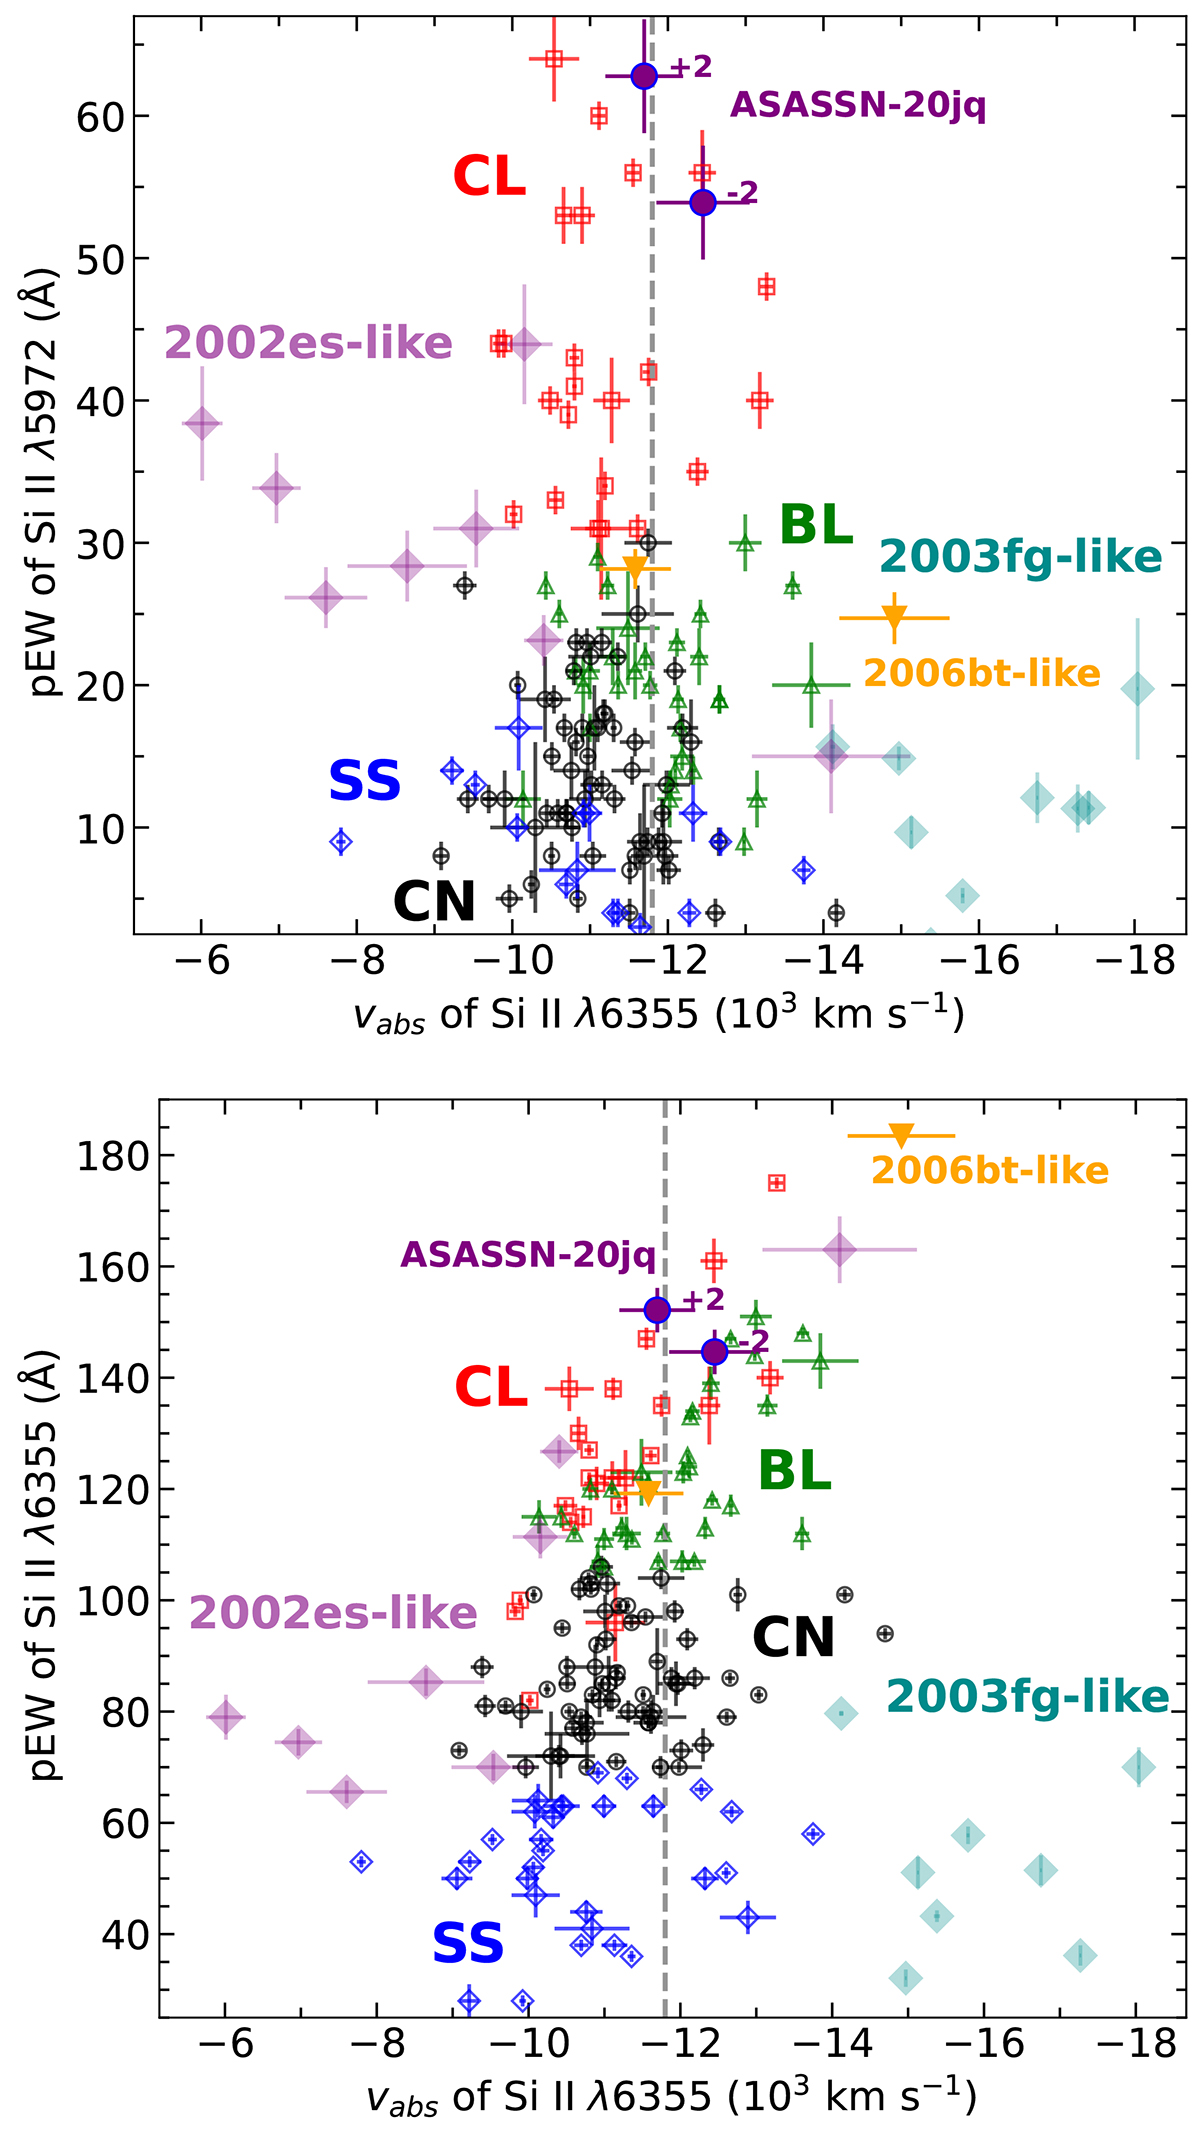
Fig. 13.
Download original image
Wang et al. (2009) diagrams comparing the Si IIλλ5972, 6355 pEW and Doppler velocity (v(Si II)abs) measurements from near maximum spectra of the Carnegie Supernova Project sample (Morrell et al. 2024; Ashall et al. 2021). Measurements made from the two nearest to maximum light spectra of ASASSN-20jq are plotted as purple points, as well as those inferred from nearly a dozen peculiar SNe Ia with commonalities with SN 2002es. Branch types are same as in Fig. 12. The vertical line separates normal and high-velocity SNe Ia as defined by Wang et al. (2009).
Current usage metrics show cumulative count of Article Views (full-text article views including HTML views, PDF and ePub downloads, according to the available data) and Abstracts Views on Vision4Press platform.
Data correspond to usage on the plateform after 2015. The current usage metrics is available 48-96 hours after online publication and is updated daily on week days.
Initial download of the metrics may take a while.