Fig. 18.
Download original image
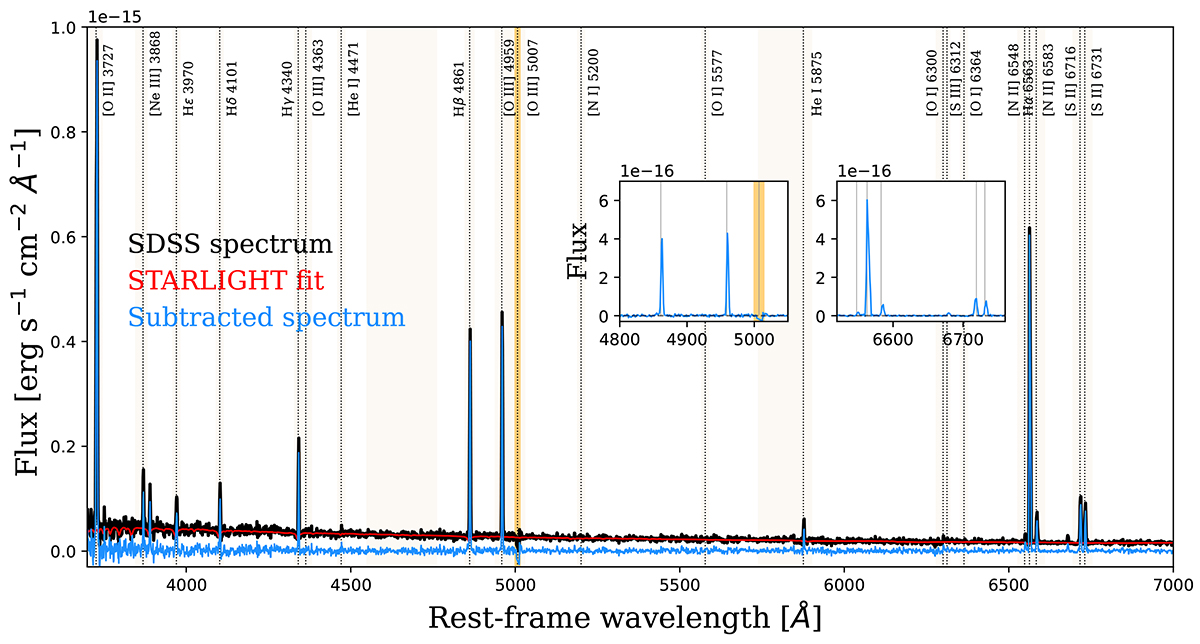
1D spectrum extracted (black line) from an SDSS-II spectral observations of NGC 5002, obtained from a position in proximity to ASASSN-20jq and with prominent nebular emission features from the host marked and labeled. The underlying stellar population is modeled using STARLIGHT (red line) and subtracted from the observed spectrum. The resulting gas-phase spectrum is shown in blue. The most prominent [O III] λ5007 is saturated and therefore masked by a yellow band. A single Gaussian function was fit to the nebular lines plotted within the insets. Flux ratios of these lines combined with the calibrations of Pettini & Pagel (2004) and Dopita et al. (2016) indicate a sub-solar gas-phase metallicity.
Current usage metrics show cumulative count of Article Views (full-text article views including HTML views, PDF and ePub downloads, according to the available data) and Abstracts Views on Vision4Press platform.
Data correspond to usage on the plateform after 2015. The current usage metrics is available 48-96 hours after online publication and is updated daily on week days.
Initial download of the metrics may take a while.