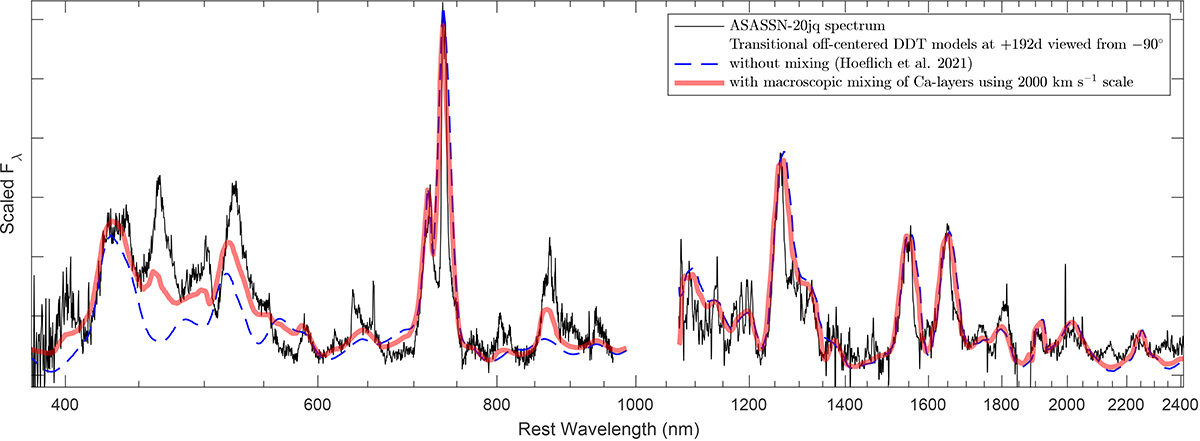
Fig. 20.
Download original image
Spectral synthesis model of the optical and NIR nebular spectrum. The optical spectrum was obtained on +229 days and the NIR spectrum on +192 days (Hoeflich et al. 2021). Over-plotted in blue is the synthetic spectrum computed from a MCh C + O WD disrupted following an off-centered delayed detonation explosion. This model is computed with a viewing angle of −90° as defined by the schematic in Fig. 19. At the blue end of the optical spectrum the model underestimates the flux of several Fe II+ Fe III complexes. After recomputing the explosion model with the addition of a 2000 km s−1 macroscopic mixing scale of the 56Ni-Fe into the lower density Ca-layer (see Fig. B.1), we obtain the synthetic spectrum shown in red. The mixing model better reproduces the [Fe II], [Fe III], [Co II], and [Co III] line complexes between ∼4000 − 6000 Å and ∼8500 − 9000 Å. The observed spectra have been scaled arbitrarily to match the model results.
Current usage metrics show cumulative count of Article Views (full-text article views including HTML views, PDF and ePub downloads, according to the available data) and Abstracts Views on Vision4Press platform.
Data correspond to usage on the plateform after 2015. The current usage metrics is available 48-96 hours after online publication and is updated daily on week days.
Initial download of the metrics may take a while.