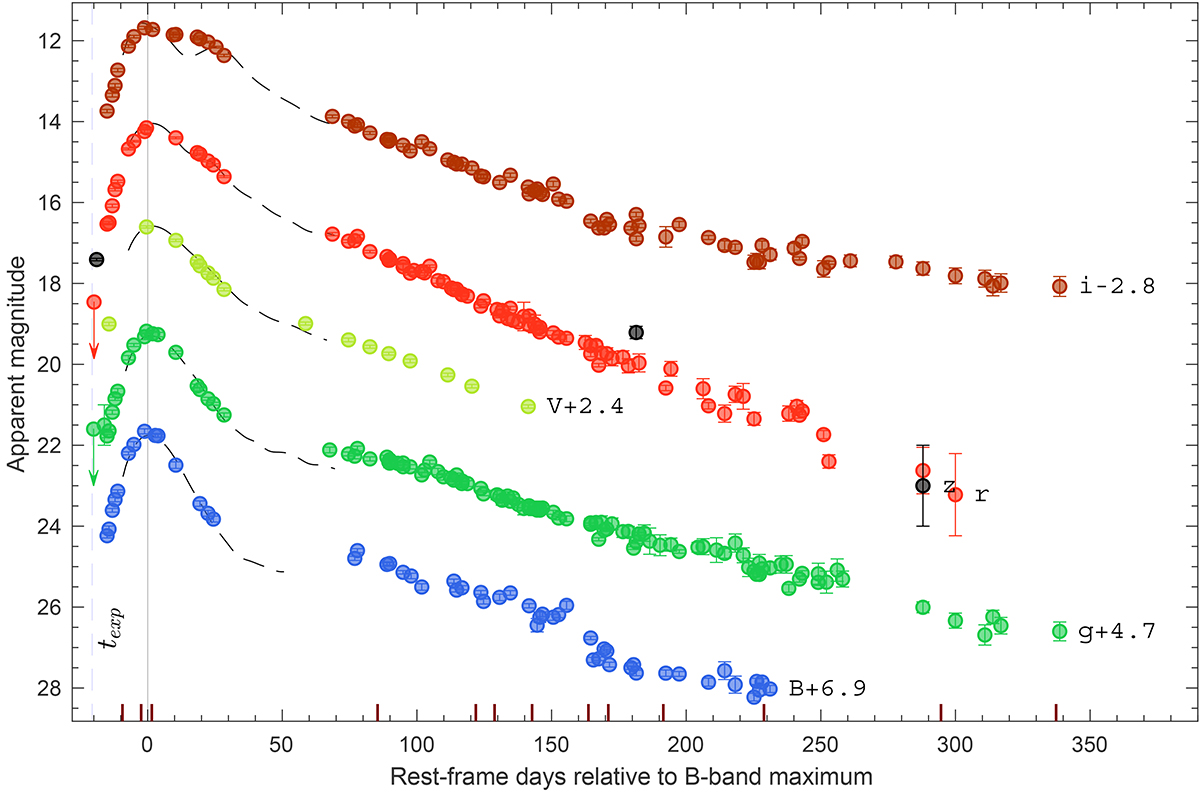
Fig. 2.
Download original image
Optical BgVriz-band light curves of ASASSN-20jq along with “max_model” template light curve fits (black dashed lines) computed by SNooPy (Burns et al. 2011). The indicated offsets have been added to the light curves for clarity. Epochs of spectral observations are marked by vertical bars at the bottom, the epoch of the B-band maximum is indicated with a black vertical line, and the explosion epoch is marked by a blue vertical dashed line.
Current usage metrics show cumulative count of Article Views (full-text article views including HTML views, PDF and ePub downloads, according to the available data) and Abstracts Views on Vision4Press platform.
Data correspond to usage on the plateform after 2015. The current usage metrics is available 48-96 hours after online publication and is updated daily on week days.
Initial download of the metrics may take a while.