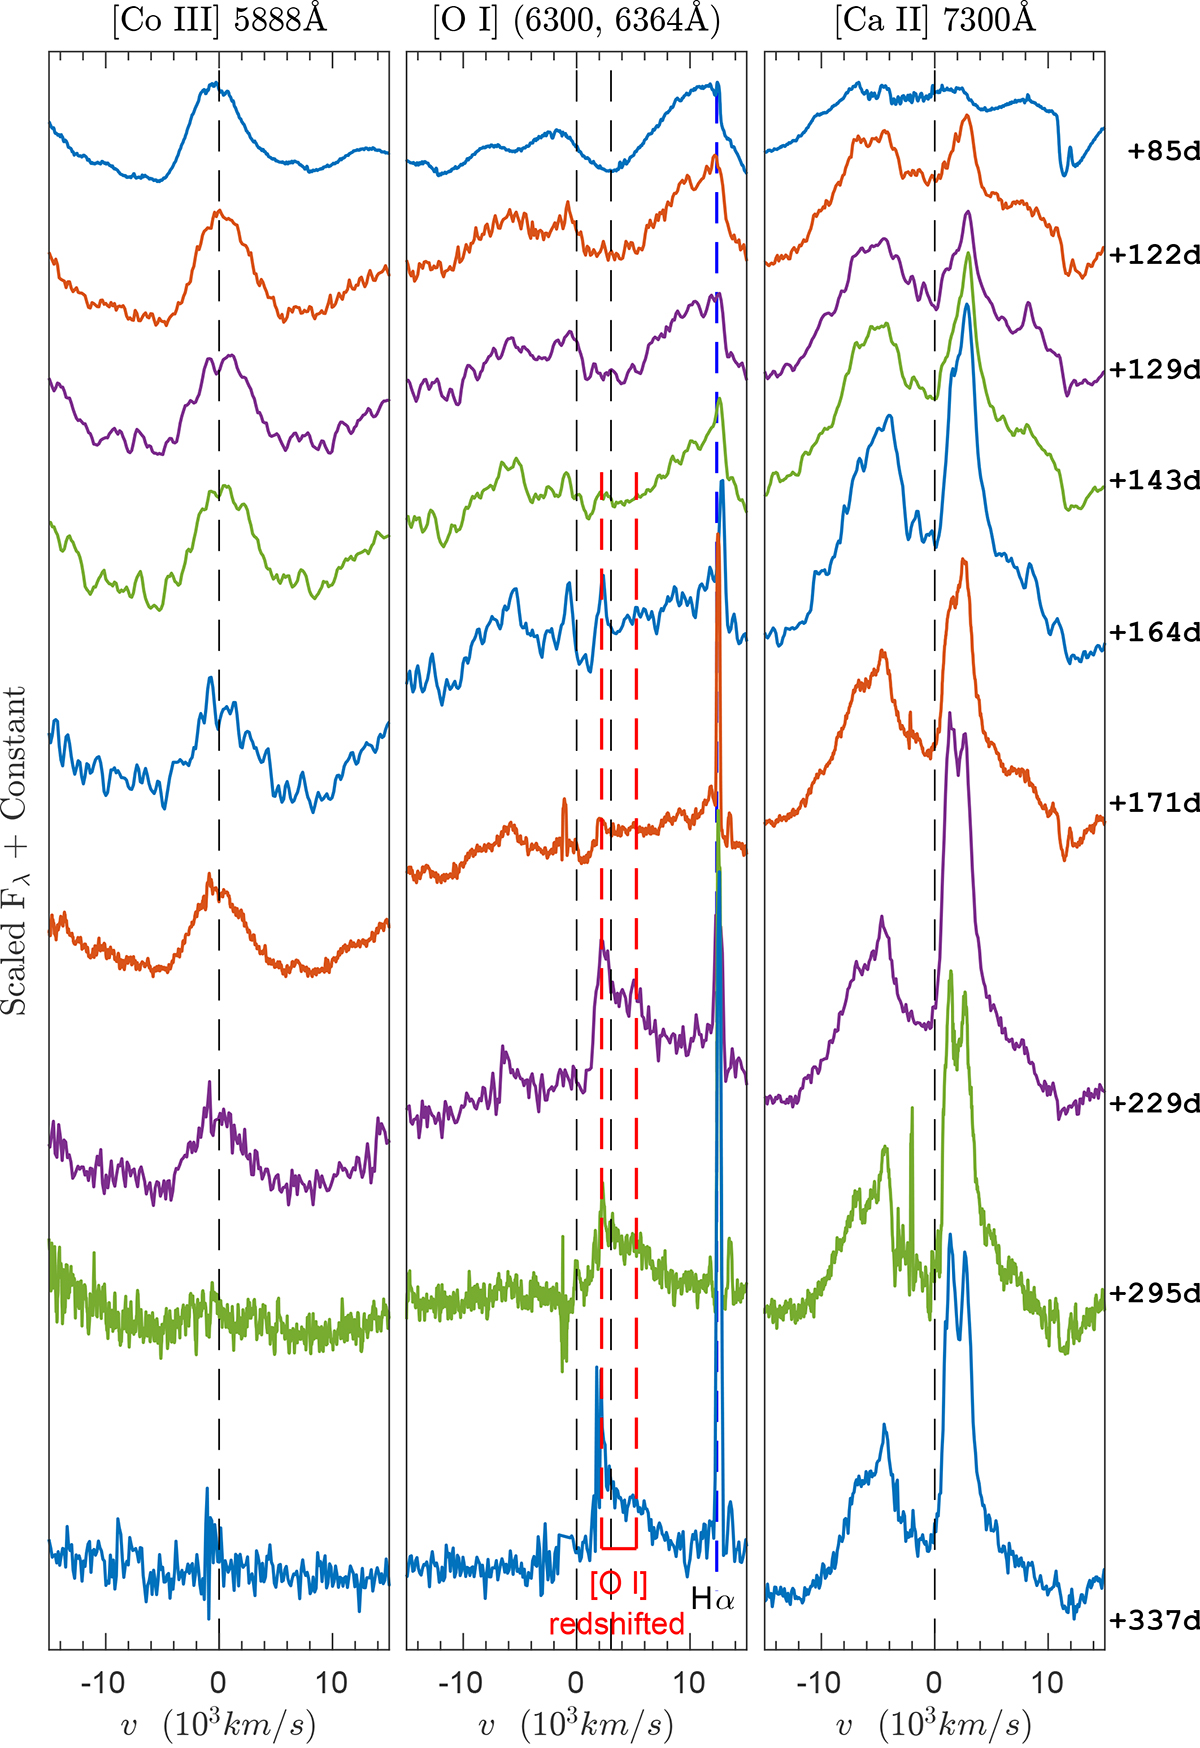
Fig. 15.
Download original image
Post-maximum (+85 to +337 days) spectra of ASASSN-20jq plotted in velocity domain with respect to the rest wavelengths, as indicated on top of figure panels, of [Co III] (left), [O I] (middle) and [Ca II] (right) lines. The pair of the black dashed lines in the middle panel represents the rest-positions of the [O I] doublet components. The pair of red-dashed lines represent the position of the [O I] doublet redshifted by 2200 km s−1 to best match the observed feature beyond +229 d. The [Ca II] doublet in right panel shows a systematic redshift of ≈1700 km s−1 throughout the evolution.
Current usage metrics show cumulative count of Article Views (full-text article views including HTML views, PDF and ePub downloads, according to the available data) and Abstracts Views on Vision4Press platform.
Data correspond to usage on the plateform after 2015. The current usage metrics is available 48-96 hours after online publication and is updated daily on week days.
Initial download of the metrics may take a while.