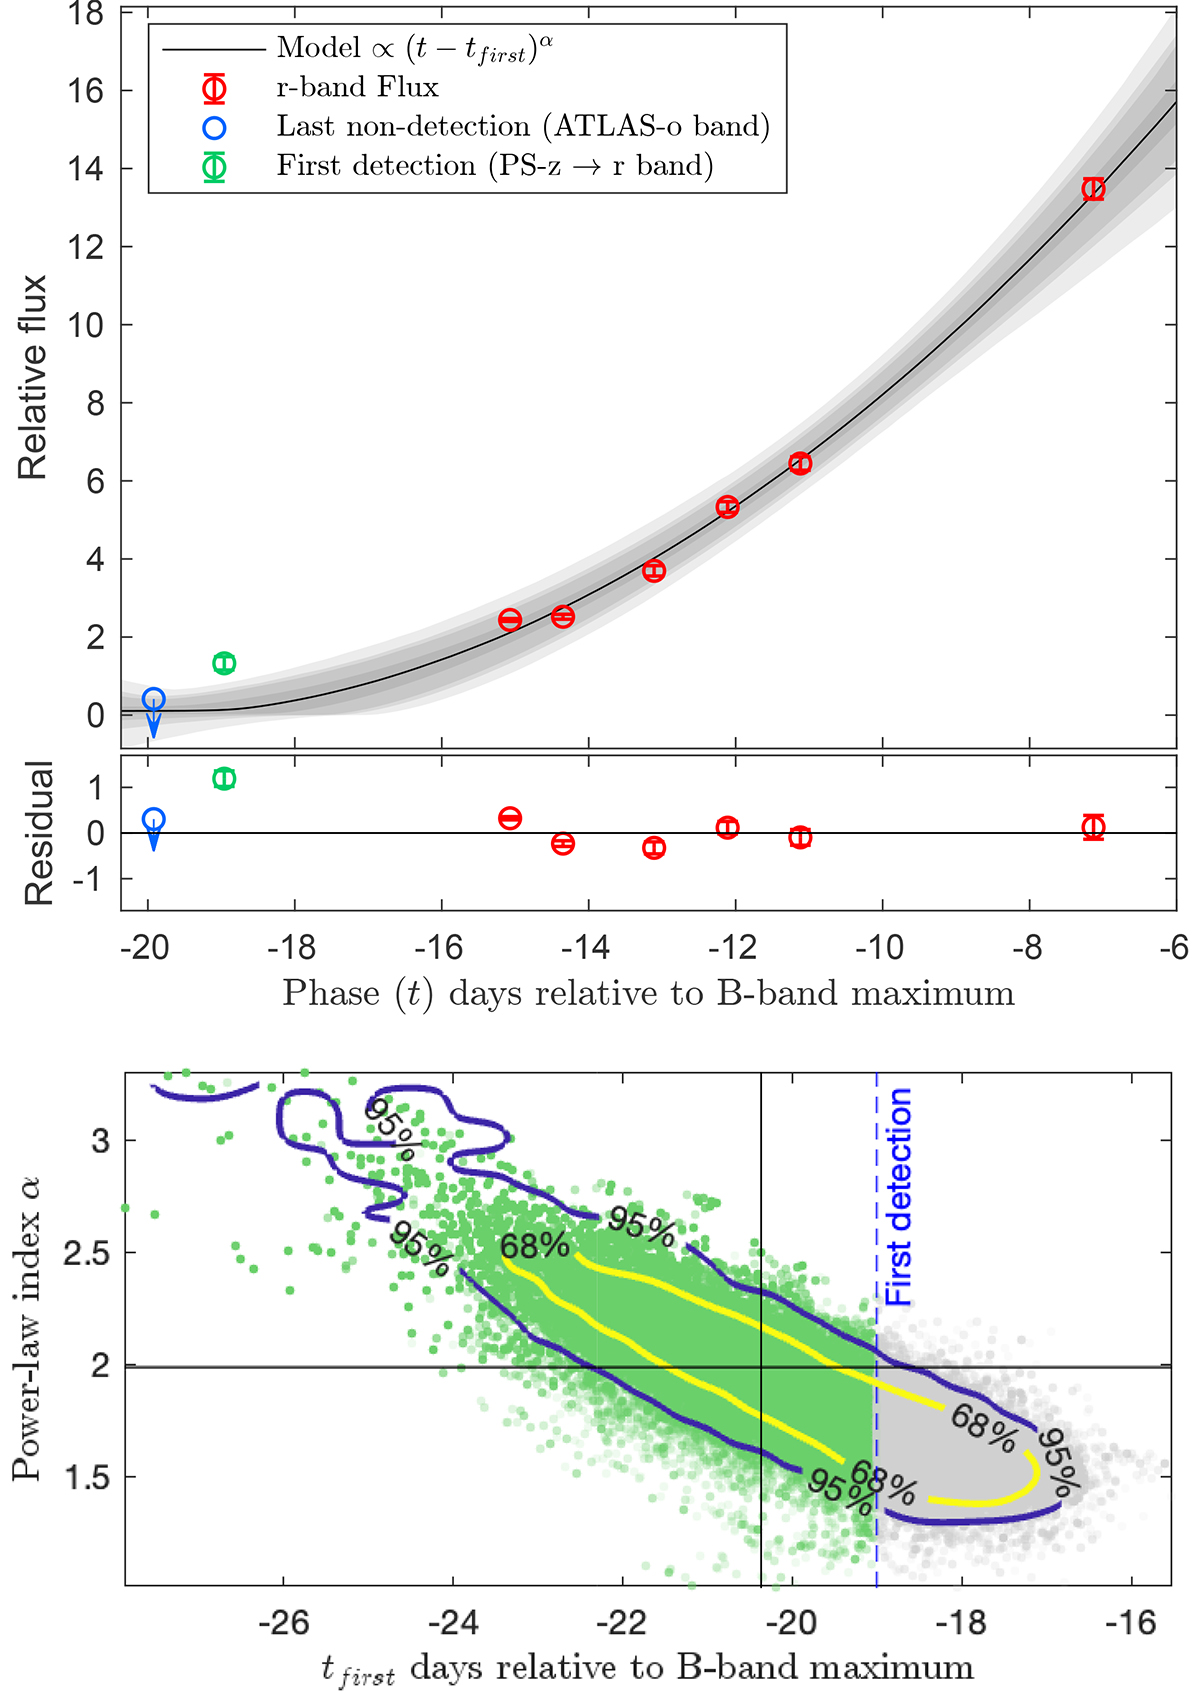
Fig. 4.
Download original image
Top panel: Early-time r-band light curve of ASASSN-20jq. This also includes the first photometric detection of ASASSN-20jq made by PS in the z band, which has been S-corrected to the SDSS r-band system. Also plotted is the ATLAS o-band nondetection limit reported previously. Overplotted the r-band light curve is the best MCMC-fit of a single power-law function (solid curve) with inferred probability limits (shaded region). Bottom panel: 2D probability density of MCMC sample between the fit parameters – time of first light tfirst and power-law index α. Having a confirmed detection at −19 days (vertical blue dashed line), only the region in green is valid parameter space. The contours correspond to 68% and 95% confidence intervals. The solid black lines indicate the mean of the MCMC sample for parameters tfirst = −20.4 days (vertical) and α = 1.99 (horizontal).
Current usage metrics show cumulative count of Article Views (full-text article views including HTML views, PDF and ePub downloads, according to the available data) and Abstracts Views on Vision4Press platform.
Data correspond to usage on the plateform after 2015. The current usage metrics is available 48-96 hours after online publication and is updated daily on week days.
Initial download of the metrics may take a while.