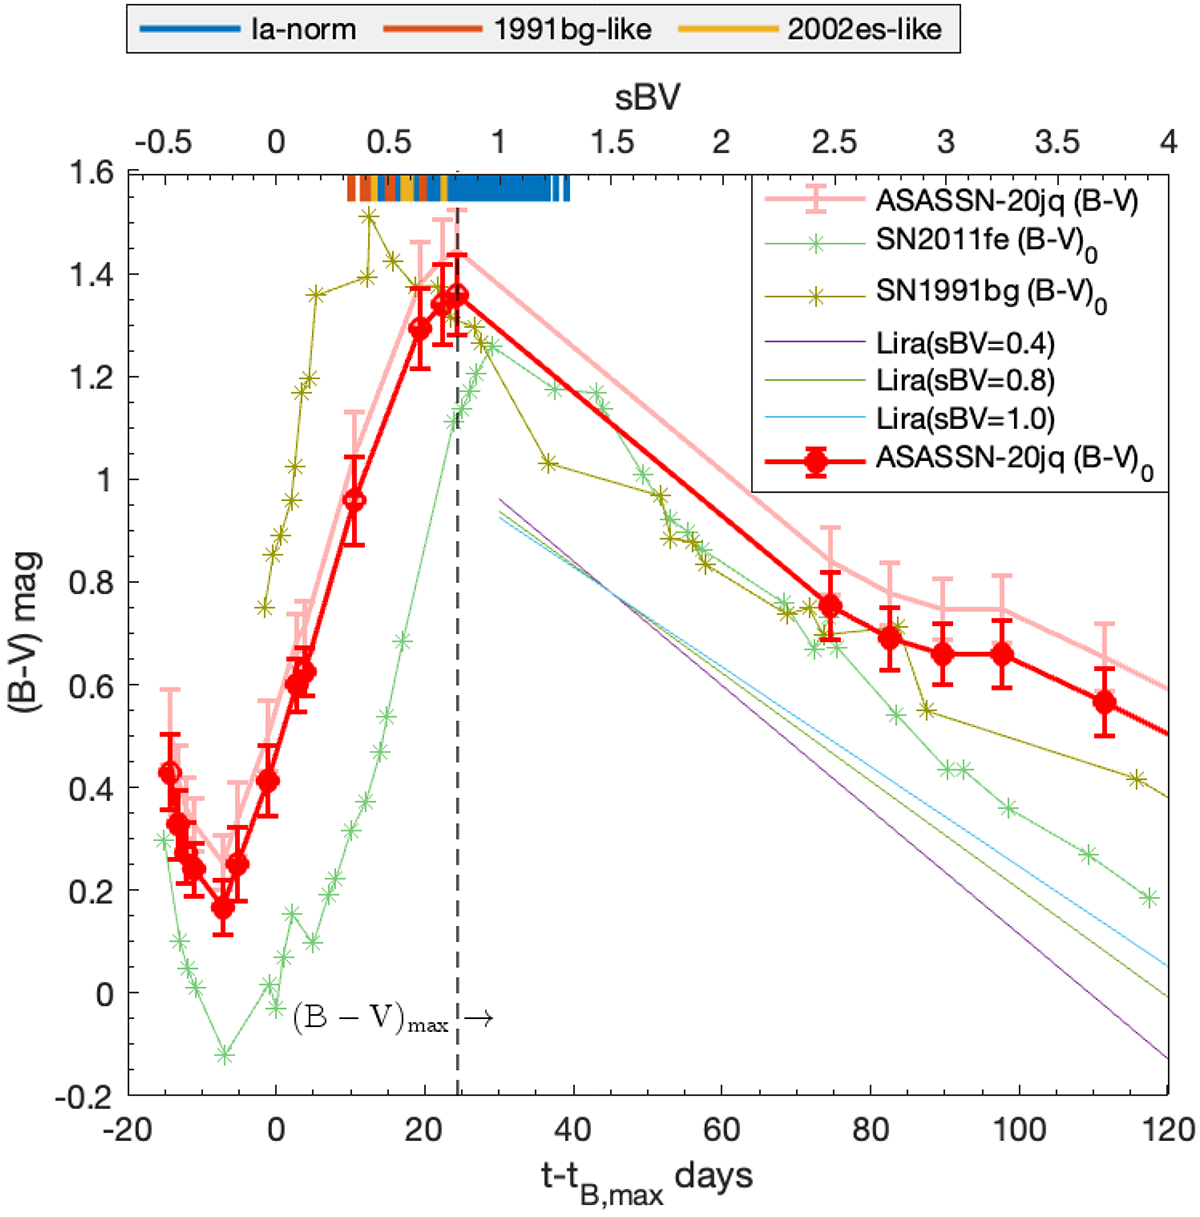
Fig. 6.
Download original image
Apparent (B − V) and intrinsic (B − V)0 color evolution of ASASSN-20jq. The intrinsic color evolution of the normal SN 2011fe (Richmond & Smith 2012), the low-luminosity SN 1991bg (Turatto et al. 1996), and the Lira relation for different sBV values (Burns et al. 2014) are also plotted. To construct the color-curve of ASASSN-20jq, the B- and V-band light curves were interpolated with low-order splines which were then evaluated at the same epochs. The vertical dashed line marks the lower limit of the time of B−V maximum of ASASSN-20jq as the data only captures the rising part of the color curve. The vertical bars at the top of the figure indicate the range of sBV values for the SNe Ia-normal, 1991bg-like, and 2002es-like samples populating the luminosity versus sBV diagram presented in Fig. 8.
Current usage metrics show cumulative count of Article Views (full-text article views including HTML views, PDF and ePub downloads, according to the available data) and Abstracts Views on Vision4Press platform.
Data correspond to usage on the plateform after 2015. The current usage metrics is available 48-96 hours after online publication and is updated daily on week days.
Initial download of the metrics may take a while.