Fig. 2.
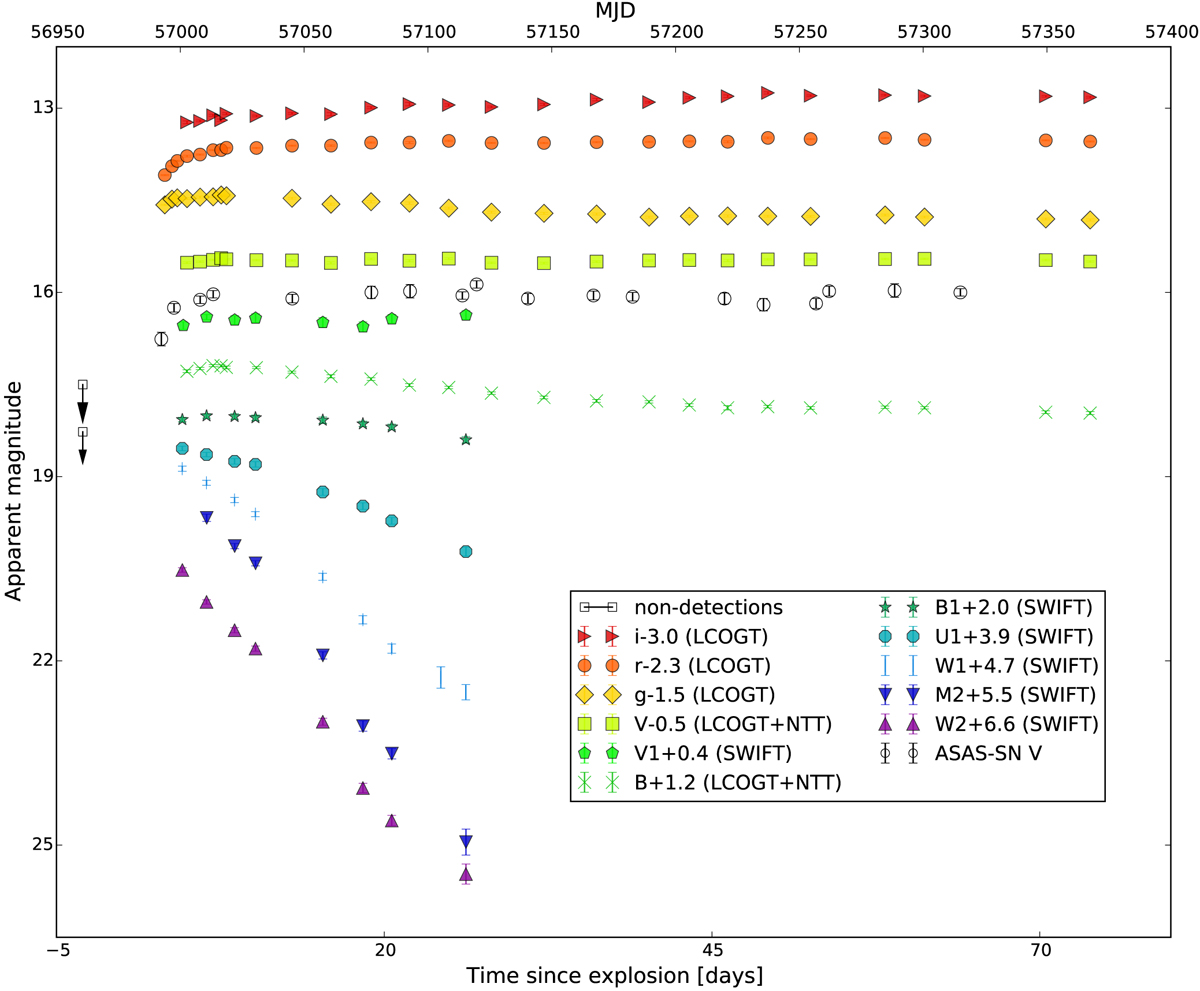
ASAS-SN V, LCOGTN BVgri, and Swift/UVOT w2, m1, w1, ubv, light curves of ASASSN-14jb. Each band has been shifted to the value showed in the label for presentation purposes. The observed time is given in days since the estimated explosion epoch t0 = 56946.1 (MJD) in the bottom x-axis and in MJD in the top axis. The black squares are the non-detection derived from the ASAS-SN V-band images.
Current usage metrics show cumulative count of Article Views (full-text article views including HTML views, PDF and ePub downloads, according to the available data) and Abstracts Views on Vision4Press platform.
Data correspond to usage on the plateform after 2015. The current usage metrics is available 48-96 hours after online publication and is updated daily on week days.
Initial download of the metrics may take a while.