Free Access
Fig. 10.
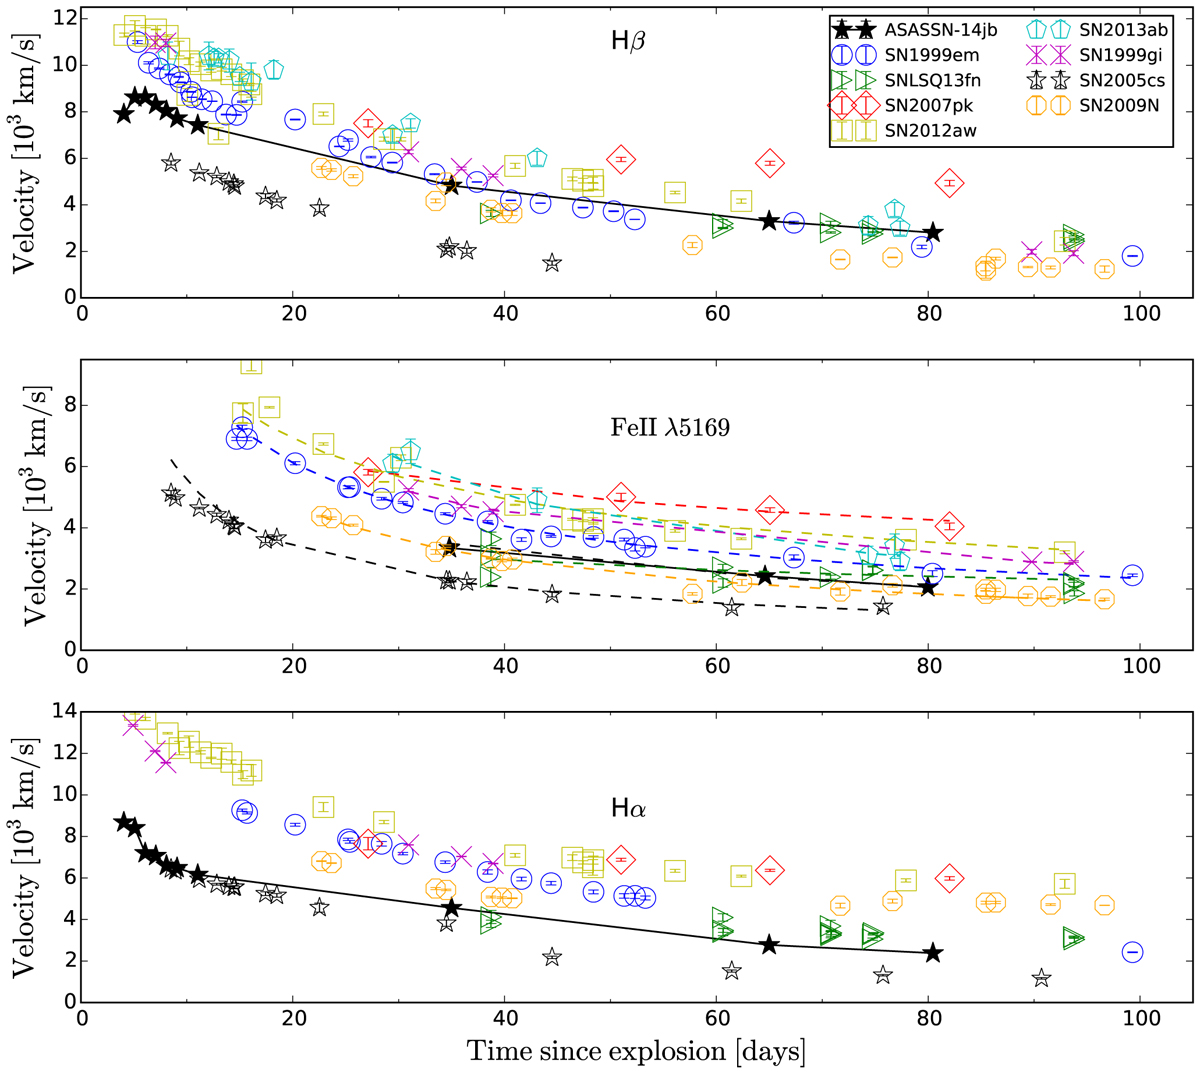
Expansion velocities of the Hβ (top), Fe II λ5169 (middle), and Hα (bottom) lines as a function of time after explosion in the plateau phase, measured from the P-cygni profile minima of the Balmer lines Hα, Hβ and the Fe II λ5169 line for ASASSN-14jb (black filled stars) and the Type II SNe comparison sample.
Current usage metrics show cumulative count of Article Views (full-text article views including HTML views, PDF and ePub downloads, according to the available data) and Abstracts Views on Vision4Press platform.
Data correspond to usage on the plateform after 2015. The current usage metrics is available 48-96 hours after online publication and is updated daily on week days.
Initial download of the metrics may take a while.