Fig. 22.
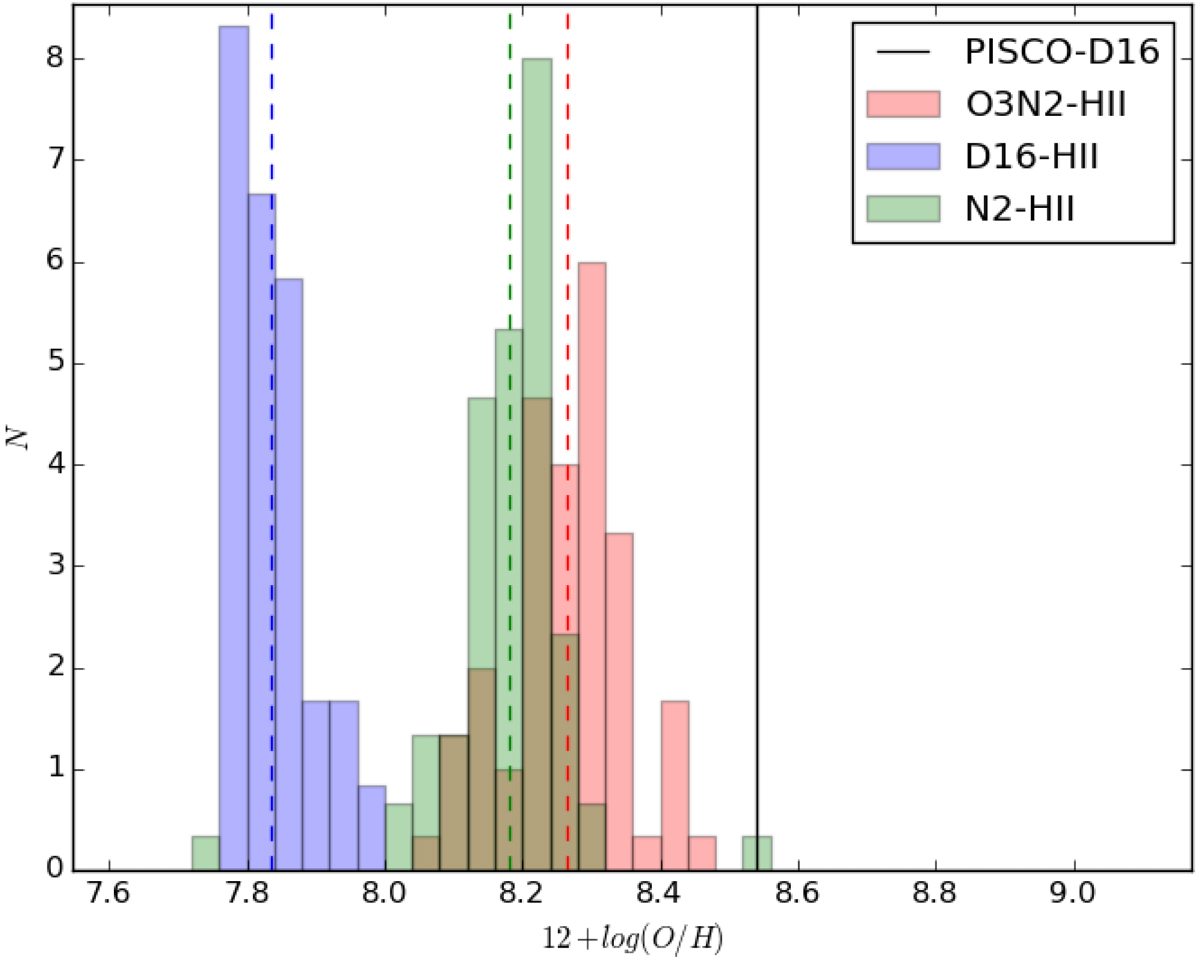
Distribution of the gas-phase oxygen abundances used for ESO 467-G051 H II regions, based on the D16, O3N2 and N2 calibrations. The dashed lines represent the median for each distribution and the black vertical line indicates the average abundance for Type II SNe hosts from the PISCO compilation using the D16 calibration (Galbany et al. 2018).
Current usage metrics show cumulative count of Article Views (full-text article views including HTML views, PDF and ePub downloads, according to the available data) and Abstracts Views on Vision4Press platform.
Data correspond to usage on the plateform after 2015. The current usage metrics is available 48-96 hours after online publication and is updated daily on week days.
Initial download of the metrics may take a while.