Fig. B.1.
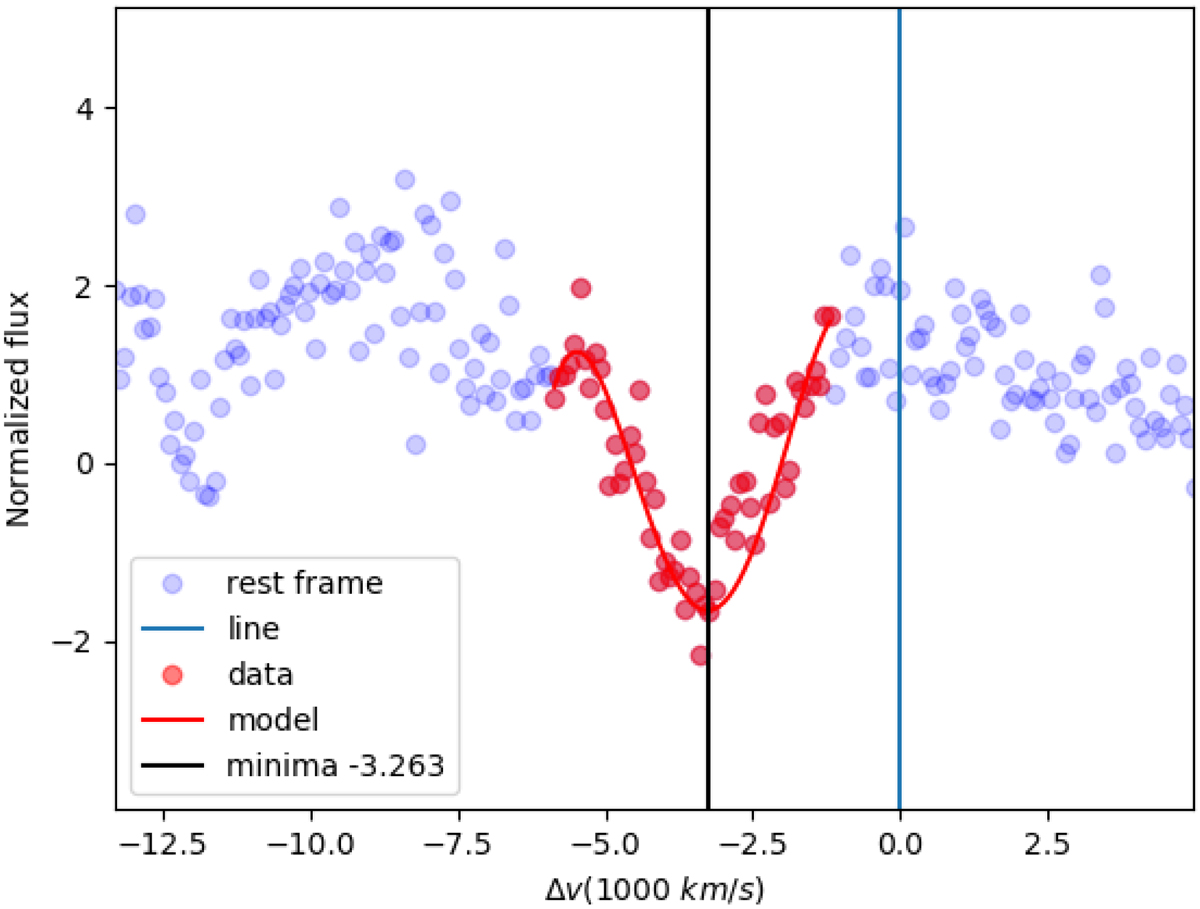
Example of a P-Cygni profile fit. The x-axis is in units of 1000 km s−1. The blue dots are the data points for the normalized spectra and the red points are the points actually used for the fitting procedure. The vertical line marks the position of the final velocity adopted and the cyan vertical indicates zero velocity at the line position.
Current usage metrics show cumulative count of Article Views (full-text article views including HTML views, PDF and ePub downloads, according to the available data) and Abstracts Views on Vision4Press platform.
Data correspond to usage on the plateform after 2015. The current usage metrics is available 48-96 hours after online publication and is updated daily on week days.
Initial download of the metrics may take a while.