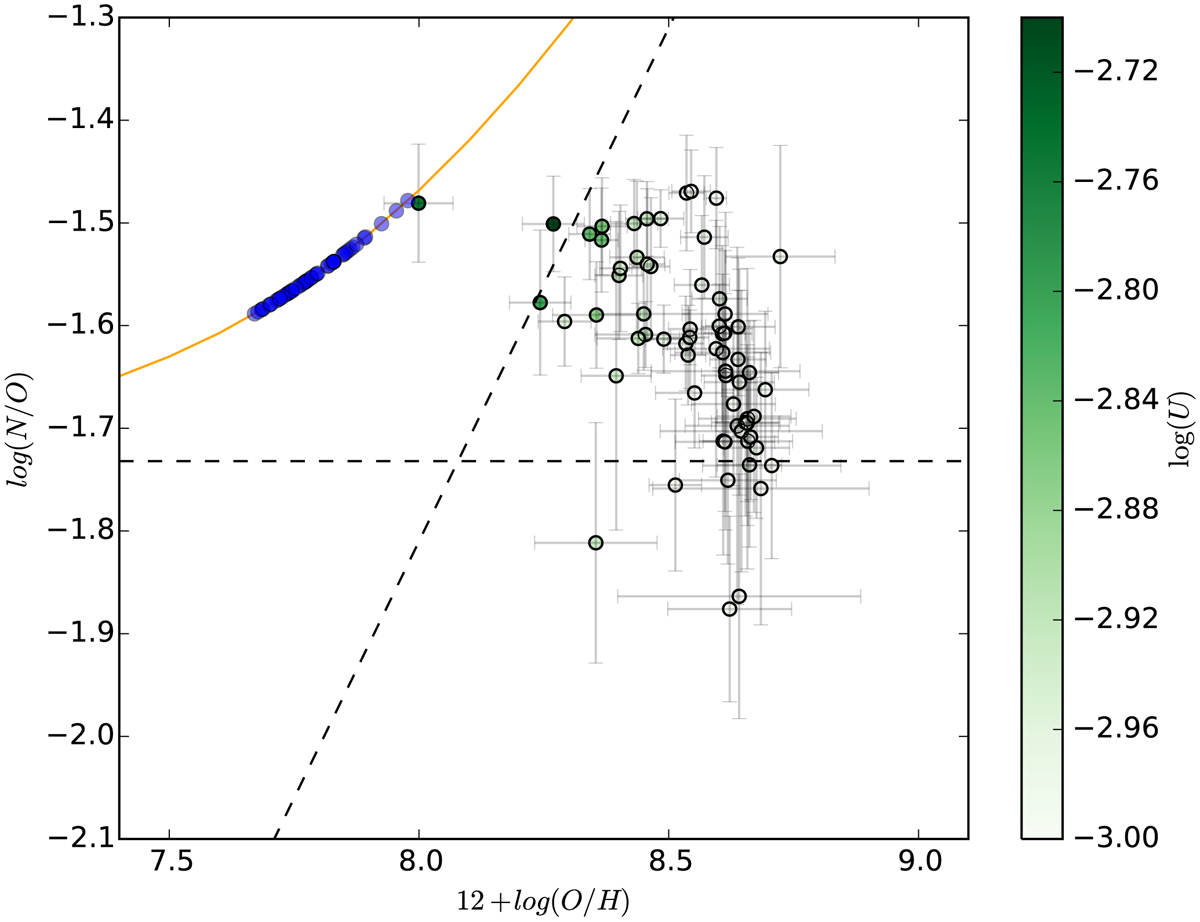
Fig. 23.

Oxygen abundances versus N/O ratios obtained with the code developed in Pérez-Montero (2014). Each point has the errorbars delivered by the code and each point is colored according to the ionization parameter U delivered. The solid orange line indicates the relation as assumed in the D16 calibration and the blue dots correspond to the observed values for our H II regions abundances using D16. The dashed lines indicate the asymptotes for orange line, at the very high and very low O/H ratios regimes.
Current usage metrics show cumulative count of Article Views (full-text article views including HTML views, PDF and ePub downloads, according to the available data) and Abstracts Views on Vision4Press platform.
Data correspond to usage on the plateform after 2015. The current usage metrics is available 48-96 hours after online publication and is updated daily on week days.
Initial download of the metrics may take a while.


