Fig. 4.
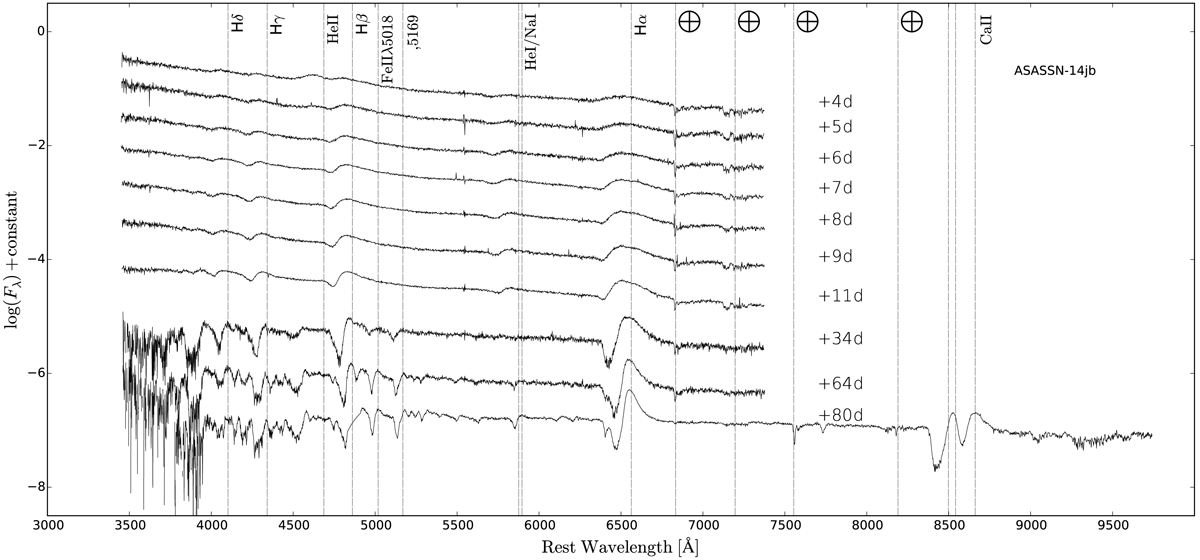
Full rest frame spectroscopic time series, on a logarithmic scale, for ASASSN-14jb in the photospheric phase (up to 80 days past explosion). The time next to each spectrum, in days, is measured since the estimated time of explosion t0 = 56946.1 ± 3 (MJD). The vertical lines show the wavelengths of the some of the main features in the spectra of type II SNe. Lines with the ⨁ symbol represent the position of strong telluric absorptions.
Current usage metrics show cumulative count of Article Views (full-text article views including HTML views, PDF and ePub downloads, according to the available data) and Abstracts Views on Vision4Press platform.
Data correspond to usage on the plateform after 2015. The current usage metrics is available 48-96 hours after online publication and is updated daily on week days.
Initial download of the metrics may take a while.