Fig. 21.
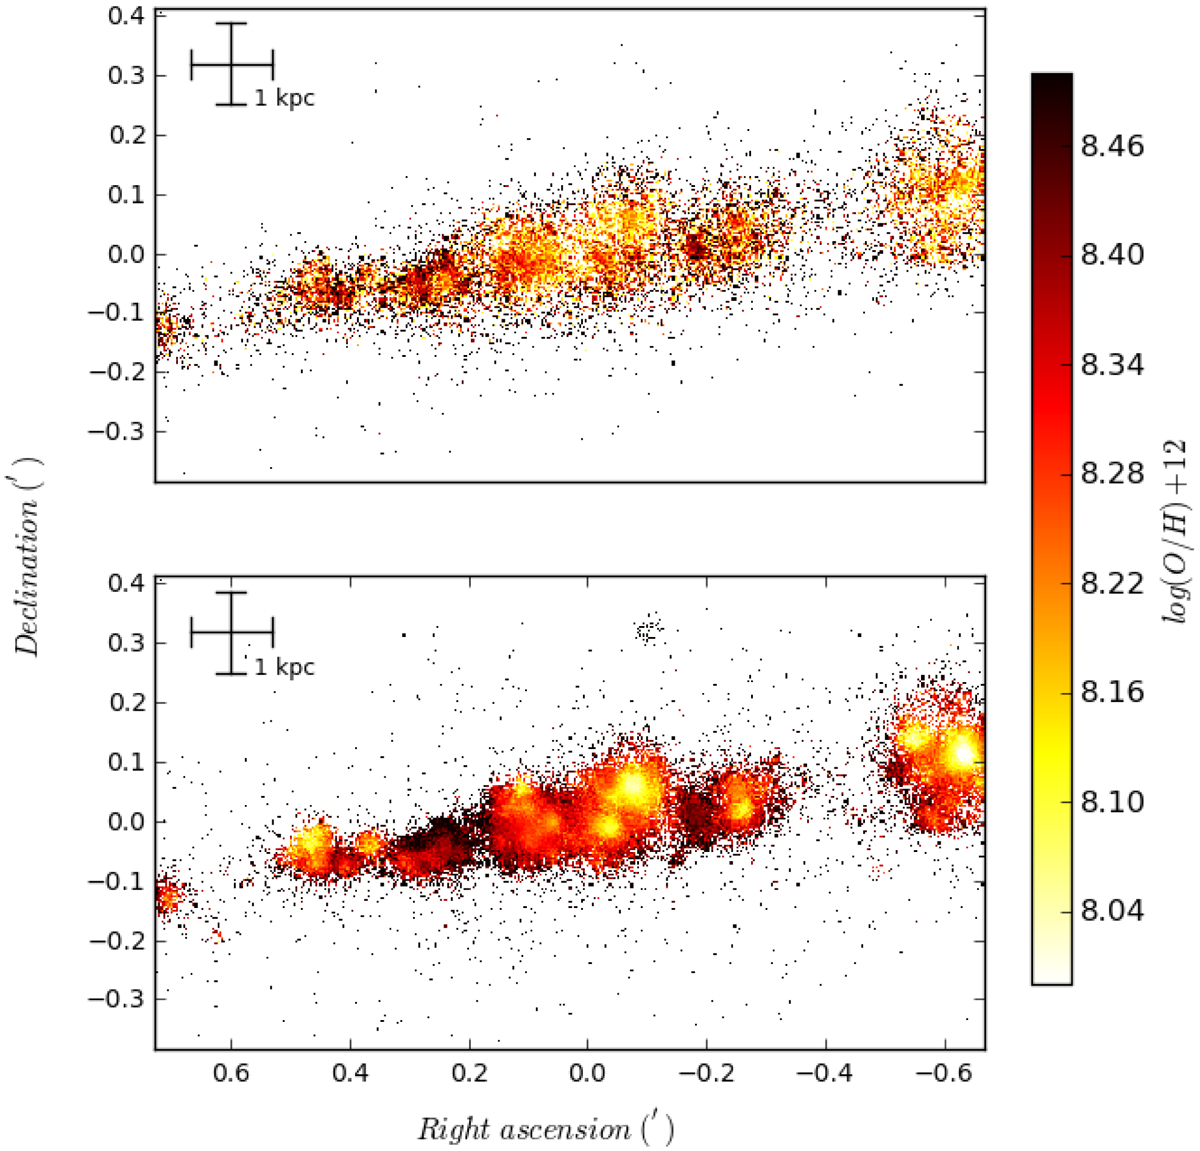
D16 (top) and O3N2 (bottom) oxygen abundance maps of the host galaxy ESO467-G051 as seen by MUSE, shifting the D16 map by +0.4 dex to provide an easier comparison. Coordinates are the right ascension and declination offsets from the center of ESO 467-G051, in arc-minutes. The 1 kpc scale of the image is marked in the upper left.
Current usage metrics show cumulative count of Article Views (full-text article views including HTML views, PDF and ePub downloads, according to the available data) and Abstracts Views on Vision4Press platform.
Data correspond to usage on the plateform after 2015. The current usage metrics is available 48-96 hours after online publication and is updated daily on week days.
Initial download of the metrics may take a while.