| Issue |
A&A
Volume 599, March 2017
|
|
|---|---|---|
| Article Number | A101 | |
| Number of page(s) | 16 | |
| Section | Interstellar and circumstellar matter | |
| DOI | https://doi.org/10.1051/0004-6361/201629452 | |
| Published online | 09 March 2017 | |
Robustness of N2H+ as tracer of the CO snowline
1 Leiden Observatory, Leiden University, PO box 9513, 2300 RA Leiden, The Netherlands
e-mail: This email address is being protected from spambots. You need JavaScript enabled to view it.
2 School of Physics and Astronomy, University of Leeds, Leeds, LS2 9JT, UK
3 Institute of Astronomy, Madingley Road, Cambridge, CB3 0HA, UK
4 Max-Planck-Institut für Extraterrestrische Physik, Giessenbachstrasse 1, 85748 Garching, Germany
Received: 1 August 2016
Accepted: 20 October 2016
Abstract
Context. Snowlines in protoplanetary disks play an important role in planet formation and composition. Since the CO snowline is difficult to observe directly with CO emission, its location has been inferred in several disks from spatially resolved ALMA observations of DCO+ and N2H+.
Aims. N2H+ is considered to be a good tracer of the CO snowline based on astrochemical considerations predicting an anti-correlation between N2H+ and gas-phase CO. In this work, the robustness of N2H+ as a tracer of the CO snowline is investigated.
Methods. A simple chemical network was used in combination with the radiative transfer code LIME to model the N2H+ distribution and corresponding emission in the disk around TW Hya. The assumed CO and N2 abundances, corresponding binding energies, cosmic ray ionization rate, and degree of large-grain settling were varied to determine the effects on the N2H+ emission and its relation to the CO snowline.
Results. For the adopted physical structure of the TW Hya disk and molecular binding energies for pure ices, the balance between freeze-out and thermal desorption predicts a CO snowline at 19 AU, corresponding to a CO midplane freeze-out temperature of 20 K. The N2H+ column density, however, peaks 5–30 AU outside the snowline for all conditions tested. In addition to the expected N2H+ layer just below the CO snow surface, models with an N2/CO ratio ≳0.2 predict an N2H+ layer higher up in the disk due to a slightly lower photodissociation rate for N2 as compared to CO. The influence of this N2H+ surface layer on the position of the emission peak depends on the total CO and N2 abundances and the disk physical structure, but the emission peak generally does not trace the column density peak. A model with a total (gas plus ice) CO abundance of 3 × 10⁻⁶ with respect to H2 fits the position of the emission peak previously observed for the TW Hya disk.
Conclusions. The relationship between N2H+ and the CO snowline is more complicated than generally assumed: for the investigated parameters, the N2H+ column density peaks at least 5 AU outside the CO snowline. Moreover, the N2H+ emission can peak much further out, as far as ~50 AU beyond the snowline. Hence, chemical modeling, as performed here, is necessary to derive a CO snowline location from N2H+ observations.
Key words: astrochemistry / protoplanetary disks / stars: individual: TW Hya / ISM: molecules / submillimeter: planetary systems
© ESO, 2017
1. Introduction
Protoplanetary disks around young stars contain the gas and dust from which planetary systems will form. In the midplanes of these disks, the temperature becomes so low that molecules freeze out from the gas phase onto dust grains. The radius at which this happens for a certain molecule is defined as its snowline. The position of a snowline depends both on the species-dependent sublimation temperature and disk properties (mass, temperature, pressure and dynamics). Snowlines play an important role in planet formation as increased particle size, surface density of solid material, and grain stickiness at a snowline location may enhance the efficiency of planetesimal formation (Stevenson & Lunine 1988; Ciesla & Cuzzi 2006; Johansen et al. 2007; Chiang & Youdin 2010; Gundlach et al. 2011; Ros & Johansen 2013). Furthermore, the bulk composition of planets may be regulated by the location of planet formation with respect to snowlines, as gas composition and ice reservoirs change across a snowline (Öberg et al. 2011; Madhusudhan et al. 2014; Walsh et al. 2015; Eistrup et al. 2016). Determining snowline locations is thus key to studying planet formation.
The CO snowline is of particular interest because CO ice is a starting point for prebiotic chemistry (Herbst & van Dishoeck 2009). Assuming a disk around a solar-type star, the CO snowline occurs relatively far (a few tens of AU) from the central star due to the low freeze-out temperature of CO; hence, it is more accessible to direct observations than other snowlines. However, locating it is difficult because CO line emission is generally optically thick, so that the bulk of the emission originates in the warm surface layers. An alternative approach is to observe molecules whose emission is expected to peak around the snowline, or molecules that are abundant only when CO is depleted from the gas phase. Based on the former argument, DCO+ has been used to constrain the CO snowline location (Mathews et al. 2013; Öberg et al. 2015), but may be affected by some DCO+ also formed in warm disk layers (Favre et al. 2015; Qi et al. 2015). A species from the latter category is N2H+ (Qi et al. 2013, 2015). This molecule forms through proton transfer from H to N2,
  (1)but provided that CO is present in the gas phase, its formation is impeded, because CO competes with N2 for reaction with H,
  (2)Furthermore, reactions with CO are the dominant destruction pathway of N2H+:
  (3)N2H+ is therefore expected to be abundant only in regions where CO is depleted from the gas phase, that is, beyond the CO snowline.
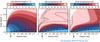 |
Fig. 1 Gas density (cm-3), gas temperature (K), and dust temperature (K) as a function of disk radius, r, and scale height, z/r, for the adopted model for the TW Hya disk. The temperature color range is limited to highlight values around the CO snow surface. The solid black contours indicate temperatures of 100, 200 and 500 K. The blue arrow indicates the location of the midplane CO snowline associated with a freeze-out temperature of 17 K, as determined by Q13, and the dashed contour indicates the corresponding snow surface. |
Observational evidence for the anti-correlation of N2H+ and gas-phase CO was initially provided for pre-stellar and protostellar environments (e.g., Caselli et al. 1999; Bergin et al. 2001; Jørgensen 2004). However, survival of N2H+ is aided in these systems by the delayed freeze-out of N2 as compared to CO, because gas-phase N2 forms more slowly when starting from atomic abundances under diffuse cloud conditions (Aikawa et al. 2001; Maret et al. 2006). In protoplanetary disks, N2 molecules are expected to be more abundant than N atoms because of the higher gas density which increases the N2 formation rate, and this timescale effect is not important.
So far, the results for protoplanetary disks seem inconclusive. Recent observations of C18O in the disk of HD 163296 suggest a CO snowline location consistent with the observed N2H+ emission (Qi et al. 2015). On the other hand, several studies indicate a depletion of CO in the disk around TW Hya down to ~10 AU (Favre et al. 2013; Nomura et al. 2016; Kama et al. 2016; Schwarz et al. 2016), inconsistent with the prediction that CO is depleted only beyond a snowline at ~30 AU, based on modeling of N2H+ observations (Qi et al. 2013, hereafter Q13).
In this work, we explore the robustness of the N2H+ line emission as a tracer of the CO snowline location in the disk midplane, using a physical model (constrained by observations) for the disk around TW Hya. TW Hya is the closest protoplanetary disk system (~54 pc, van Leeuwen 2007) and considered an analog of the Solar Nebula based on disk mass and size. The spatial distribution and emission of N2H+ are modeled for different CO and N2 abundances and binding energies, as well as different cosmic ray ionization rates and degrees of dust settling, using a simple chemical network and full radiative transfer. Aikawa et al. (2015) have shown that analytical formulae for the molecular abundances give a similar N2H+ distribution as a full chemical network. They also found that the N2H+ abundance can peak at temperatures slightly below the CO freeze-out temperature in a typical disk around a T Tauri star, but they did not invoke radiative transfer to make a prediction for the resulting N2H+ emission.
The physical and chemical models used in this work are described in Sect. 2. Section 3 shows the predicted N2H+ distributions and emission. The simulated emission is compared with that observed by Q13 and convolved with a smaller beam ( ) to predict results for future higher angular resolution observations. This section also studies the dependence of the model outcome on CO and N2 abundances, binding energies, cosmic ray ionization rate, and dust grain settling, and the use of multiple N2H+ transitions to further constrain the snowline location. Finally, the dependence of the outer edge of the N2H+ emission on chemical and physical effects is explored. In Sect. 4 the implications of the results will be discussed and in Sect. 5 the conclusions summarized.
2. Protoplanetary disk model
2.1. Physical model
For the physical structure we adopt the model for TW Hya from Kama et al. (2016). This model reproduces the dust spectral energy distribution (SED) as well as CO rotational line profiles, from both single-dish and ALMA observations, and spatially resolved CO J = 3−2 emission from ALMA. The 2D physical-chemical code DALI (Dust And LInes, Bruderer et al. 2009, 2012; Bruderer 2013) was used to create the model, assuming a stellar mass and radius of M∗ = 0.74 M⊙ and R∗ = 1.05 R⊙, respectively. The disk is irradiated by UV photons and X-rays from the central star and UV photons from the interstellar radiation field. The stellar UV spectrum from Cleeves et al. (2015) is used (based on Herczeg et al. 2002, 2004; and France et al. 2014), which is roughly consistent with a ~4000 K blackbody with UV excess due to accretion. The X-ray spectrum is modeled as a thermal spectrum at 3.2 × 10⁶ K with a total X-ray luminosity of 1.4 × 1030 erg s-1 and the cosmic ray ionization rate is taken to be low, 5 × 10-19 s-1 (Cleeves et al. 2015).
Starting from an input gas and dust density structure the code uses radiative transfer to determine the dust temperature and local radiation field. The chemical composition is obtained from a chemical network simulation based on a subset of the UMIST 2006 gas-phase network (Woodall et al. 2007) and used in a non-LTE excitation calculation for the heating and cooling rates to derive the gas temperature (see Bruderer et al. 2012 for details). As will be shown in Sect. 3 and Fig. 1, N2H+ is predicted in the region where the gas and dust temperatures are coupled (z/r ≲ 0.25). Hence, the temperature in the relevant disk region is not sensitive to changes in molecular abundances.
The input gas density has a radial power law distribution,  (4)and a vertical Gaussian distribution,
  (5)To match the observations, the gas-to-dust mass ratio is set to 200. Two different dust populations are considered; small grains (0.005−1 μm) represent 1% of the dust surface density, whereas the bulk of the dust surface density is composed of large grains (0.005−1000 μm). The vertical distribution of the dust is such that large grains are settled toward the midplane with a settling parameter χ of 0.2, that is, extending to 20% of the scale height of the small grains,
 ![Mathematical equation: \begin{eqnarray} \rho_{\mathrm{dust,small}} &=& \frac{0.01\Sigma_{\mathrm{dust}}}{\sqrt{2\pi}Rh} \exp \left[-\frac{1}{2} \left( \frac{\pi/2-\theta}{h} \right) ^2 \right] \hspace{0.2cm} \mathrm{g \, cm}^{-3}, \mathrm{and} \\ \rho_{\mathrm{dust,large}} &=& \frac{0.99\Sigma_{\mathrm{dust}}}{\sqrt{2\pi}R\chi h} \exp \left[-\frac{1}{2} \left( \frac{\pi/2-\theta}{\chi h} \right) ^2 \right] \hspace{0.2cm} \mathrm{g \, cm}^{-3}, \end{eqnarray}](/articles/aa/full_html/2017/03/aa29452-16/aa29452-16-eq26.png) where θ is the vertical latitude coordinate measured from the pole (θ = 0) to the equator, that is, the midplane (θ = π/ 2; Andrews et al. 2012). In the inner 4 AU, the gas and dust surface density is lowered by a factor of 100 with respect to the outer disk to represent the gap detected in the inner disk (Calvet et al. 2002; Hughes et al. 2007). Recent observations indicate that the dust distribution in this inner region is more complicated (Andrews et al. 2016), but this will not affect the N2H+ distribution in the outer disk. In Sect. 3.6 we examine the influence of grain settling on the N2H+ distribution and emission by using a model with χ = 0.8, that is, the large grains extending to 80% of the small grain scale height.
where θ is the vertical latitude coordinate measured from the pole (θ = 0) to the equator, that is, the midplane (θ = π/ 2; Andrews et al. 2012). In the inner 4 AU, the gas and dust surface density is lowered by a factor of 100 with respect to the outer disk to represent the gap detected in the inner disk (Calvet et al. 2002; Hughes et al. 2007). Recent observations indicate that the dust distribution in this inner region is more complicated (Andrews et al. 2016), but this will not affect the N2H+ distribution in the outer disk. In Sect. 3.6 we examine the influence of grain settling on the N2H+ distribution and emission by using a model with χ = 0.8, that is, the large grains extending to 80% of the small grain scale height.
The resulting density and thermal structure of the disk are shown in Fig. 1 and used in the chemical modeling described in Sect. 2.2. A midplane temperature of 17 K corresponds to a radius of 27.5 AU, consistent with the CO snowline properties derived by Q13. In their analysis, Q13 fit ALMA observations using a power law for the radial distribution of the N2H+ column density, with an inner radius presumed to coincide with the CO snowline.
2.2. Chemical model
If CO is abundant in the gas phase, N2H+ formation is slowed down (Eqs. (1) and (2)) and N2H+ destruction is enhanced (Eq. (3)). On the other hand, gas-phase N2 is required to form N2H+ (Eq. (1)). Based on these considerations, the simplest method to predict the distribution of N2H+ is by calculating the balance between freeze-out and desorption for N2 and CO at every position in the disk. Assuming a constant total abundance, that is, ng(CO) + ns(CO) = n(CO), the steady state gas phase and ice abundances (ng and ns, resp.) are then given by,  where kf and kd are the freeze-out and desorption rates, respectively. For N2 a similar equation holds. Thermal desorption is considered here as the only desorption process, which is appropriate for volatile molecules such as CO and N2. However, the dust density in the outer disk may be low enough for UV photons to penetrate to the disk midplane, such that photodesorption may become effective. Photodesorption is therefore included when studying the outer edge of the N2H+ emission in Sect. 3.8. The thermal desorption rate depends on the specific binding energy for each molecule, Eb, and for CO and N2 values of 855 and 800 K (Bisschop et al. 2006) are adopted, respectively. Expressions for the freeze-out and desorption rates, and a discussion of the adopted parameters can be found in Appendix A. Solving the gas and ice abundances time dependently shows that equilibrium is reached within 105 years, so steady state is a reasonable assumption for a typical disk lifetime of 106 yr.
The snow surface is defined as the position in the disk where 50% of a species is present in the gas phase and 50% is frozen onto the grains. From Eq. (8) the snow surfaces for CO and N2 can thus be predicted. We note that the freeze-out and desorption rates (Eqs. (A.2) and (A.5)), and therefore the fraction of a species that is present in the gas or ice (e.g., ng(CO)/n(CO); see Eq. (8)) at a certain temperature, do not depend on abundance. Hence the locations of the midplane snowlines are independent of the total, that is, gas plus ice, CO and N2 abundances.
As a first approximation, N2H+ can be considered to be present between the CO and N2 snow surfaces. Comparison with the result from the chemical model described below shows that the N2H+ layer extends beyond the N2 snow surface, and the outer boundary is better described by the contour where only 0.05% of the N2 has desorbed while the bulk remains frozen out. We will refer to the N2H+ layer bounded by the CO snow surface and the contour where 0.05% of the N2 has desorbed as model “FD” (freeze-out and desorption).
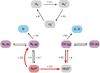 |
Fig. 2 Schematic representation of the chemical network used to model N2H+ (red). Freeze-out and desorption products are highlighted in purple and photodissociation products are shown in blue. The processes responsible for the anti-correlation between N2H+ and CO are highlighted with red arrows. |
Reactions, rate data and related parameters for the N2H+ chemical network.
Prediction of the N2H+ abundance itself requires solving a chemical model. To avoid uncertainties associated with full chemical network models, a reduced chemical network, incorporating the key processes affecting the N2H+ abundance, including the freeze-out and thermal desorption of CO and N2, is adopted. This network is similar to that used by Jørgensen et al. (2004) for protostellar envelopes, but with freeze-out, thermal desorption and photodissociation of CO and N2 included (see Fig. 2). It resembles the analytical approach applied by Aikawa et al. (2015). The most important aspects are described below and a more detailed description can be found in Appendix A.
Incorporation of CO and N2 destruction by photodissociation in the surface and outer layers of the disk is necessary because depletion of the parent molecule, and a possible change in N2/CO ratio, may affect the N2H+ abundance. For CO and N2, photodissociation occurs through line absorption, and shielding by H2 and self-shielding are important. For CO, photodissociation cross sections and shielding functions were taken from Visser et al. (2009), and for N2 from Li et al. (2013) and Heays et al. (2014). For a given radiation field, both photodissociation rates are accurate to better than 20%, and the difference in unshielded rates (2.6 × 10⁻¹⁰ versus 1.7 × 10⁻¹⁰ s-1 in the general interstellar radiation field) turns out to be significant. We note that gas-phase formation of CO and N2 are ignored, such that the model predicts a steep cutoff in the gas-phase abundances in the disk atmosphere. However, this should not affect the freeze-out and desorption balance around the snow surfaces, as they are located deeper within in the disk.
The system of ordinary differential equations dictating the reduced chemistry, was solved using the python function odeint1 up to a typical disk lifetime of 106 yr. As an initial condition, all CO and N2 is considered to be frozen out, while all other abundances (except H2) are set to zero. In Sect. 3.2 the effect of CO and N2 abundances, and the N2/CO ratio, is studied by varying the total, that is, gas plus ice, abundances between 10-7 and 10-4 (with respect to H2) such that the N2/CO ratio ranges between 0.01 and 100. We will refer to these models as model “CH” (simple CHemical network). The adopted parameters are listed in Table 1.
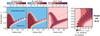 |
Fig. 3 Distributions of CO gas, N2 gas and N2H+ in the simple chemical model (model CH) with CO and N2 abundances of 3 × 10⁻⁶. To focus on the region around the CO snow surface, the vertical scale is limited to a scale height z/r ≤ 0.2. The rightmost panel highlights the region where N2H+ is present near the disk midplane. The dashed and dash-dotted contours represent the CO and N2 snow surfaces, respectively, and the corresponding midplane snowlines are indicated by arrows below the horizontal axis of the rightmost panel. The midplane radius with the highest N2H+ abundance is marked with a red arrow. |
The temperature at which a molecule freezes out depends on the gas density and on the binding energy for each molecule, Eb. In the fiducial FD and CH models binding energies for pure ices are used. When in contact with water ice, the CO and N2 binding energies are higher. Recent results from Fayolle et al. (2016) show that, as long as the ice morphology and composition are equivalent for both CO and N2, the ratio of the binding energies remains the same (~0.9). The effect of different binding energies will be studied in Sect. 3.4 by adopting values of 1150 K and 1000 K (model CH-Eb1) and 1150 K and 800 K (model CH-Eb2), for CO and N2, respectively. The former values are for both CO and N2 on a water ice surface (Garrod & Herbst 2006), that is, representing a scenario in which all ices evaporate during disk formation and then recondense. The latter model represents a situation in which CO is in contact with water ice, while N2 resides in a pure ice layer.
Overview of models and adopted parameters.
Another important parameter in the simple chemical model is the cosmic ray ionization rate, since it controls the H abundance, important for formation of N2H+. Based on modeling of HCO+ and N2H+ line fluxes and spatially resolved emission, Cleeves et al. (2015) have suggested that the cosmic ray ionization rate in TW Hya is very low, of order 10-19 s-1. The importance of the cosmic ray ionization rate is addressed in Sect. 3.5 by adopting values of ζ = 1 × 10-19 s-1 (CH-CR1) and ζ = 5 × 10-17 s-1 (CH-CR2), as also used by Aikawa et al. (2015) in their study of N2H+.
An overview of all CH models is given in Table 2.
2.3. Line radiative transfer
Emission from the N2H+J = 4–3 (372 GHz), J = 3–2 (279 GHz) and J = 1–0 (93 GHz) transitions were simulated with the radiative transfer code LIME (LIne Modeling Engine, Brinch & Hogerheijde 2010) assuming a distance, inclination and position angle appropriate for TW Hya; 54 pc, 6° and 155°, respectively (Hughes et al. 2011; Andrews et al. 2012). These are the same values as adopted by Q13. The LIME grid was constructed such that the grid points lie within and just outside the region where the N2H+ abundance > 1 × 10-13. In the disk region where N2H+ is predicted, the gas density is larger than the J = 4−3 critical density of ~ 8 × 106 cm-3 (see Fig. 1), so to reduce CPU time, models were run in LTE. The simulated images were convolved with a 0.̋63 × 0.̋59 beam, similar to the reconstructed beam of Q13, and a 0.̋2 × 0.̋2 beam to anticipate future higher spatial resolution observations. For the J = 4–3 transition, the line profiles and the integrated line intensity profiles were compared to the observational data reduced by Q13.
3. Results
3.1. Distribution and emission of N2H+
Figure 3 shows the distribution of CO gas, N2 gas and N2H+ as predicted by the simple chemical model (model CH). Abundance refers to fractional abundance with respect to H2 throughout this work. CO and N2 are frozen out in the disk midplane and destroyed by UV photons higher up in the disk. The snow surface is defined as the position in the disk where the gas-phase and ice abundances become equal (see Fig. 3, left panels), and the snowline is the radius at which this happens in the midplane. For the physical structure and fiducial binding energies adopted, the CO snowline is then located at 19 AU which corresponds to a temperature for both the gas and dust of ~20 K. This is closer in than the snowline location of 30 AU (corresponding to 17 K) as inferred by Q13, but in good agreement with recent results from Zhang et al. (2016) who directly detect the CO snowline around 17 AU using 13C18O observations.
Although the N2H+ abundance starts to increase at the midplane CO snowline, it peaks ~10 AU further out (see Fig. 3, rightmost panel). It thus seems that the reduction in CO gas abundance at the snowline is not sufficient to allow N2H+ to be abundant, but that an even higher level of depletion is required to favor N2H+ formation over destruction. On the other hand, very low fractions of N2 in the gas phase are sufficient to allow N2H+ formation, extending the N2H+ layer beyond the N2 snow surface. In addition to the expected N2H+ layer, N2H+ is predicted to be abundant in a layer higher up in the disk where the N2 abundance in the gas phase exceeds that of CO due to a slightly lower photodissociation rate of N2 as compared with CO. The presence of N2H+ in the surface layers is also seen in full chemical models (Walsh et al. 2010; Cleeves et al. 2014; Aikawa et al. 2015) and its importance is further discussed in Sect. 3.3.
The results from the simple chemical model thus deviate from the expectation that N2H+ is most abundant in a layer directly outside the CO snowline, as can also be seen from the radial column density profiles in Fig. 4 (top panel). When considering only freeze-out and desorption (model FD) and assuming a constant N2H+ abundance of 3 × 10⁻¹⁰ between the CO snow surface and the 0.05% contour for N2 gas, the N2H+ column density peaks only 2 AU outside the snowline. On the contrary, in model CH this peak is located 11 AU further out in the disk, at the snowline location derived by Q13. In addition, the column density profile for model CH is flatter due to the N2H+ surface layer.
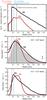 |
Fig. 4 N2H+ column density profile (top panel) and simulated J = 4–3 line emission (middle and bottom panels) for the N2H+ distributions predicted by the simple chemical model with CO and N2 abundances of 3 × 10⁻⁶ (model CH; red lines) and a model incorporating only freeze-out and desorption (model FD; black lines). Integrated line intensity profiles are shown after convolution with a |
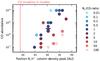 |
Fig. 5 Position of the N2H+ column density peak in model CH for different CO and N2 abundances. The best-fit model with abundances of 3 × 10⁻⁶, as shown in Fig. 3, is indicated by a star and the color of the symbols represents the value of the N2/CO ratio. The vertical red line marks the location of the CO snowline in the models. |
In order to determine whether this difference in N2H+ distribution is large enough to cause different emission profiles, emission from the N2H+J = 4–3 (372 GHz) transition was simulated. Model FD fits the observed emission peak reasonably well for an N2H+ abundance of 3 × 10⁻¹⁰, although the simulated emission peak is located 7 AU closer to the star than observed. Variations in the assumed N2H+ abundance only affect the intensity, but not the position of the peak. On the other hand, model CH can reproduce the position of the emission peak for a CO and N2 abundance of 3 × 10⁻⁶ (Fig. 4, middle panel). The underprediction of the emission in the outer disk is further discussed in Sect. 3.8. The difference between the models becomes more prominent at higher spatial resolution (Fig. 4, bottom panel). In that case, model FD predicts the emission peak 10 AU outside the snowline (instead of 17 AU), while this is 30 AU for model CH (instead of 24 AU) due to the flattened column density profile. An N2H+ column density peaking at 30 AU, 11 AU outside the snowline, can thus reproduce the observed emission peak, which is in agreement with Q13, unlike a column density profile peaking directly at the CO snowline. However, this is only the case for a low CO and N2 abundance of 3 × 10⁻⁶, as discussed further below.
3.2. Influence of CO and N2 abundances
To examine whether the exact amount of CO present in the gas phase is more important for the N2H+ distribution than the location of the CO snowline, as suggested above, the total CO and N2 abundances in the simple chemical network were varied. Changing the CO abundance does not influence the N2H+ distribution via temperature changes since the gas and dust are coupled in the region where N2H+ is present (see Sect. 2.1 and Fig. 1). Furthermore, recall that the location of the midplane CO snowline does not depend on abundance and thus remains at 19 AU for all models which adopt the fiducial binding energy. The position of the N2H+ column density peak, however, turns out to move further away from the snowline with increasing CO abundance (Fig. 5). This reinforces the idea that the gas-phase CO abundance remains too high for N2H+ to be abundant after the 50% depletion at the snowline. Instead, N2H+ peaks once the amount of CO in the gas phase drops below a certain threshold, which is reached further away from the snowline for higher CO abundances. This is in agreement with the conclusions from Aikawa et al. (2015).
Moreover, the position of the column density peak depends also on the N2 abundance. For a fixed CO abundance, the position of the maximum N2H+ column density shifts outward with increasing N2 abundance, since the amount of gas-phase N2 remains high enough for efficient N2H+ formation at larger radii. The N2H+ distribution thus strongly depends on the amount of both CO and N2 present in the gas phase, with the column density peaking 6–18 AU outside the CO snowline for different abundances.
3.3. Importance of the N2H+ surface layer
Besides the expected N2H+ layer outside the CO snow surface, model CH also predicts a layer higher up in the disk where N2H+ is abundant as a result of a slightly lower N2 photodissociation rate compared with CO. Since both molecules can self-shield, the photodissociation rates depend on molecular abundances. Therefore, the CO and N2 abundances influence the shape of the N2H+ surface layer as shown in Fig. 6. When N2 is equally or more abundant than CO, N2H+ can survive in the region where CO is photodissociated but N2 is still present. The higher the abundances, the closer to the disk surface a sufficiently high column density is reached for efficient self-shielding and the more extended is the N2H+ surface layer (Fig. 6, left panel). The inner boundary of the surface layer is set where CO photodissociation ceases to be effective. For lower CO and N2 abundances, photodissociative photons can penetrate deeper into the disk, and the N2H+ surface layer is located closer to the star (Fig. 6, middle panel). The layer does not extend to the disk outer radius any longer because most N2 is now photodissociated in the outer regions. Finally, when CO is more abundant than N2, the surface layer decreases. For N2/CO ≲ 0.2 CO becomes abundant enough everywhere above the snow surface to shift the balance towards N2H+ destruction (Fig. 6, right panel).
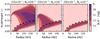 |
Fig. 6 Distribution of N2H+ in the simple chemical model (model CH) for different N2 and CO abundances as listed above the panels. To focus on the region around the CO snow surface, the vertical scale is limited to a scale height z/r ≤ 0.25. The dashed contour represents the CO snow surface. |
To address the influence of the N2H+ surface layer, J = 4−3 lines were simulated for model CH with different CO and N2 abundances with the CO snow surface set as an upper boundary. In other words, no N2H+ is present above the CO snow surface in these “snow surface only” models. Removing the N2H+ surface layer hardly affects the position of the column density peak (Fig. 7, top left panel), suggesting that the offset between N2H+ and CO snowline is not caused by the surface layer but rather is a robust chemical effect. The emission, however, is strongly influenced by the surface layer (Fig. 8, top left panel). In the full CH models, the emission peak is shifted away from the snowline for higher CO abundances by up to ~50 AU, while in the snow surface only models, the emission traces the column density peak with an offset related to the beam size. Only for CO abundances ~ 10-6 or N2/CO ratios ≲1 does the emission trace the column density in the full models, and only for even lower CO abundances (~ 10-7) does the emission peak at the snowline. In addition to the N2H+ column density offset, the relation between the CO snowline and the N2H+ emission is thus weakened even more in models with N2/CO ≳0.2 due to the presence of an N2H+ surface layer that causes the emission to shift outward.
Furthermore, the N2H+ surface layer contributes significantly to the peak integrated intensity. This intensity shows a linear correlation with the N2/CO ratio, but the difference of ~600 mJy beam-1 km s-1 (for the  beam) between models with a N2/CO ratio of 0.01 and 100 reduces to only ~100 mJy beam-1 km s-1 in the snow surface only models (see Fig. B.1). For the TW Hya physical model adopted, a surface layer of N2H+, in addition to the midplane layer outside the CO snow surface, seems necessary to reproduce the observed integrated peak intensity. This is in agreement with Nomura et al. (2016), who suggest that the N2H+ emission in TW Hya originates in the disk surface layer based on the brightness temperature.
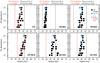 |
Fig. 7 Position of the N2H+ column density peak in the different models (listed in the lower right corner of each panel) for different CO and N2 abundances. From left to right and top to bottom: the fiducial models (CH), models with both CO and N2 binding energies increased (CH-Eb1), models with only CO binding energy increased (CH-Eb2), models with large grains settled to only 80% of small grain scale height (CH-χ0.8), models with a lower cosmic ray ionization rate (1 × 10-19 s-1; CH-CR1) and models with a higher cosmic ray ionization rate (5 × 10-17 s-1; CH-CR2). Models with N2/CO ratios <1 are highlighted with blue plus signs. Red circles in the left panels represent the snow surface only models, i.e., N2H+ removed above the CO snow surface. The red lines mark the location of the CO snowline in the models. The gray line indicates the position of the observed emission peak. |
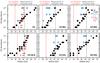 |
Fig. 8 As Fig. 7, but for the position of the simulated N2H+J = 4−3 emission peak after convolution with a |
3.4. Influence of CO and N2 binding energies
The location of the CO snowline depends on the CO binding energy. To address whether the offset between N2H+ and the CO snowline is a result of the adopted binding energies, models were run with a higher CO binding energy (1150 K), that is, assuming CO on a water ice surface (model CH-Eb2). As the amount of N2 also influences the N2H+ distribution, models were run with a higher binding energy for both CO and N2 (1150 and 1100 K, respectively) as well (model CH-Eb1). The position of the N2H+ column density and emission peak for different CO and N2 abundances are shown in the top middle and top right panels of Figs. 7 and 8, respectively. When the binding energy is increased for both species (model CH-Eb1), the results are similar to before. The N2H+ column density peaks 5–9 AU outside the CO snowline, and the emission peak shifts to even larger radii with increasing CO abundance when an N2H+ surface layer is present (black circles in Fig. 8). Increasing only the CO binding energy, that is, shifting the CO snowline inward but not affecting the N2 snowline (model CH-Eb2), results in the N2H+ column density to peak 12–26 AU from the CO snowline. The emission peaks, however, stay roughly at the same radii for both models, thus better tracing the column density maximum when the CO and N2 snowlines are further apart. The peak integrated intensities are similar for all three sets of binding energies.
The N2H+ column density thus peaks outside the CO snowline for all binding energies tested, and the offset is largest when the CO and N2 snowlines are furthest apart. The offset between snowline and emission peak is roughly independent of the binding energies, except for CO abundances of ~ 10-4. Therefore, a degeneracy exists between the peak position of the emission and the column density.
3.5. Influence of the cosmic ray ionization rate
The cosmic ray ionization rate controls the H abundance, and may therefore have an effect on the N2H+ distribution. To address the importance of the cosmic ray ionization rate, model CH was run with ζ = 5 × 10-17 s-1 (CH-CR2), as also used by Aikawa et al. (2015) in their study of N2H+, and ζ = 1 × 10-19 s-1 (CH-CR1), as suggested by Cleeves et al. (2015). The results for the N2H+ column density and J = 4−3 emission are presented in Figs. 7 and 8, respectively (bottom middle and right panels). The trends seen for the position of the column density and emission peak are roughly the same as for the fiducial models with ζ = 1.2 × 10⁻¹⁷ s-1, although both offsets are ~10 AU larger for the lowest cosmic ray ionization rate. The very small radius at which the emission peaks for model CH-CR2 with a CO abundance of ~ 10-7 is due to a combination of a higher N2H+ abundance in the inner few tens of AU as compared to models with a higher CO abundance and a  (~32 AU) beam. The strongest effect of the cosmic ray ionization rate is on the strength of the peak integrated intensity. Models CH-CR2 predict a higher peak integrated intensity than observed, while N2 needs to be more than two orders of magnitude more abundant than CO to be consistent with the low cosmic ray ionization rate of 10-19 s-1 in models CH-CR1 (see Fig. B.2).
The cosmic ray ionization rate thus influences the distribution of N2H+ with respect to the snowline, with the column density peaking closest to the snowline for the highest values of ζ and the lowest CO abundances. However, the smallest offset remains 4 AU.
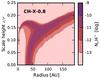 |
Fig. 9 N2H+ distribution predicted by the simple chemical model for a physical structure with the large grains settled to only 80% of the small grain scale height (model CH-χ0.8). Abundances of 3 × 10⁻⁶ are adopted for both CO and N2. |
3.6. Influence of grain settling
In the physical model adopted so far, the large grains have settled toward the disk midplane. The distribution of the dust is important because it affects the UV penetration and the disk thermal structure, which is determined by the processing of UV radiation by the dust particles. Since the location of the CO snow surface is temperature dependent, grain settling may indirectly influence the location of the CO snowline. To examine whether this also influences the relation between N2H+ and the snowline, a physical model in which the large grains have only settled to 80% of the small grain scale height is used. The N2H+ distribution predicted by the simple chemical model for CO and N2 abundances of 3 × 10⁻⁶ is presented in Fig. 9. The CO snow surface is now located higher up in the disk as a consequence of the shallower temperature gradient near the midplane. In other words, the temperature stays below the CO freeze-out temperature at larger scale heights. The resulting increase in the N2H+ column just outside the snowline in combination with the smaller N2H+ surface layer, reduces the contribution of this layer. This is for instance reflected in the peak integrated intensity; the difference between full models and snow-surface-only models is now only a factor of approximately two instead approximately five.
Figures 7 and 8 (bottom left panels) show what this means for the positions of the N2H+ column density and emission peaks. Due to the different temperature structure, the CO snowline is located at 25 AU, but the N2H+ column density still peaks 6–22 AU further out. However, the offset between column density and emission peak is now different. The emission does trace the column density for CO abundances higher than ~ 5 × 10⁻⁶, while for lower abundances the emission peaks at smaller radii than the column density. Again, when the surface layer is removed, the emission roughly traces the column density for all CO and N2 abundances.
Thus, the N2H+ emission seems not only sensitive to the chemical conditions, but also the physical conditions in the disk and the UV penetration. Depending on the degree of grain settling the emission traces the column density for different CO abundances, although the N2H+ column density peaks outside the CO snowline in all models.
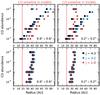 |
Fig. 10 Position of the N2H+J = 4−3 (black circles), J = 3−2 (blue plus signs) and J = 1−0 (red crosses) emission peaks for different CO and N2 abundances in the simple chemical model (model CH; top panels) and the corresponding snow surface only models, i.e., N2H+ removed above the CO snow surface (bottom panels). The emission is convolved with a |
3.7. Constraints provided by multiple N2H+ transitions
For N2/CO ratios larger than ~0.2, the simple chemical network predicts that N2H+ is also abundant in a surface layer above the CO snow surface. The presence of this surface layer significantly influences the N2H+J = 4−3 emission and complicates the relationship between N2H+ and the CO snowline. To assess whether a different N2H+ transition would be better suited to trace the CO snowline, emission was simulated for the J = 3–2 (279 GHz) and J = 1−0 (93 GHz) transitions for models CH and CH-χ0.8. The results for the position of the N2H+ emission peaks in model CH are shown in Fig. 10. For the full models with N2/CO > 0.2, the emission peak shifts outward with decreasing transition frequency (Fig. 10, top panels), while all transitions peak at a similar radius for the models where the N2H+ surface layer has been removed (Fig. 10, bottom panels) or is not present. When the emission is convolved with a beam, the J = 1−0 transition peaks in some models at smaller radii than the other transitions. That is because in these cases the structure caused by the surface layer can be resolved, revealing two components that are smeared into one broad feature by the beam. Similar results are obtained for model CH-χ0.8 (not shown). Observing multiple transitions thus seems to provide a good indication whether or not a surface layer of N2H+ contributes to the emission, and thus how well the emission traces the column density.
Although comparison of the emission-peak positions for different transitions may indicate the contribution of an N2H+ surface layer, no information is provided on how far the emission peak is then offset from the column density peak or actual CO snowline. To examine whether N2H+ line ratios may contribute to addressing this problem, the J = 4−3 /J = 3−2 and J = 4−3 /J = 1−0 ratios are calculated. Results for model CH and model CH-χ0.8 with three different CO and N2 abundances (as shown in Fig. 6) are presented in Fig. C.1. When the N2H+ surface layer is removed or not present at all, both line ratios are nearly constant throughout the disk at J = 4−3 /J = 3−2 ≈ 1.2 and J = 4−3 /J = 1−0 ≈ 20. Only at  resolution does the J = 4−3 /J = 1−0 ratio increase in the inner ~30 AU. In the fudicial model with the large grains settled to 20% of the small grain scale height, both line ratios can distinguish between differently shaped N2H+ surface layers. The line ratios become more steep when the surface layer extends to about half the disk radius and increase in value for a surface layer extending to the disk outer radius. In model CH-χ0.8, the surface layer contributes less to the emission and although the line ratios show an increase at around 40 AU when the surface layer is present, distinguishing differently shaped surface layers is not possible. N2H+ line ratios are thus sensitive to the distribution of N2H+, and together with the position of the different emission peaks, can provide modeling constraints and aid in constraining the location of the CO snowline.
3.8. Outer edge of N2H+ emission
So far, we have focused on the peak of the N2H+ emission and its relation to the CO snowline. The simple chemical model (model CH) produces a good fit to the emission peak, but underestimates the emission coming from the outer disk (further out than ~60 AU). In this region, the density may have become low enough for UV radiation to penetrate the midplane and photodesorption to become effective. To address whether this can account for the observed emission, photodesorption is included in model CH-PD (see Fig. D.1). Although N2H+ is now present in the midplane at radii larger than ~60 AU and this results in an increase in the column density at these radii, the ~10 mJy beam-1 km s-1 gain in emission is not enough to explain the observations. Increasing the photodesorption rates by two orders of magnitude does not yield an higher intensity, so photodesorption alone can not explain the N2H+ emission originating in the outer disk.
Offset between the CO snowline and the N2H+ column density and J = 4−3 emission peak in the different models.
Interestingly, the radius at which model and observations start to deviate (~60 AU) is equal to the radial extent of the millimeter grains (see e.g., Andrews et al. 2012). The absence of large grains in the outer disk, not accounted for in our model, may influence the temperature structure, such that thermal desorption becomes effective, as shown for CO by Cleeves (2016). An increase in CO and N2 desorption may then cause an increase in N2H+ in the disk outer region.
Photodissociation turns out to be an important process in N2H+ chemistry, so a logical question to ask is whether N2 photodissociation is responsible for the outer edge of the N2H+ emission. N2 self-shielding is not effective until the N2 column density becomes ≳ 1015 cm-2 (Li et al. 2013), so although the N2H+ layer below the CO snow surface extends over the entire disk in most models (see Fig. 6), the N2H+ abundance outside ~100 AU is two orders of magnitude lower for N2 abundances ≲ 10-6. However, despite an N2H+ layer throughout the entire disk for N2> 10-6, the outer radius of the emission coincides with the outer boundary of the N2H+ surface layer, which is set by N2 photodissociation. Only for N2 abundances as high as 10-4 does the N2H+ emission extend over the entire disk. For lower abundances is the emission thus truncated due to N2 photodissociation at the outer edge in this particular model.
4. Discussion
To study the robustness of N2H+ as tracer of the CO snowline, we model the N2H+ distribution for the disk around TW Hya using a simple chemical model and simulate the resulting emission with the radiative transfer code LIME. The N2H+ column density peaks ~5–30 AU outside of the CO snowline, for all physical and chemical conditions tested. Furthermore, the N2H+ emission peaks generally not at the same radius as the column density, and can be up to 53 AU offset from the CO snowline. Only for very low total (gas plus ice) CO abundances (~10-7) can the emission peak inside the snowline, although the column density does not. Results for the different models are summarized in Table 3. Fitting the N2H+ column density using a power law with the inner radius assumed to be at the CO snowline can thus generally only produce an outer boundary to the snowline location.
Triggered by the question on how N2H+ can be abundant in protoplanetary disks in spite of very similar freeze-out temperatures for CO and N2, Aikawa et al. (2015) performed a chemical model study of the N2H+ distribution. They attributed its presence to the conversion of CO to less volatile species. However, the models presented in this work predict an N2H+ layer even for canonical CO abundances of ~ 10-4. Nonetheless, the conclusions that the absolute abundances of CO and N2 are important and the N2H+ abundance can peak at a temperature below the CO and N2 freeze-out temperature are reinforced by our models for many different CO and N2 abundances. Results on the effect of the CO and N2 binding energies and cosmic ray ionization rate are also in good agreement.
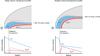 |
Fig. 11 Schematic representation of the distribution of gas-phase CO (blue) and N2H+ (red) in disks with either a steep vertical temperature profile, as for TW Hya (left), or a shallow vertical temperature profile (right). These differences can be due to different degrees of grain settling. To highlight the region around the CO snowline, the vertical direction depicts scale height, z/r. The dashed black contour represents the CO snow surface and the light blue area directly outside this contour shows that, at the snow surface, the gas phase abundance drops by 50%. The N2H+ surface layer is indicated by dotted red lines. The predicted column density profiles are shown below. For N2H+, the column density profile is shown with (dotted line) and without (solid line) the surface layer. The vertical dashed black line indicates the location of the midplane CO snowline. |
Aikawa et al. (2015) also report the presence of N2H+ in layers higher up in the disk in their full chemical model (in line with Walsh et al. 2010; and Cleeves et al. 2014), but they do not perform a radiative transfer calculation to explore whether this contributes significantly to the resulting emission. Here we show that the discrepancy between column density and emission maxima is caused by such a surface layer that is present in models with CO less than approximately five times as abundant as N2, due to a small difference in the CO and N2 photodissociation rates. Although CO is more than an order of magnitude more abundant than N2 in the ISM, CO can be underabundant in the gas-phase in protoplanetary disks. This underabundance used to be attributed to photodissociation and freeze-out (Dutrey et al. 1997; van Zadelhoff et al. 2001), but recent studies concerning in particular TW Hya, suggest that on top of these well-known processes, CO is also depleted in the warm molecular layer and indeed inside the snowline (Favre et al. 2013; Nomura et al. 2016; Schwarz et al. 2016). Moreover, observations of [C I] lines indicate a general carbon depletion in this disk (Kama et al. 2016). The results presented here show that N2H+ is very sensitive to the gas-phase CO abundance, and the best fit to the observed emission is acquired for a total CO abundance of 3 × 10⁻⁶, consistent with the CO depletion scenario. To achieve such a low CO gas-phase abundance in the models, a low total CO abundance is required, as the amount of CO present in the gas phase depends on the available ice reservoir. This suggests that CO frozen out in the outer disk may be trapped in the ice or converted to more complex species. Other possiblilities are that it has been locked up due to grain growth on the way to the inner disk or locked up in even larger bodies like planetesimals. The overprediction of N2H+ emission inside the CO snowline as compared to the observations may indicate that some of the CO is trapped in other ices with higher binding energies, such as CO2 and H2O, since this will allow gradual release of additional CO when these species desorb off the grains at higher temperatures.
The contribution of the surface layer to the total N2H+ emission seems to depend on the disk physical structure. In the TW Hya model, the high degree of dust settling results in a steep vertical temperature gradient. This confines the CO snow surface, and hence the associated N2H+ layer, close to the midplane. For a less settled disk, the vertical temperature gradient is shallower and the N2H+ layer resides higher up in the disk. The N2H+ column density just outside the CO snowline is much higher in the latter case and therefore the contribution from the N2H+ surface layer is significantly lower. This is further aided by the lower gas density in the surface layer due to its increased scale height (see Fig. 11). For CO abundances ≳ 10-6 the N2H+ emission then traces the column density, while the emission is shifted to larger radii in models with substantial grain settling.
Differences in disk vertical structure may also help to explain why the CO snowline can be observed directly with CO isotopologues in some disks, but not in others. The higher up in the disk the CO snow surface resides, the larger the CO column density decrease across the snowline, simply because the CO-depleted region extends to larger heights (see Fig. 11). This may explain why in TW Hya no sharp drop in CO column density is seen around the snowline, on top of the global CO depletion (Nomura et al. 2016; Schwarz et al. 2016). The rise in column density inward of 10 AU may be the result of release of trapped CO at the CO2 and H2O snowlines. On the other hand, in HD 163296, both C18O and N2H+ emission can be reproduced by a sharp change in column density at roughly the same radius (Qi et al. 2015). The fitted CO freeze-out temperature occurs, for the physical model adopted for HD 163296 by these authors, at a radius of 85–90 AU, while the N2H+ emission can be reproduced by a column density profile with a inner radius between 84 and 98 AU. These results are consistent with the results shown here that the N2H+ distribution peaks outside the CO snowline. The better agreement between CO and N2H+ emission could mean that the CO snow surface is located higher up in the disk. As the HD 163296 disk is inclined with respect to the line of sight (e.g., Dominik et al. 2003), this hypothesis could be tested by deriving the height at which the N2H+ layer resides from channel maps. Another possibility is that there is no N2H+ surface layer due to the much stronger UV radiation field of the Herbig Ae star HD 163296 as compared to the T Tauri star TW Hya, so that the N2H+ emission follows the column density. In addition, a strong drop in CO abundance may be easier to detect in a disk with a low global carbon and CO depletion.
The relationship between N2H+ and the CO snowline is thus more complicated than direct coincidence and a snowline location can generally not be derived from only a power law fit to the observed N2H+ emission. For disks with the CO snow surface high above the midplane, for example, due to a low degree of grain settling, the N2H+ emission seems to generally trace the column density peak quite well. The then obtained outer boundary for the snowline can be improved if a CO column density profile can be derived from C18O observations. On the other hand, when the N2H+ emission is dominated by a surface layer, for example, in a very settled disk, chemical modeling is required. If the CO snow surface is close to the midplane, the CO column density change across the snowline will be small and C18O observations will be less helpful (see Fig. 11). Detailed knowledge about the disk vertical physical structure are thus required to translate N2H+ emission into a CO snowline location. Comparing emission from multiple N2H+ transitions can provide information on to what extent the emission is dominated by an N2H+ surface layer, and thus how well it traces the column density. Higher spatial resolution may also reveal significant contribution from a surface layer, as multiple components may be concealed in a broad emission peak at low resolution.
5. Conclusions
In this work, we modeled the N2H+ distribution and resulting emission for the disk around TW Hya using a simple chemical network. Our main conclusions regarding the robustness of N2H+ as a tracer of the CO snowline are listed below.
-
1.
For the adopted physical structure and binding energies,freeze-out and thermal desorption predict a CO snowline at19 AU, corresponding to a CO midplanefreeze-out temperature of 20 K. This is closer inthan inferred by Qi et al. (2013).
-
2.
A simple chemical model predicts the N2H+ column density to peak at least ~5 AU outside the CO snowline for all physical and chemical conditions tested. This offset shows an increasing trend with CO abundance, suggesting that the N2H+ distribution is dictated by the amount of CO present in the gas phase, rather than its snowline location.
-
3.
In addition to the N2H+ layer outside the CO snow surface, N2H+ is predicted to be abundant in a surface layer where the gas-phase N2 abundance exceeds that of CO due to a small difference in the photodissociation rates. Only in models with N2/CO ≲ 0.2 is no surface layer present.
-
4.
The contribution of this surface layer to the total N2H+ emission depends on the disk vertical structure. For the adopted physical structure for TW Hya, in which the large grains have settled toward the midplane, the simulated N2H+ emission is dominated by the surface layer. This causes the emission to shift to even larger radii, up to ~50 AU beyond the snowline. The influence of the surface layer is much smaller in a less settled disk, and in this case the N2H+ emission does roughly trace the column density.
-
5.
The extent of the N2H+ surface layer, and therefore the shift of the emission peak, also depends on the CO abundance. Moreover, the peak integrated intensity depends on the N2/CO ratio. Together, this suggests that N2H+ may help constrain CO and N2 abundances in protoplanetary disks, provided a representative model of the physical structure is derivable from existing observations.
-
6.
An N2H+ distribution based on the freeze-out and desorption balance for CO and N2, and thus peaking directly at the CO snowline, produces an emission peak 7 AU closer to the star than observed. To reproduce the observed emission peak with the simple chemical model, a CO and N2 abundance of 3 × 10⁻⁶ is required. This is in agreement with a global CO and carbon depletion in TW Hya. The N2H+ surface layer predicted by the simple chemical model is necessary to fit both the location and the intensity of N2H+ emission peak.
-
7.
The cosmic ray ionization rate influences both the N2H+ intensity as well as the positions of the column density and emission maxima, while only the peak positions change with different CO and N2 binding energies.
-
8.
Underprediction of the emission from the region depleted of millimeter grains (radii larger than ~60 AU) reinforces the idea that N2H+ may be very sensitive to the physical structure of the disk.
The relationship between the N2H+ distribution and the CO snowline location is thus more complicated than initially assumed and simple parametrized column density fits provide only outer boundaries for the snowline radius. Instead, more detailed modeling is needed to derive the CO snowline location from N2H+ emission, and as shown in this work, a simple chemical model seems to be sufficient. However, detailed knowledge of the disk physical structure is required. On the other hand, the sensitivity to CO and N2 abundance and physical structure suggests that N2H+ may be a more versatile probe, capable of constraining CO and N2 abundances, and the thermal structure of protoplanetary disks.
The function odeint is part of the SciPy package (http://www.scipy.org/) and uses lsoda from the FORTRAN library odepack.
Acknowledgments
We thank Michiel Hogerheijde for sharing the reduced image cube of the ALMA N2H+J = 4–3 observations in TW Hya, Ilse Cleeves for fruitful discussions and the anonymous referee for useful comments to improve the manuscript. Astrochemistry in Leiden is supported by the European Union A-ERC grant 291141 CHEMPLAN, by the Netherlands Research School for Astronomy (NOVA) and by a Royal Netherlands Academy of Arts and Sciences (KNAW) professor prize. M.L.R.H. acknowledges support from a Huygens fellowship from Leiden University. C.W. acknowledges support from the Netherlands Organisation for Scientific Research (NWO, program No. 639.041.335). This paper makes use of the following ALMA data: ADS/JAO.ALMA#2011.0.00340.S. ALMA is a partnership of ESO (representing its member states), NSF (USA) and NINS (Japan), together with NRC (Canada), NSC and ASIAA (Taiwan), and KASI (Republic of Korea), in cooperation with the Republic of Chile. The Joint ALMA Observatory is operated by ESO, AUI/NRAO and NAOJ.
References
- Aikawa, Y., Ohashi, N., Inutsuka, S.-I., Herbst, E., & Takakuwa, S. 2001, ApJ, 552, 639 [NASA ADS] [CrossRef] [Google Scholar]
- Aikawa, Y., Furuya, K., Nomura, H., & Qi, C. 2015, ApJ, 807, 120 [NASA ADS] [CrossRef] [Google Scholar]
- Allen, M., & Robinson, G. W. 1977, ApJ, 212, 396 [NASA ADS] [CrossRef] [Google Scholar]
- Andersson, S., & van Dishoeck, E. F. 2008, A&A, 491, 907 [NASA ADS] [CrossRef] [EDP Sciences] [Google Scholar]
- Andrews, S. M., Wilner, D. J., Hughes, A. M., et al. 2012, ApJ, 744, 162 [NASA ADS] [CrossRef] [Google Scholar]
- Andrews, S. M., Wilner, D. J., Zhu, Z., et al. 2016, ApJ, 820, L40 [NASA ADS] [CrossRef] [Google Scholar]
- Bergin, E. A., Ciardi, D. R., Lada, C. J., Alves, J., & Lada, E. A. 2001, ApJ, 557, 209 [NASA ADS] [CrossRef] [Google Scholar]
- Bertin, M., Fayolle, E. C., Romanzin, C., et al. 2013, ApJ, 779, 120 [NASA ADS] [CrossRef] [Google Scholar]
- Bisschop, S. E., Fraser, H. J., Öberg, K. I., van Dishoeck, E. F., & Schlemmer, S. 2006, A&A, 449, 1297 [NASA ADS] [CrossRef] [EDP Sciences] [Google Scholar]
- Brinch, C., & Hogerheijde, M. R. 2010, A&A, 523, A25 [NASA ADS] [CrossRef] [EDP Sciences] [Google Scholar]
- Bruderer, S. 2013, A&A, 559, A46 [NASA ADS] [CrossRef] [EDP Sciences] [Google Scholar]
- Bruderer, S., Doty, S. D., & Benz, A. O. 2009, ApJS, 183, 179 [NASA ADS] [CrossRef] [Google Scholar]
- Bruderer, S., van Dishoeck, E. F., Doty, S. D., & Herczeg, G. J. 2012, A&A, 541, A91 [NASA ADS] [CrossRef] [EDP Sciences] [Google Scholar]
- Calvet, N., D’Alessio, P., Hartmann, L., et al. 2002, ApJ, 568, 1008 [NASA ADS] [CrossRef] [Google Scholar]
- Caselli, P., Walmsley, C. M., Tafalla, M., Dore, L., & Myers, P. C. 1999, ApJ, 523, L165 [NASA ADS] [CrossRef] [Google Scholar]
- Chiang, E., & Youdin, A. N. 2010, Ann. Rev. Earth Planet. Sci., 38, 493 [Google Scholar]
- Ciesla, F. J., & Cuzzi, J. N. 2006, Icarus, 181, 178 [NASA ADS] [CrossRef] [Google Scholar]
- Cleeves, L. I. 2016, ApJ, 816, L21 [NASA ADS] [CrossRef] [Google Scholar]
- Cleeves, L. I., Bergin, E. A., & Adams, F. C. 2014, ApJ, 794, 123 [NASA ADS] [CrossRef] [Google Scholar]
- Cleeves, L. I., Bergin, E. A., Qi, C., Adams, F. C., & Öberg, K. I. 2015, ApJ, 799, 204 [NASA ADS] [CrossRef] [Google Scholar]
- Cravens, T. E., & Dalgarno, A. 1978, ApJ, 219, 750 [NASA ADS] [CrossRef] [Google Scholar]
- Dominik, C., Dullemond, C. P., Waters, L. B. F. M., & Walch, S. 2003, A&A, 398, 607 [NASA ADS] [CrossRef] [EDP Sciences] [Google Scholar]
- Dutrey, A., Guilloteau, S., & Guelin, M. 1997, A&A, 317, L55 [NASA ADS] [Google Scholar]
- Eistrup, C., Walsh, C., & van Dishoeck, E. F. 2016, A&A, 595, A83 [NASA ADS] [CrossRef] [EDP Sciences] [Google Scholar]
- Favre, C., Cleeves, L. I., Bergin, E. A., Qi, C., & Blake, G. A. 2013, ApJ, 776, L38 [NASA ADS] [CrossRef] [Google Scholar]
- Favre, C., Bergin, E. A., Cleeves, L. I., et al. 2015, ApJ, 802, L23 [NASA ADS] [CrossRef] [Google Scholar]
- Fayolle, E. C., Balfe, J., Loomis, R., et al. 2016, ApJ, 816, L28 [NASA ADS] [CrossRef] [Google Scholar]
- France, K., Schindhelm, E., Bergin, E. A., Roueff, E., & Abgrall, H. 2014, ApJ, 784, 127 [NASA ADS] [CrossRef] [Google Scholar]
- Garrod, R. T., & Herbst, E. 2006, A&A, 457, 927 [NASA ADS] [CrossRef] [EDP Sciences] [Google Scholar]
- Gundlach, B., Kilias, S., Beitz, E., & Blum, J. 2011, Icarus, 214, 717 [NASA ADS] [CrossRef] [Google Scholar]
- Hasegawa, T. I., Herbst, E., & Leung, C. M. 1992, ApJS, 82, 167 [NASA ADS] [CrossRef] [Google Scholar]
- Heays, A. N., Visser, R., Gredel, R., et al. 2014, A&A, 562, A61 [NASA ADS] [CrossRef] [EDP Sciences] [Google Scholar]
- Herbst, E., & van Dishoeck, E. F. 2009, ARA&A, 47, 427 [NASA ADS] [CrossRef] [Google Scholar]
- Herczeg, G. J., Linsky, J. L., Valenti, J. A., Johns-Krull, C. M., & Wood, B. E. 2002, ApJ, 572, 310 [NASA ADS] [CrossRef] [Google Scholar]
- Herczeg, G. J., Wood, B. E., Linsky, J. L., Valenti, J. A., & Johns-Krull, C. M. 2004, ApJ, 607, 369 [NASA ADS] [CrossRef] [Google Scholar]
- Hughes, A. M., Wilner, D. J., Calvet, N., et al. 2007, ApJ, 664, 536 [NASA ADS] [CrossRef] [Google Scholar]
- Hughes, A. M., Wilner, D. J., Andrews, S. M., Qi, C., & Hogerheijde, M. R. 2011, ApJ, 727, 85 [NASA ADS] [CrossRef] [Google Scholar]
- Johansen, A., Oishi, J. S., Mac Low, M.-M., et al. 2007, Nature, 448, 1022 [Google Scholar]
- Jørgensen, J. K. 2004, A&A, 424, 589 [NASA ADS] [CrossRef] [EDP Sciences] [Google Scholar]
- Jørgensen, J. K., Schöier, F. L., & van Dishoeck, E. F. 2004, A&A, 416, 603 [NASA ADS] [CrossRef] [EDP Sciences] [Google Scholar]
- Kama, M., Bruderer, S., van Dishoeck, E. F., et al. 2016, A&A, 592, A83 [NASA ADS] [CrossRef] [EDP Sciences] [Google Scholar]
- Li, X., Heays, A. N., Visser, R., et al. 2013, A&A, 555, A14 [NASA ADS] [CrossRef] [EDP Sciences] [Google Scholar]
- Madhusudhan, N., Amin, M. A., & Kennedy, G. M. 2014, ApJ, 794, L12 [Google Scholar]
- Maret, S., Bergin, E. A., & Lada, C. J. 2006, Nature, 442, 425 [NASA ADS] [CrossRef] [PubMed] [Google Scholar]
- Mathews, G. S., Klaassen, P. D., Juhász, A., et al. 2013, A&A, 557, A132 [NASA ADS] [CrossRef] [EDP Sciences] [Google Scholar]
- McElroy, D., Walsh, C., Markwick, A. J., et al. 2013, A&A, 550, A36 [NASA ADS] [CrossRef] [EDP Sciences] [Google Scholar]
- Nomura, H., Tsukagoshi, T., Kawabe, R., et al. 2016, ApJ, 819, L7 [NASA ADS] [CrossRef] [Google Scholar]
- Öberg, K. I., Murray-Clay, R., & Bergin, E. A. 2011, ApJ, 743, L16 [NASA ADS] [CrossRef] [Google Scholar]
- Öberg, K. I., Furuya, K., Loomis, R., et al. 2015, ApJ, 810, 112 [NASA ADS] [CrossRef] [Google Scholar]
- Paardekooper, D., Fedoseev, G., Riedo, A., & Linnartz, H. 2016, A&A, 596, A72 [NASA ADS] [CrossRef] [EDP Sciences] [Google Scholar]
- Qi, C., Öberg, K. I., Wilner, D. J., et al. 2013, Science, 341, 630 [NASA ADS] [CrossRef] [PubMed] [Google Scholar]
- Qi, C., Öberg, K. I., Andrews, S. M., et al. 2015, ApJ, 813, 128 [NASA ADS] [CrossRef] [Google Scholar]
- Ros, K., & Johansen, A. 2013, A&A, 552, A137 [NASA ADS] [CrossRef] [EDP Sciences] [Google Scholar]
- Schwarz, K. R., Bergin, E. A., Cleeves, L. I., et al. 2016, ApJ, 823, 91 [NASA ADS] [CrossRef] [Google Scholar]
- Stevenson, D. J., & Lunine, J. I. 1988, Icarus, 75, 146 [NASA ADS] [CrossRef] [Google Scholar]
- van Dishoeck, E. F., & Black, J. H. 1988, ApJ, 334, 771 [NASA ADS] [CrossRef] [Google Scholar]
- van Leeuwen, F. 2007, A&A, 474, 653 [NASA ADS] [CrossRef] [EDP Sciences] [Google Scholar]
- van Zadelhoff, G.-J., van Dishoeck, E. F., Thi, W.-F., & Blake, G. A. 2001, A&A, 377, 566 [NASA ADS] [CrossRef] [EDP Sciences] [Google Scholar]
- Visser, R., van Dishoeck, E. F., & Black, J. H. 2009, A&A, 503, 323 [NASA ADS] [CrossRef] [EDP Sciences] [Google Scholar]
- Walsh, C., Millar, T. J., & Nomura, H. 2010, ApJ, 722, 1607 [NASA ADS] [CrossRef] [Google Scholar]
- Walsh, C., Nomura, H., & van Dishoeck, E. 2015, A&A, 582, A88 [NASA ADS] [CrossRef] [EDP Sciences] [Google Scholar]
- Woodall, J., Agúndez, M., Markwick-Kemper, A. J., & Millar, T. J. 2007, A&A, 466, 1197 [NASA ADS] [CrossRef] [EDP Sciences] [Google Scholar]
- Zhang, K., Bergin, E. A., Blake, G. A., Cleeves, L. I., & Schwarz, K. R. 2016, Nature Astronomy, submitted [Google Scholar]
Appendix A: Chemical model
Appendix A.1: Freeze-out and desorption balance
The balance between freeze-out onto dust grains and desorption back into the gas phase can be written as: 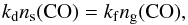 (A.1)where ns(CO) is the CO ice abundance, ng(CO) the CO gas abundance, and kf and kd are the freeze-out and desorption rates, respectively. For N2 a similar equation holds.
The freeze-out rate depends on the gas temperature Tg and is given by 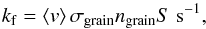 (A.2)where
  is the mean thermal velocity of molecules with mass m in the gas phase at a temperature Tg, kB is Boltzmann’s constant, σgrainngrain is the average dust-grain cross section per unit volume and S is the sticking coefficient (Allen & Robinson 1977). The sticking coefficients for CO and N2 are taken to be 0.9 and 0.85, respectively, which are the lower limits found by Bisschop et al. (2006). Assuming them to be unity does not significantly affect the results. The average dust-grain cross section per unit volume can be written as
 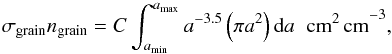 (A.3)where a is the grain radius, and amin and amax are the minimum and maximum radius, respectively, for the assumed grain size distribution. The constant of proportionality, C, can be derived from the total dust mass per unit volume, ρdust:
 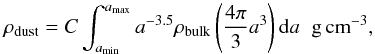 (A.4)where ρbulk is the bulk density of the dust grains. For the adopted grain size distributions, this yields results similar to assuming a typical grain size of 0.1 μm, because, although a significant fraction of the grains have grown to larger sizes, the small grains still provide the bulk of the surface area.
Thermal desorption will be considered here as the only desorption process, which is appropriate for volatile molecules such as CO and N2. The desorption rate then depends on the dust temperature Td (Allen & Robinson 1977) and can be written as 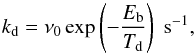 (A.5)where Eb is the binding energy of a species to the dust grain and ν0 is the characteristic vibrational frequency of an adsorbed species in its potential well (Allen & Robinson 1977),
 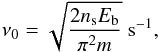 (A.6)where Eb is again the binding energy and ns = 1.5 × 1015 cm-2 is the number density of surface sites on each dust grain (Hasegawa et al. 1992). For CO and N2 a binding energy of 855 K and 800 K (Bisschop et al. 2006) are adopted, respectively, in the fiducial model.
Appendix A.2: Simple chemical network
The rate coefficients for the two-body reactions in the simple chemical network are given by the standard Arrhenius equation: 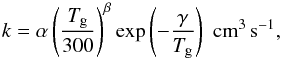 (A.7)where Tg is the gas temperature, and α, β and γ can be found in the UMIST database for Astrochemistry McElroy et al. (2013; see Table 1), while the cosmic-ray ionization rate of H2 is taken to be:
  (A.8)in the fiducial model (Cravens & Dalgarno 1978). The disk surface density is not high enough to shield cosmic rays, that is, <96 g cm-2 everywhere, so no attenuation takes place toward the disk midplane.
The photodissociation rates of CO and N2 can be written as ![Mathematical equation: \appendix \setcounter{section}{1} \begin{equation} \label{eq:pd_rate} k(r,z) = k_0(r,z) \, \mathrm{exp}(-\tau_{\mathrm{UV}}) \, \Theta[N(\mathrm{H}_2),N(\mathrm{X})] \hspace{0.2cm} \mathrm{s}^{-1}, \end{equation}](/articles/aa/full_html/2017/03/aa29452-16/aa29452-16-eq150.png) (A.9)where k0 is the unattenuated photodissociation rate, exp(−τUV) is a dust extinction term and Θ [N(H2),N(X)] is the shielding function for shielding by H2 and self-shielding (van Dishoeck & Black 1988). For CO and N2, photodissociation occurs through line absorption and the unattenuated photodissocation rates are therefore given by
(A.9)where k0 is the unattenuated photodissociation rate, exp(−τUV) is a dust extinction term and Θ [N(H2),N(X)] is the shielding function for shielding by H2 and self-shielding (van Dishoeck & Black 1988). For CO and N2, photodissociation occurs through line absorption and the unattenuated photodissocation rates are therefore given by  (A.10)where f is the oscillator strength for absorption from the lower to the upper level, η is the dissociation efficiency of the upper level, I(λ) is the mean intensity of the radiation field in photons cm-2 s-1 Å-1 at wavelength λ, and
  is a numerical factor (van Dishoeck & Black 1988). For the stellar radiation field, the attenuation by dust can be calculated from the attenuated
  and unattenuated radiation field
  :
:  (A.11)while the attenuation of the interstellar radiation field can be derived from the visual extinction:
  (A.12)where AV is the optical depth in magnitudes and the factor γ depends on the dust properties. The shielding functions depend on the H2 and CO or N2 column densities. As photons from the star can reach a molecule either through the inner edge of the disk or from above or below, an effective column density is used assuming NH = 1.59 × 10²¹AV. This is translated into effective column densities for CO and N2 by scaling with the respective abundances. Interstellar radiation on the other hand can only penetrate from the outside of the disk and for simplicity the radial contribution is ignored as this will provide only a minor contribution to the radiation field in the disk. Therefore, for shielding against the interstellar radiation field vertical column densities are used. For the adopted models, photodissociation is dominated by the stellar radiation field.
Appendix A.3: Photodesorption
Although for volatile species such as CO and N2, thermal desorption is the main desorption mechanism, the dust density in the outer disk may be low enough for UV photons to penetrate to the disk midplane, such that photodesorption may become effective. Therefore, photodesorption is included in the chemical model when studying the outer edge of the N2H+ emission (model CH-PD). The photodesorption rate for species X is given by:  (A.13)where FUV(r,z) is the UV photon flux at position (r,z), Y is the number of molecules desorbed per incident photon, σgrainngrain is again the average dust-grain cross section per unit volume and ns(X) /nice is the fraction of species X in the ice. The term XM accounts for the fact that only molecules in a few monolayers near the ice surface (Msurf) can desorb (Andersson & van Dishoeck 2008), and can be written as
  (A.14)where Mtotal is the total number of monolayers, that is, the number of molecules in the ice divided by the number of available binding sites on the dust grains. Assuming only molecules in the top four monolayers can desorb (Msurf = 4), XM is set to 1 for Mtotal ≥ 4. For mixed ices with an equal amount of CO and N2, the yield for CO and N2 is similar and we adopt values of 1.4 × 10⁻³ and 2.1 × 10⁻³ molecules photon-1, respectively (Bertin et al. 2013; Paardekooper et al. 2016). Since the uncertainty in photodesorption rates is high (see e.g., Paardekooper et al. 2016), also the extreme case with a yield 100 times higher is considered.
Appendix B: N2H+J = 4–3 peak integrated intensity
In Figs. B.1 and B.2, we show the simulated N2H+J = 4−3 peak integrated intensity for model CH and the models with different cosmic ray ionization rates (models CH-CR1 and CH-CR2), respectively.
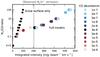 |
Fig. B.1 N2H+J = 4−3 peak integrated intensity for models with different CO and N2 abundances (models CH). The simulated emission is convolved with a |
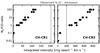 |
Fig. B.2 N2H+J = 4−3 peak integrated intensity as function of N2/CO ratio for models with a cosmic ray ionization rate of ζ = 1 × 10-19 s-1 (model CH-CR1; left panel) or ζ = 5 × 10-17 s-1 (model CH-CR2; right panel). The simulated emission is convolved with a |
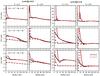 |
Fig. C.1 N2H+J = 4−3 /J = 3−2 (left panels) and J = 4−3 /J = 1−0 line ratios (right panels) for three different CO and N2 abundances, as indicated in the leftmost panels, in models with large grains settled to 20% (column one and three) or 80% of the small grain scale height (column two and four). Dashed lines show the snow surface only models, while solid lines represent the full models. The simulated emission is either convolved with a |
Appendix C: N2H+ line ratios
N2H+J = 4−3 /J = 3−2 and J = 4−3 /J = 1−0 ratios for model CH and model CH-χ0.8 are presented in Fig. C.1. The three depicted CO and N2 abundances represent models with a large N2H+ surface layer (CO = 10-4, N2 = 10-4, bottom row), a smaller N2H+ surface layer (CO = 10-6, N2 = 10-5, middle row) and no N2H+ surface layer (CO = 10-4, N2 = 10-5, top row), as shown in Fig. 6.
Appendix D: Photodesorption
The N2H+ distribution, column density profile and J = 4−3 integrated line intensity profile for the chemical model with photodesorption included (model CH-PD) are shown in Fig. D.1.
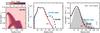 |
Fig. D.1 N2H+ distribution (left panel), column density (middle panel) and radial J = 4−3 integrated line intensity profile (right panel) when photodesorption is included in the chemistry (model CH-PD with CO and N2 abundances of 3 × 10⁻⁶; dashed black lines). The dotted blue lines show a model with photodesorption rates increased by a factor 100 (model CH-PD 100x), and the red solid lines show the fiducial model without photodesorption (model CH). The simulated emission is convolved with a |
All Tables
Offset between the CO snowline and the N2H+ column density and J = 4−3 emission peak in the different models.
All Figures
|
Fig. 1 Gas density (cm-3), gas temperature (K), and dust temperature (K) as a function of disk radius, r, and scale height, z/r, for the adopted model for the TW Hya disk. The temperature color range is limited to highlight values around the CO snow surface. The solid black contours indicate temperatures of 100, 200 and 500 K. The blue arrow indicates the location of the midplane CO snowline associated with a freeze-out temperature of 17 K, as determined by Q13, and the dashed contour indicates the corresponding snow surface. |
| In the text | |
|
Fig. 2 Schematic representation of the chemical network used to model N2H+ (red). Freeze-out and desorption products are highlighted in purple and photodissociation products are shown in blue. The processes responsible for the anti-correlation between N2H+ and CO are highlighted with red arrows. |
| In the text | |
|
Fig. 3 Distributions of CO gas, N2 gas and N2H+ in the simple chemical model (model CH) with CO and N2 abundances of 3 × 10⁻⁶. To focus on the region around the CO snow surface, the vertical scale is limited to a scale height z/r ≤ 0.2. The rightmost panel highlights the region where N2H+ is present near the disk midplane. The dashed and dash-dotted contours represent the CO and N2 snow surfaces, respectively, and the corresponding midplane snowlines are indicated by arrows below the horizontal axis of the rightmost panel. The midplane radius with the highest N2H+ abundance is marked with a red arrow. |
| In the text | |
|
Fig. 4 N2H+ column density profile (top panel) and simulated J = 4–3 line emission (middle and bottom panels) for the N2H+ distributions predicted by the simple chemical model with CO and N2 abundances of 3 × 10⁻⁶ (model CH; red lines) and a model incorporating only freeze-out and desorption (model FD; black lines). Integrated line intensity profiles are shown after convolution with a |
| In the text | |
|
Fig. 5 Position of the N2H+ column density peak in model CH for different CO and N2 abundances. The best-fit model with abundances of 3 × 10⁻⁶, as shown in Fig. 3, is indicated by a star and the color of the symbols represents the value of the N2/CO ratio. The vertical red line marks the location of the CO snowline in the models. |
| In the text | |
|
Fig. 6 Distribution of N2H+ in the simple chemical model (model CH) for different N2 and CO abundances as listed above the panels. To focus on the region around the CO snow surface, the vertical scale is limited to a scale height z/r ≤ 0.25. The dashed contour represents the CO snow surface. |
| In the text | |
|
Fig. 7 Position of the N2H+ column density peak in the different models (listed in the lower right corner of each panel) for different CO and N2 abundances. From left to right and top to bottom: the fiducial models (CH), models with both CO and N2 binding energies increased (CH-Eb1), models with only CO binding energy increased (CH-Eb2), models with large grains settled to only 80% of small grain scale height (CH-χ0.8), models with a lower cosmic ray ionization rate (1 × 10-19 s-1; CH-CR1) and models with a higher cosmic ray ionization rate (5 × 10-17 s-1; CH-CR2). Models with N2/CO ratios <1 are highlighted with blue plus signs. Red circles in the left panels represent the snow surface only models, i.e., N2H+ removed above the CO snow surface. The red lines mark the location of the CO snowline in the models. The gray line indicates the position of the observed emission peak. |
| In the text | |
|
Fig. 8 As Fig. 7, but for the position of the simulated N2H+J = 4−3 emission peak after convolution with a |
| In the text | |
|
Fig. 9 N2H+ distribution predicted by the simple chemical model for a physical structure with the large grains settled to only 80% of the small grain scale height (model CH-χ0.8). Abundances of 3 × 10⁻⁶ are adopted for both CO and N2. |
| In the text | |
|
Fig. 10 Position of the N2H+J = 4−3 (black circles), J = 3−2 (blue plus signs) and J = 1−0 (red crosses) emission peaks for different CO and N2 abundances in the simple chemical model (model CH; top panels) and the corresponding snow surface only models, i.e., N2H+ removed above the CO snow surface (bottom panels). The emission is convolved with a |
| In the text | |
|
Fig. 11 Schematic representation of the distribution of gas-phase CO (blue) and N2H+ (red) in disks with either a steep vertical temperature profile, as for TW Hya (left), or a shallow vertical temperature profile (right). These differences can be due to different degrees of grain settling. To highlight the region around the CO snowline, the vertical direction depicts scale height, z/r. The dashed black contour represents the CO snow surface and the light blue area directly outside this contour shows that, at the snow surface, the gas phase abundance drops by 50%. The N2H+ surface layer is indicated by dotted red lines. The predicted column density profiles are shown below. For N2H+, the column density profile is shown with (dotted line) and without (solid line) the surface layer. The vertical dashed black line indicates the location of the midplane CO snowline. |
| In the text | |
|
Fig. B.1 N2H+J = 4−3 peak integrated intensity for models with different CO and N2 abundances (models CH). The simulated emission is convolved with a |
| In the text | |
|
Fig. B.2 N2H+J = 4−3 peak integrated intensity as function of N2/CO ratio for models with a cosmic ray ionization rate of ζ = 1 × 10-19 s-1 (model CH-CR1; left panel) or ζ = 5 × 10-17 s-1 (model CH-CR2; right panel). The simulated emission is convolved with a |
| In the text | |
|
Fig. C.1 N2H+J = 4−3 /J = 3−2 (left panels) and J = 4−3 /J = 1−0 line ratios (right panels) for three different CO and N2 abundances, as indicated in the leftmost panels, in models with large grains settled to 20% (column one and three) or 80% of the small grain scale height (column two and four). Dashed lines show the snow surface only models, while solid lines represent the full models. The simulated emission is either convolved with a |
| In the text | |
|
Fig. D.1 N2H+ distribution (left panel), column density (middle panel) and radial J = 4−3 integrated line intensity profile (right panel) when photodesorption is included in the chemistry (model CH-PD with CO and N2 abundances of 3 × 10⁻⁶; dashed black lines). The dotted blue lines show a model with photodesorption rates increased by a factor 100 (model CH-PD 100x), and the red solid lines show the fiducial model without photodesorption (model CH). The simulated emission is convolved with a |
| In the text | |
Current usage metrics show cumulative count of Article Views (full-text article views including HTML views, PDF and ePub downloads, according to the available data) and Abstracts Views on Vision4Press platform.
Data correspond to usage on the plateform after 2015. The current usage metrics is available 48-96 hours after online publication and is updated daily on week days.
Initial download of the metrics may take a while.