Free Access
Fig. 5
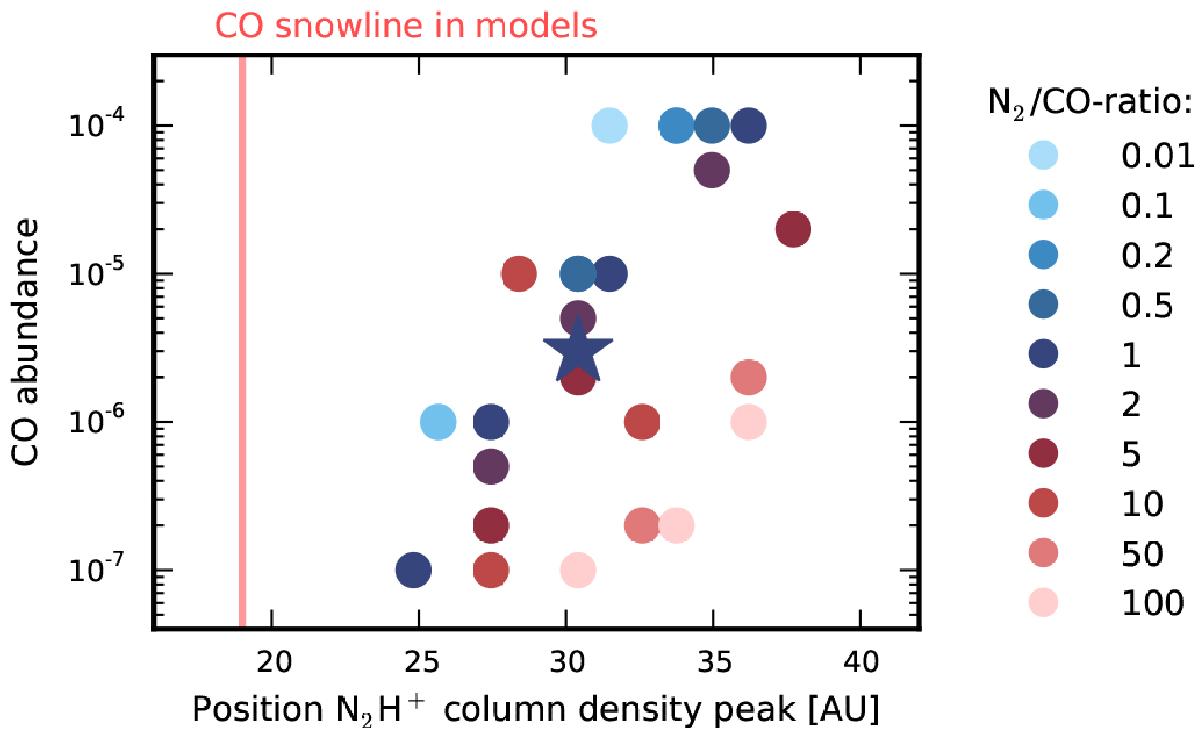
Position of the N2H+ column density peak in model CH for different CO and N2 abundances. The best-fit model with abundances of 3 × 10⁻⁶, as shown in Fig. 3, is indicated by a star and the color of the symbols represents the value of the N2/CO ratio. The vertical red line marks the location of the CO snowline in the models.
Current usage metrics show cumulative count of Article Views (full-text article views including HTML views, PDF and ePub downloads, according to the available data) and Abstracts Views on Vision4Press platform.
Data correspond to usage on the plateform after 2015. The current usage metrics is available 48-96 hours after online publication and is updated daily on week days.
Initial download of the metrics may take a while.