Fig. 7
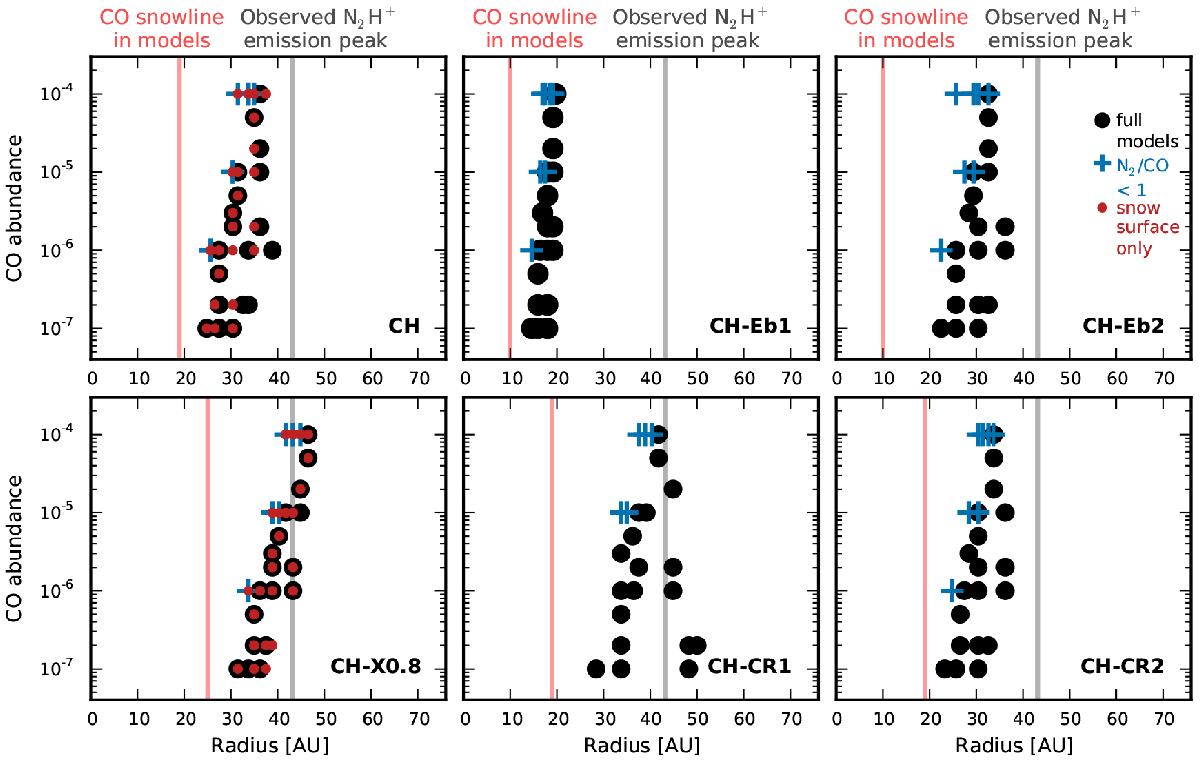
Position of the N2H+ column density peak in the different models (listed in the lower right corner of each panel) for different CO and N2 abundances. From left to right and top to bottom: the fiducial models (CH), models with both CO and N2 binding energies increased (CH-Eb1), models with only CO binding energy increased (CH-Eb2), models with large grains settled to only 80% of small grain scale height (CH-χ0.8), models with a lower cosmic ray ionization rate (1 × 10-19 s-1; CH-CR1) and models with a higher cosmic ray ionization rate (5 × 10-17 s-1; CH-CR2). Models with N2/CO ratios <1 are highlighted with blue plus signs. Red circles in the left panels represent the snow surface only models, i.e., N2H+ removed above the CO snow surface. The red lines mark the location of the CO snowline in the models. The gray line indicates the position of the observed emission peak.
Current usage metrics show cumulative count of Article Views (full-text article views including HTML views, PDF and ePub downloads, according to the available data) and Abstracts Views on Vision4Press platform.
Data correspond to usage on the plateform after 2015. The current usage metrics is available 48-96 hours after online publication and is updated daily on week days.
Initial download of the metrics may take a while.