Fig. 10
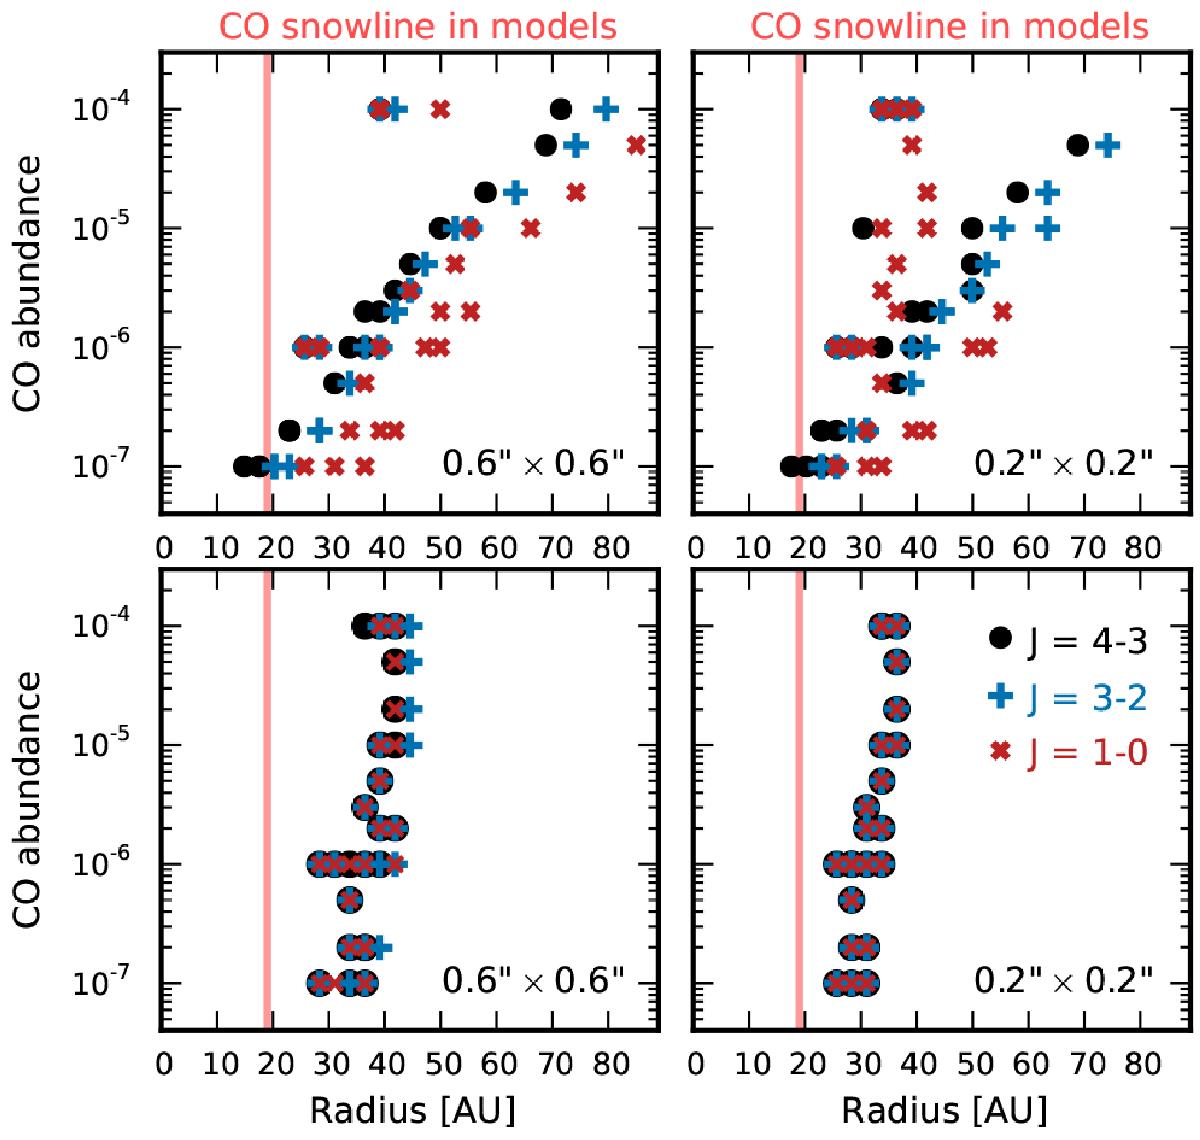
Position of the N2H+J = 4−3 (black circles), J = 3−2 (blue plus signs) and J = 1−0 (red crosses) emission peaks for different CO and N2 abundances in the simple chemical model (model CH; top panels) and the corresponding snow surface only models, i.e., N2H+ removed above the CO snow surface (bottom panels). The emission is convolved with a ![]() beam (left panels) or
beam (left panels) or ![]() beam (right panels). The red lines mark the location of the CO snowline in the models.
beam (right panels). The red lines mark the location of the CO snowline in the models.
Current usage metrics show cumulative count of Article Views (full-text article views including HTML views, PDF and ePub downloads, according to the available data) and Abstracts Views on Vision4Press platform.
Data correspond to usage on the plateform after 2015. The current usage metrics is available 48-96 hours after online publication and is updated daily on week days.
Initial download of the metrics may take a while.