Free Access
Fig. 2
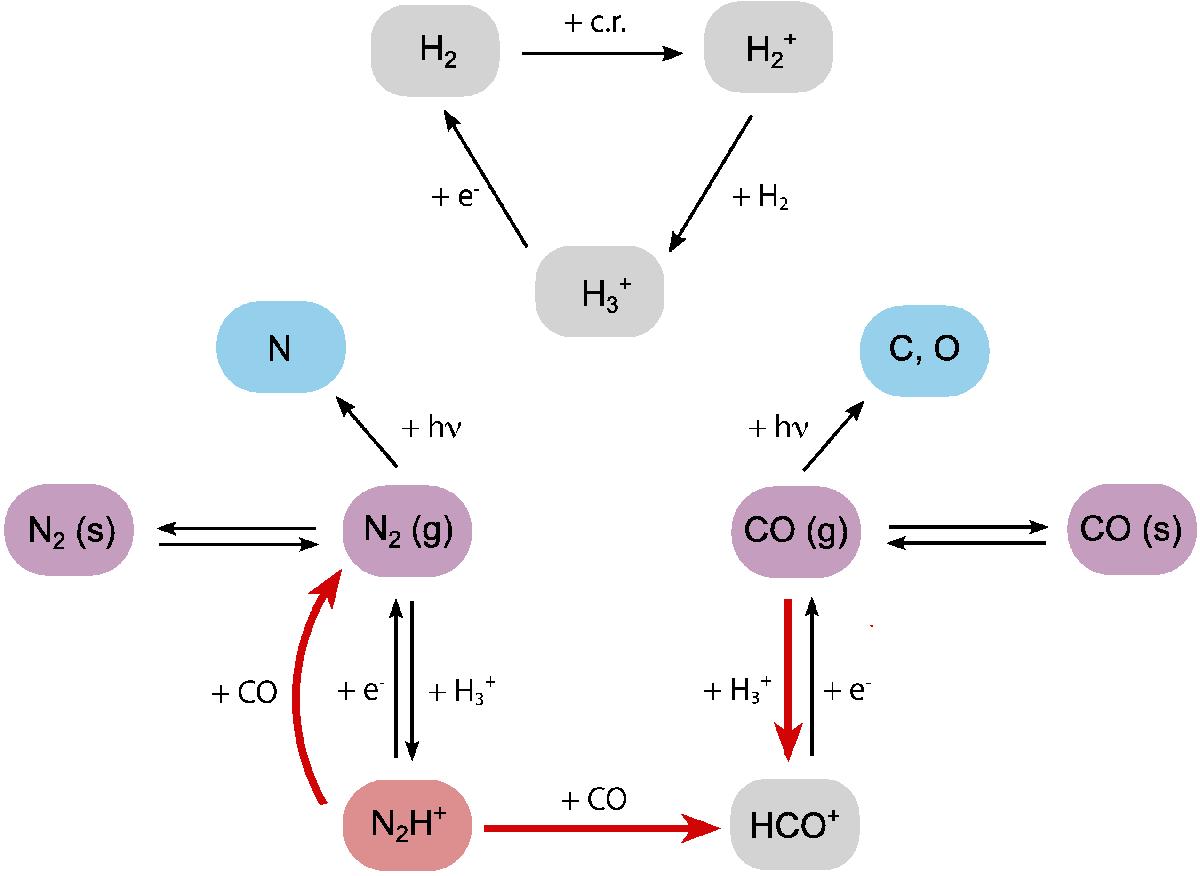
Schematic representation of the chemical network used to model N2H+ (red). Freeze-out and desorption products are highlighted in purple and photodissociation products are shown in blue. The processes responsible for the anti-correlation between N2H+ and CO are highlighted with red arrows.
Current usage metrics show cumulative count of Article Views (full-text article views including HTML views, PDF and ePub downloads, according to the available data) and Abstracts Views on Vision4Press platform.
Data correspond to usage on the plateform after 2015. The current usage metrics is available 48-96 hours after online publication and is updated daily on week days.
Initial download of the metrics may take a while.