Fig. 4
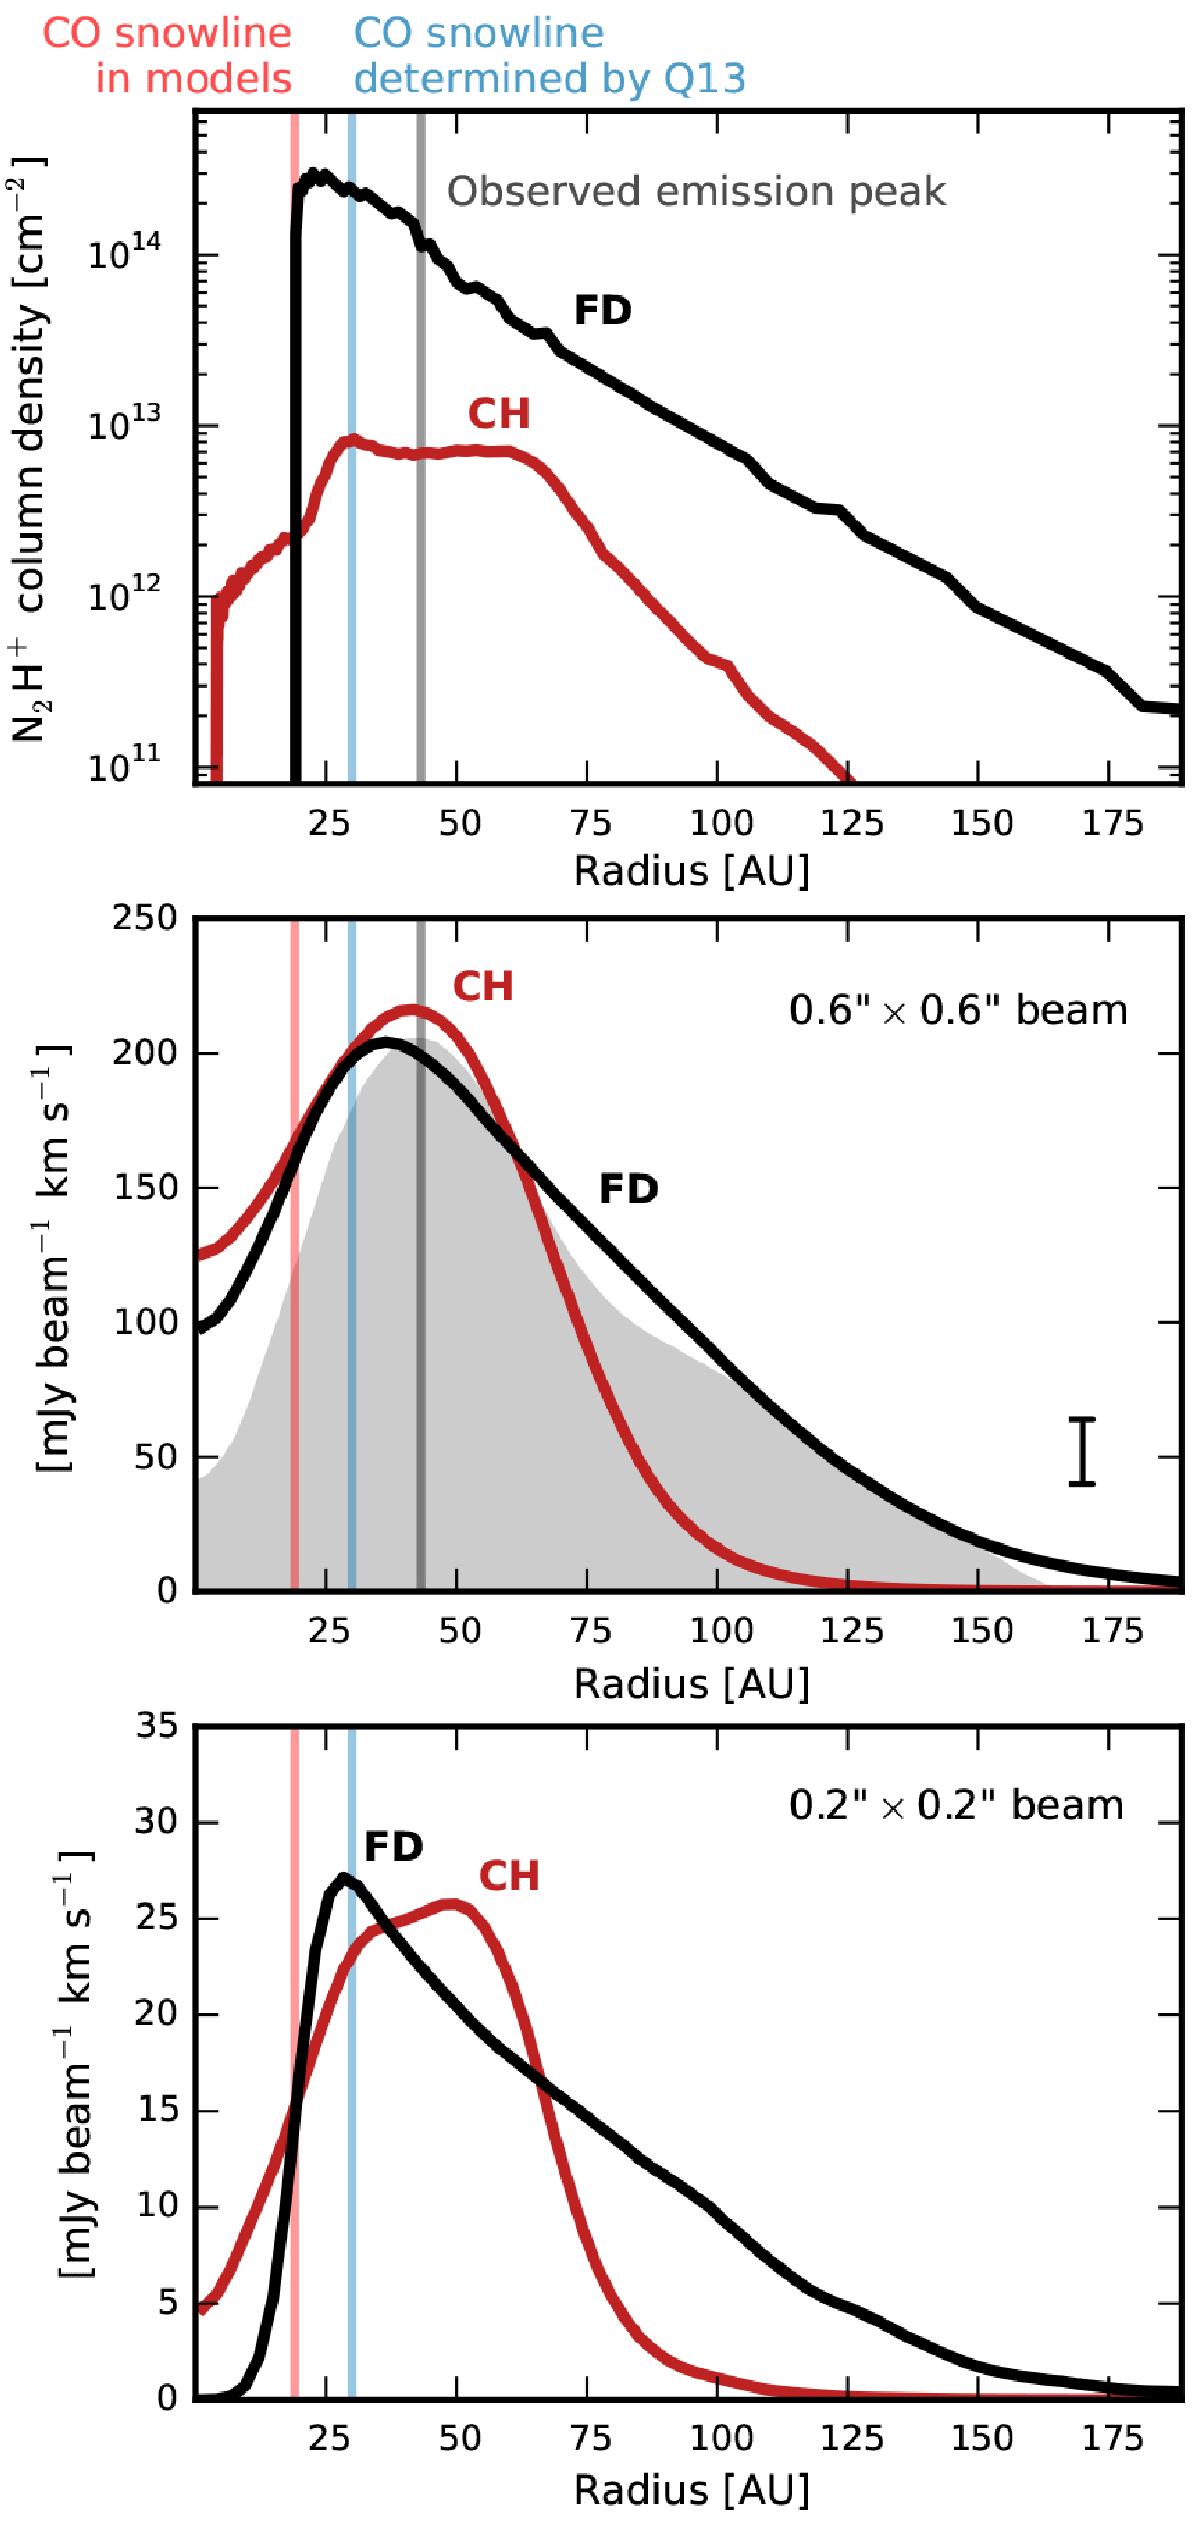
N2H+ column density profile (top panel) and simulated J = 4–3 line emission (middle and bottom panels) for the N2H+ distributions predicted by the simple chemical model with CO and N2 abundances of 3 × 10⁻⁶ (model CH; red lines) and a model incorporating only freeze-out and desorption (model FD; black lines). Integrated line intensity profiles are shown after convolution with a ![]() beam (middle panel) or a
beam (middle panel) or a ![]() beam (bottom panel). Observations by Q13 are shown in gray in the middle panel with the 3σ-error depicted in the lower right corner. The vertical gray line marks the position of the observed emission peak. The vertical blue line indicates the position of the midplane CO snowline inferred from these observations by Q13, while the red line indicates the location of the midplane CO snowline in the models.
beam (bottom panel). Observations by Q13 are shown in gray in the middle panel with the 3σ-error depicted in the lower right corner. The vertical gray line marks the position of the observed emission peak. The vertical blue line indicates the position of the midplane CO snowline inferred from these observations by Q13, while the red line indicates the location of the midplane CO snowline in the models.
Current usage metrics show cumulative count of Article Views (full-text article views including HTML views, PDF and ePub downloads, according to the available data) and Abstracts Views on Vision4Press platform.
Data correspond to usage on the plateform after 2015. The current usage metrics is available 48-96 hours after online publication and is updated daily on week days.
Initial download of the metrics may take a while.