Fig. C.1
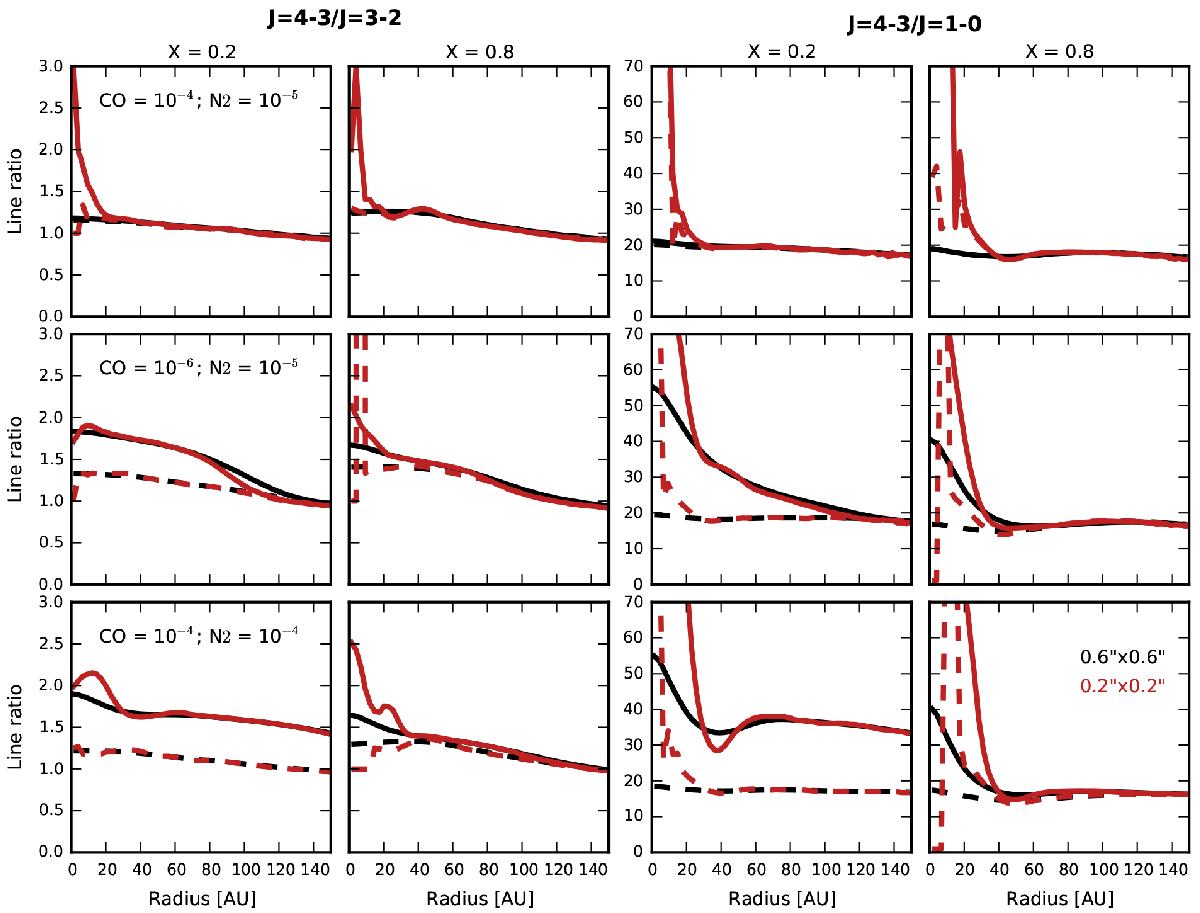
N2H+J = 4−3 /J = 3−2 (left panels) and J = 4−3 /J = 1−0 line ratios (right panels) for three different CO and N2 abundances, as indicated in the leftmost panels, in models with large grains settled to 20% (column one and three) or 80% of the small grain scale height (column two and four). Dashed lines show the snow surface only models, while solid lines represent the full models. The simulated emission is either convolved with a ![]() (black lines) or
(black lines) or ![]() beam (red lines).
beam (red lines).
Current usage metrics show cumulative count of Article Views (full-text article views including HTML views, PDF and ePub downloads, according to the available data) and Abstracts Views on Vision4Press platform.
Data correspond to usage on the plateform after 2015. The current usage metrics is available 48-96 hours after online publication and is updated daily on week days.
Initial download of the metrics may take a while.