Fig. 1
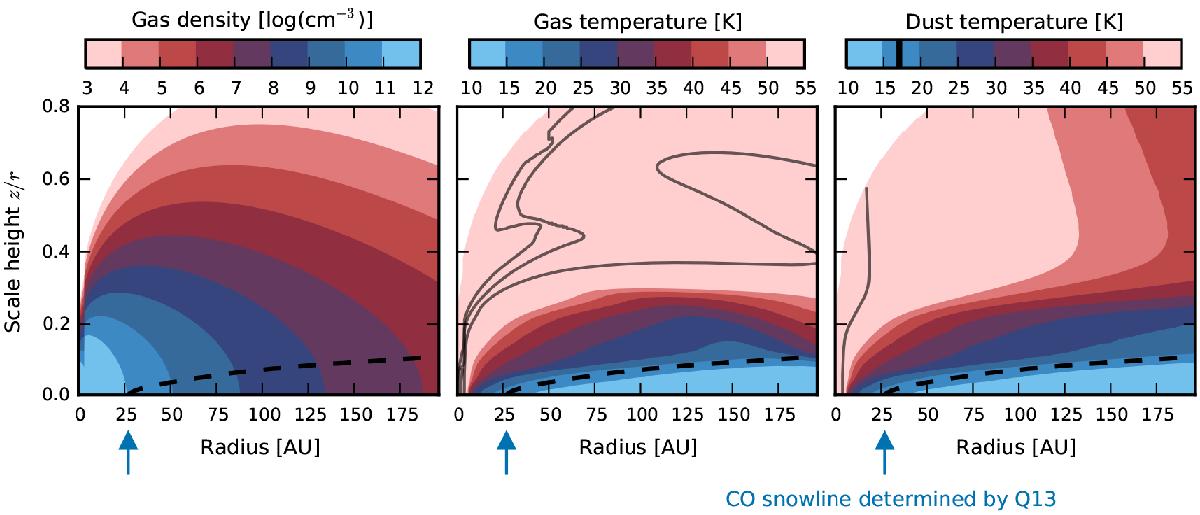
Gas density (cm-3), gas temperature (K), and dust temperature (K) as a function of disk radius, r, and scale height, z/r, for the adopted model for the TW Hya disk. The temperature color range is limited to highlight values around the CO snow surface. The solid black contours indicate temperatures of 100, 200 and 500 K. The blue arrow indicates the location of the midplane CO snowline associated with a freeze-out temperature of 17 K, as determined by Q13, and the dashed contour indicates the corresponding snow surface.
Current usage metrics show cumulative count of Article Views (full-text article views including HTML views, PDF and ePub downloads, according to the available data) and Abstracts Views on Vision4Press platform.
Data correspond to usage on the plateform after 2015. The current usage metrics is available 48-96 hours after online publication and is updated daily on week days.
Initial download of the metrics may take a while.